Free Statistics

of Irreproducible Research!

Author's title

Author*The author of this computation has been verified*
R Software Modulerwasp_cross.wasp
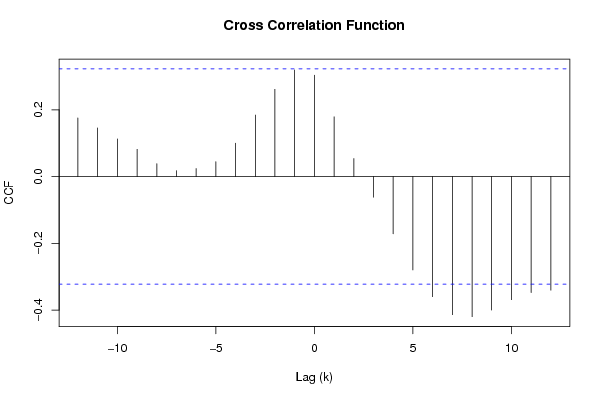
Title produced by softwareCross Correlation Function
Date of computationTue, 02 Dec 2008 12:33:32 -0700
Cite this page as followsStatistical Computations at FreeStatistics.org, Office for Research Development and Education, URL https://freestatistics.org/blog/index.php?v=date/2008/Dec/02/t1228246479l3c97lspto36u5j.htm/, Retrieved Sun, 19 May 2024 12:03:38 +0000
Statistical Computations at FreeStatistics.org, Office for Research Development and Education, URL https://freestatistics.org/blog/index.php?pk=28242, Retrieved Sun, 19 May 2024 12:03:38 +0000
QR Codes:

Original text written by user:
IsPrivate?No (this computation is public)
User-defined keywords
Estimated Impact129
Family? (F = Feedback message, R = changed R code, M = changed R Module, P = changed Parameters, D = changed Data)
F     [Univariate Data Series] [Airline data] [2007-10-18 09:58:47] [42daae401fd3def69a25014f2252b4c2]
F RMPD    [Cross Correlation Function] [Cross Correlation...] [2008-12-02 19:33:32] [96839c4b6d4e03ef3851369c676780bf] [Current]
Feedback Forum
2008-12-06 14:11:11 [Ken Wright] [reply
juist,met de cross correlatiefunctie kan men nagaan in hoeverre Y te verklaren valt door het verleden van X. Wanneer k groter is dan 0 geeft het de correlatie weer tussen de toekomstige x en het heden van Y .

Post a new message
Dataseries X:
117.6
121.7
127.3
129.8
137.1
141.4
137.4
130.7
117.2
110.8
111.4
108.2
108.8
110.2
109.5
109.5
116
111.2
112.1
114
119.1
114.1
115.1
115.4
110.8
116
119.2
126.5
127.8
131.3
140.3
137.3
143
134.5
139.9
159.3
170.4
Dataseries Y:
147.4
148
158.1
165
187
190.3
182.4
168.8
151.2
120.1
112.5
106.2
107.1
108.5
106.5
108.3
125.6
124
127.2
136.9
135.8
124.3
115.4
113.6
114.4
118.4
117
116.5
115.4
113.6
117.4
116.9
116.4
111.1
110.2
118.9
131.8


Summary of computational transaction
Raw Inputview raw input (R code)
Raw Outputview raw output of R engine
Computing time3 seconds
R Server'Herman Ole Andreas Wold' @ 193.190.124.10:1001

\begin{tabular}{lllllllll}
\hline
Summary of computational transaction \tabularnewline
Raw Input & view raw input (R code)  \tabularnewline
Raw Output & view raw output of R engine  \tabularnewline
Computing time & 3 seconds \tabularnewline
R Server & 'Herman Ole Andreas Wold' @ 193.190.124.10:1001 \tabularnewline
\hline
\end{tabular}
%Source: https://freestatistics.org/blog/index.php?pk=28242&T=0

[TABLE]
[ROW][C]Summary of computational transaction[/C][/ROW]
[ROW][C]Raw Input[/C][C]view raw input (R code) [/C][/ROW]
[ROW][C]Raw Output[/C][C]view raw output of R engine [/C][/ROW]
[ROW][C]Computing time[/C][C]3 seconds[/C][/ROW]
[ROW][C]R Server[/C][C]'Herman Ole Andreas Wold' @ 193.190.124.10:1001[/C][/ROW]
[/TABLE]
Source: https://freestatistics.org/blog/index.php?pk=28242&T=0

Globally Unique Identifier (entire table): ba.freestatistics.org/blog/index.php?pk=28242&T=0

As an alternative you can also use a QR Code:  

The GUIDs for individual cells are displayed in the table below:

Summary of computational transaction
Raw Inputview raw input (R code)
Raw Outputview raw output of R engine
Computing time3 seconds
R Server'Herman Ole Andreas Wold' @ 193.190.124.10:1001


Cross Correlation Function
ParameterValue
Box-Cox transformation parameter (lambda) of X series1
Degree of non-seasonal differencing (d) of X series0
Degree of seasonal differencing (D) of X series0
Seasonal Period (s)12
Box-Cox transformation parameter (lambda) of Y series1
Degree of non-seasonal differencing (d) of Y series0
Degree of seasonal differencing (D) of Y series0
krho(Y[t],X[t+k])
-120.175492836327476
-110.145490970044179
-100.112496785163964
-90.0816103594596905
-80.0383462458165948
-70.0176094846797480
-60.0238186425415298
-50.0443308422154431
-40.0999195815857498
-30.183963186757752
-20.261308435526128
-10.31937221076332
00.303652105673513
10.178740486149712
20.0537768024550317
3-0.0620299437132211
4-0.171456990014115
5-0.279944053744387
6-0.360137695247346
7-0.413807734923799
8-0.419771496001397
9-0.400056013225064
10-0.369146946303156
11-0.347768726518715
12-0.340456315356186

\begin{tabular}{lllllllll}
\hline
Cross Correlation Function \tabularnewline
Parameter & Value \tabularnewline
Box-Cox transformation parameter (lambda) of X series & 1 \tabularnewline
Degree of non-seasonal differencing (d) of X series & 0 \tabularnewline
Degree of seasonal differencing (D) of X series & 0 \tabularnewline
Seasonal Period (s) & 12 \tabularnewline
Box-Cox transformation parameter (lambda) of Y series & 1 \tabularnewline
Degree of non-seasonal differencing (d) of Y series & 0 \tabularnewline
Degree of seasonal differencing (D) of Y series & 0 \tabularnewline
k & rho(Y[t],X[t+k]) \tabularnewline
-12 & 0.175492836327476 \tabularnewline
-11 & 0.145490970044179 \tabularnewline
-10 & 0.112496785163964 \tabularnewline
-9 & 0.0816103594596905 \tabularnewline
-8 & 0.0383462458165948 \tabularnewline
-7 & 0.0176094846797480 \tabularnewline
-6 & 0.0238186425415298 \tabularnewline
-5 & 0.0443308422154431 \tabularnewline
-4 & 0.0999195815857498 \tabularnewline
-3 & 0.183963186757752 \tabularnewline
-2 & 0.261308435526128 \tabularnewline
-1 & 0.31937221076332 \tabularnewline
0 & 0.303652105673513 \tabularnewline
1 & 0.178740486149712 \tabularnewline
2 & 0.0537768024550317 \tabularnewline
3 & -0.0620299437132211 \tabularnewline
4 & -0.171456990014115 \tabularnewline
5 & -0.279944053744387 \tabularnewline
6 & -0.360137695247346 \tabularnewline
7 & -0.413807734923799 \tabularnewline
8 & -0.419771496001397 \tabularnewline
9 & -0.400056013225064 \tabularnewline
10 & -0.369146946303156 \tabularnewline
11 & -0.347768726518715 \tabularnewline
12 & -0.340456315356186 \tabularnewline
\hline
\end{tabular}
%Source: https://freestatistics.org/blog/index.php?pk=28242&T=1

[TABLE]
[ROW][C]Cross Correlation Function[/C][/ROW]
[ROW][C]Parameter[/C][C]Value[/C][/ROW]
[ROW][C]Box-Cox transformation parameter (lambda) of X series[/C][C]1[/C][/ROW]
[ROW][C]Degree of non-seasonal differencing (d) of X series[/C][C]0[/C][/ROW]
[ROW][C]Degree of seasonal differencing (D) of X series[/C][C]0[/C][/ROW]
[ROW][C]Seasonal Period (s)[/C][C]12[/C][/ROW]
[ROW][C]Box-Cox transformation parameter (lambda) of Y series[/C][C]1[/C][/ROW]
[ROW][C]Degree of non-seasonal differencing (d) of Y series[/C][C]0[/C][/ROW]
[ROW][C]Degree of seasonal differencing (D) of Y series[/C][C]0[/C][/ROW]
[ROW][C]k[/C][C]rho(Y[t],X[t+k])[/C][/ROW]
[ROW][C]-12[/C][C]0.175492836327476[/C][/ROW]
[ROW][C]-11[/C][C]0.145490970044179[/C][/ROW]
[ROW][C]-10[/C][C]0.112496785163964[/C][/ROW]
[ROW][C]-9[/C][C]0.0816103594596905[/C][/ROW]
[ROW][C]-8[/C][C]0.0383462458165948[/C][/ROW]
[ROW][C]-7[/C][C]0.0176094846797480[/C][/ROW]
[ROW][C]-6[/C][C]0.0238186425415298[/C][/ROW]
[ROW][C]-5[/C][C]0.0443308422154431[/C][/ROW]
[ROW][C]-4[/C][C]0.0999195815857498[/C][/ROW]
[ROW][C]-3[/C][C]0.183963186757752[/C][/ROW]
[ROW][C]-2[/C][C]0.261308435526128[/C][/ROW]
[ROW][C]-1[/C][C]0.31937221076332[/C][/ROW]
[ROW][C]0[/C][C]0.303652105673513[/C][/ROW]
[ROW][C]1[/C][C]0.178740486149712[/C][/ROW]
[ROW][C]2[/C][C]0.0537768024550317[/C][/ROW]
[ROW][C]3[/C][C]-0.0620299437132211[/C][/ROW]
[ROW][C]4[/C][C]-0.171456990014115[/C][/ROW]
[ROW][C]5[/C][C]-0.279944053744387[/C][/ROW]
[ROW][C]6[/C][C]-0.360137695247346[/C][/ROW]
[ROW][C]7[/C][C]-0.413807734923799[/C][/ROW]
[ROW][C]8[/C][C]-0.419771496001397[/C][/ROW]
[ROW][C]9[/C][C]-0.400056013225064[/C][/ROW]
[ROW][C]10[/C][C]-0.369146946303156[/C][/ROW]
[ROW][C]11[/C][C]-0.347768726518715[/C][/ROW]
[ROW][C]12[/C][C]-0.340456315356186[/C][/ROW]
[/TABLE]
Source: https://freestatistics.org/blog/index.php?pk=28242&T=1

Globally Unique Identifier (entire table): ba.freestatistics.org/blog/index.php?pk=28242&T=1

As an alternative you can also use a QR Code:  

The GUIDs for individual cells are displayed in the table below:

Cross Correlation Function
ParameterValue
Box-Cox transformation parameter (lambda) of X series1
Degree of non-seasonal differencing (d) of X series0
Degree of seasonal differencing (D) of X series0
Seasonal Period (s)12
Box-Cox transformation parameter (lambda) of Y series1
Degree of non-seasonal differencing (d) of Y series0
Degree of seasonal differencing (D) of Y series0
krho(Y[t],X[t+k])
-120.175492836327476
-110.145490970044179
-100.112496785163964
-90.0816103594596905
-80.0383462458165948
-70.0176094846797480
-60.0238186425415298
-50.0443308422154431
-40.0999195815857498
-30.183963186757752
-20.261308435526128
-10.31937221076332
00.303652105673513
10.178740486149712
20.0537768024550317
3-0.0620299437132211
4-0.171456990014115
5-0.279944053744387
6-0.360137695247346
7-0.413807734923799
8-0.419771496001397
9-0.400056013225064
10-0.369146946303156
11-0.347768726518715
12-0.340456315356186


Parameters (Session):
par1 = 1 ; par2 = 0 ; par3 = 0 ; par4 = 12 ; par5 = 1 ; par6 = 0 ; par7 = 0 ;
Parameters (R input):
par1 = 1 ; par2 = 0 ; par3 = 0 ; par4 = 12 ; par5 = 1 ; par6 = 0 ; par7 = 0 ;
R code (references can be found in the software module):
par1 <- as.numeric(par1)
par2 <- as.numeric(par2)
par3 <- as.numeric(par3)
par4 <- as.numeric(par4)
par5 <- as.numeric(par5)
par6 <- as.numeric(par6)
par7 <- as.numeric(par7)
if (par1 == 0) {
x <- log(x)
} else {
x <- (x ^ par1 - 1) / par1
}
if (par5 == 0) {
y <- log(y)
} else {
y <- (y ^ par5 - 1) / par5
}
if (par2 > 0) x <- diff(x,lag=1,difference=par2)
if (par6 > 0) y <- diff(y,lag=1,difference=par6)
if (par3 > 0) x <- diff(x,lag=par4,difference=par3)
if (par7 > 0) y <- diff(y,lag=par4,difference=par7)
x
y
bitmap(file='test1.png')
(r <- ccf(x,y,main='Cross Correlation Function',ylab='CCF',xlab='Lag (k)'))
dev.off()
load(file='createtable')
a<-table.start()
a<-table.row.start(a)
a<-table.element(a,'Cross Correlation Function',2,TRUE)
a<-table.row.end(a)
a<-table.row.start(a)
a<-table.element(a,'Parameter',header=TRUE)
a<-table.element(a,'Value',header=TRUE)
a<-table.row.end(a)
a<-table.row.start(a)
a<-table.element(a,'Box-Cox transformation parameter (lambda) of X series',header=TRUE)
a<-table.element(a,par1)
a<-table.row.end(a)
a<-table.row.start(a)
a<-table.element(a,'Degree of non-seasonal differencing (d) of X series',header=TRUE)
a<-table.element(a,par2)
a<-table.row.end(a)
a<-table.row.start(a)
a<-table.element(a,'Degree of seasonal differencing (D) of X series',header=TRUE)
a<-table.element(a,par3)
a<-table.row.end(a)
a<-table.row.start(a)
a<-table.element(a,'Seasonal Period (s)',header=TRUE)
a<-table.element(a,par4)
a<-table.row.end(a)
a<-table.row.start(a)
a<-table.element(a,'Box-Cox transformation parameter (lambda) of Y series',header=TRUE)
a<-table.element(a,par5)
a<-table.row.end(a)
a<-table.row.start(a)
a<-table.element(a,'Degree of non-seasonal differencing (d) of Y series',header=TRUE)
a<-table.element(a,par6)
a<-table.row.end(a)
a<-table.row.start(a)
a<-table.element(a,'Degree of seasonal differencing (D) of Y series',header=TRUE)
a<-table.element(a,par7)
a<-table.row.end(a)
a<-table.row.start(a)
a<-table.element(a,'k',header=TRUE)
a<-table.element(a,'rho(Y[t],X[t+k])',header=TRUE)
a<-table.row.end(a)
mylength <- length(r$acf)
myhalf <- floor((mylength-1)/2)
for (i in 1:mylength) {
a<-table.row.start(a)
a<-table.element(a,i-myhalf-1,header=TRUE)
a<-table.element(a,r$acf[i])
a<-table.row.end(a)
}
a<-table.end(a)
table.save(a,file='mytable.tab')