Free Statistics

of Irreproducible Research!

Author's title

Author*The author of this computation has been verified*
R Software Modulerwasp_smp.wasp
Title produced by softwareStandard Deviation-Mean Plot
Date of computationTue, 02 Dec 2008 12:26:29 -0700
Cite this page as followsStatistical Computations at FreeStatistics.org, Office for Research Development and Education, URL https://freestatistics.org/blog/index.php?v=date/2008/Dec/02/t1228246150pvy840vnhkhmzx5.htm/, Retrieved Sun, 19 May 2024 10:48:49 +0000
Statistical Computations at FreeStatistics.org, Office for Research Development and Education, URL https://freestatistics.org/blog/index.php?pk=28223, Retrieved Sun, 19 May 2024 10:48:49 +0000
QR Codes:

Original text written by user:
IsPrivate?No (this computation is public)
User-defined keywordsnon stationary time series , Q8
Estimated Impact139
Family? (F = Feedback message, R = changed R code, M = changed R Module, P = changed Parameters, D = changed Data)
F       [Standard Deviation-Mean Plot] [loïqueverhasselt] [2008-12-02 19:26:29] [6440ec5a21e5d35520cb2ae6b4b70e45] [Current]
Feedback Forum
2008-12-09 20:46:26 [Gert-Jan Geudens] [reply
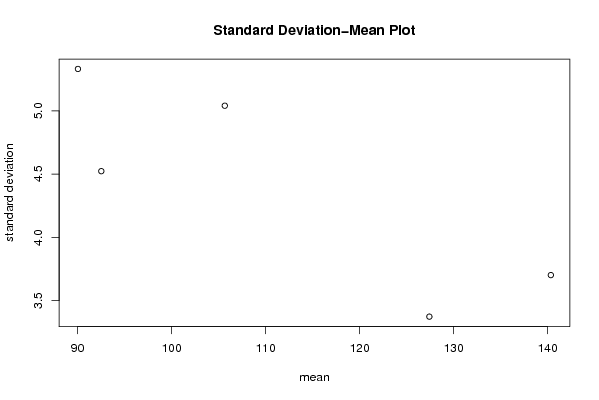
De conclusie is correct. Je moet hier wel opletten dat de p-waarde zeker niet groter wordt. deze is nu al gelijk aan 0.07. Als de p-waarde te groot is (in principe groter dan 0.05) is de transformatie nutteloos, al denken we dat in dit geval, de transformatie nog wel zinvol kan zijn. De p-waarde is dan ook niet zo heel groot en we kunnen ongeveer een dalende regressierechte tekenen door de punten in de standard-deviation mean plot

Post a new message
Dataseries X:
99,4
97,5
94,6
92,6
92,5
89,8
88,8
87,4
85,2
83,1
84,7
84,8
85,8
86,3
89
89
89,3
91,9
94,9
94,4
96,8
96,9
98
97,9
100,9
103,9
103,1
102,5
104,3
102,6
101,7
102,8
105,4
110,9
113,5
116,3
124
128,8
133,5
132,6
128,4
127,3
126,7
123,3
123,2
124,4
128,2
128,7
135,7
139
145,4
142,4
137,7
137
137,1
139,3
139,6
140,4
142,3
148,3


Summary of computational transaction
Raw Inputview raw input (R code)
Raw Outputview raw output of R engine
Computing time49 seconds
R Server'Gwilym Jenkins' @ 72.249.127.135

\begin{tabular}{lllllllll}
\hline
Summary of computational transaction \tabularnewline
Raw Input & view raw input (R code)  \tabularnewline
Raw Output & view raw output of R engine  \tabularnewline
Computing time & 49 seconds \tabularnewline
R Server & 'Gwilym Jenkins' @ 72.249.127.135 \tabularnewline
\hline
\end{tabular}
%Source: https://freestatistics.org/blog/index.php?pk=28223&T=0

[TABLE]
[ROW][C]Summary of computational transaction[/C][/ROW]
[ROW][C]Raw Input[/C][C]view raw input (R code) [/C][/ROW]
[ROW][C]Raw Output[/C][C]view raw output of R engine [/C][/ROW]
[ROW][C]Computing time[/C][C]49 seconds[/C][/ROW]
[ROW][C]R Server[/C][C]'Gwilym Jenkins' @ 72.249.127.135[/C][/ROW]
[/TABLE]
Source: https://freestatistics.org/blog/index.php?pk=28223&T=0

Globally Unique Identifier (entire table): ba.freestatistics.org/blog/index.php?pk=28223&T=0

As an alternative you can also use a QR Code:  

The GUIDs for individual cells are displayed in the table below:

Summary of computational transaction
Raw Inputview raw input (R code)
Raw Outputview raw output of R engine
Computing time49 seconds
R Server'Gwilym Jenkins' @ 72.249.127.135


Standard Deviation-Mean Plot
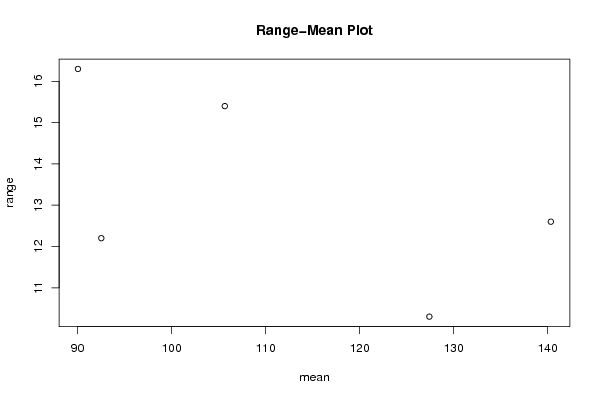
SectionMeanStandard DeviationRange
190.03333333333335.3324620500432616.3
292.51666666666674.5232396542408612.2
3105.6583333333335.0413667579217815.4
4127.4253.3715723334966410.3
5140.353.7004913678640612.6000000000000

\begin{tabular}{lllllllll}
\hline
Standard Deviation-Mean Plot \tabularnewline
Section & Mean & Standard Deviation & Range \tabularnewline
1 & 90.0333333333333 & 5.33246205004326 & 16.3 \tabularnewline
2 & 92.5166666666667 & 4.52323965424086 & 12.2 \tabularnewline
3 & 105.658333333333 & 5.04136675792178 & 15.4 \tabularnewline
4 & 127.425 & 3.37157233349664 & 10.3 \tabularnewline
5 & 140.35 & 3.70049136786406 & 12.6000000000000 \tabularnewline
\hline
\end{tabular}
%Source: https://freestatistics.org/blog/index.php?pk=28223&T=1

[TABLE]
[ROW][C]Standard Deviation-Mean Plot[/C][/ROW]
[ROW][C]Section[/C][C]Mean[/C][C]Standard Deviation[/C][C]Range[/C][/ROW]
[ROW][C]1[/C][C]90.0333333333333[/C][C]5.33246205004326[/C][C]16.3[/C][/ROW]
[ROW][C]2[/C][C]92.5166666666667[/C][C]4.52323965424086[/C][C]12.2[/C][/ROW]
[ROW][C]3[/C][C]105.658333333333[/C][C]5.04136675792178[/C][C]15.4[/C][/ROW]
[ROW][C]4[/C][C]127.425[/C][C]3.37157233349664[/C][C]10.3[/C][/ROW]
[ROW][C]5[/C][C]140.35[/C][C]3.70049136786406[/C][C]12.6000000000000[/C][/ROW]
[/TABLE]
Source: https://freestatistics.org/blog/index.php?pk=28223&T=1

Globally Unique Identifier (entire table): ba.freestatistics.org/blog/index.php?pk=28223&T=1

As an alternative you can also use a QR Code:  

The GUIDs for individual cells are displayed in the table below:

Standard Deviation-Mean Plot
SectionMeanStandard DeviationRange
190.03333333333335.3324620500432616.3
292.51666666666674.5232396542408612.2
3105.6583333333335.0413667579217815.4
4127.4253.3715723334966410.3
5140.353.7004913678640612.6000000000000


Regression: S.E.(k) = alpha + beta * Mean(k)
alpha7.98454916842947
beta-0.0322916400586002
S.D.0.0118607006774054
T-STAT-2.72257440238043
p-value0.0723920830232121

\begin{tabular}{lllllllll}
\hline
Regression: S.E.(k) = alpha + beta * Mean(k) \tabularnewline
alpha & 7.98454916842947 \tabularnewline
beta & -0.0322916400586002 \tabularnewline
S.D. & 0.0118607006774054 \tabularnewline
T-STAT & -2.72257440238043 \tabularnewline
p-value & 0.0723920830232121 \tabularnewline
\hline
\end{tabular}
%Source: https://freestatistics.org/blog/index.php?pk=28223&T=2

[TABLE]
[ROW][C]Regression: S.E.(k) = alpha + beta * Mean(k)[/C][/ROW]
[ROW][C]alpha[/C][C]7.98454916842947[/C][/ROW]
[ROW][C]beta[/C][C]-0.0322916400586002[/C][/ROW]
[ROW][C]S.D.[/C][C]0.0118607006774054[/C][/ROW]
[ROW][C]T-STAT[/C][C]-2.72257440238043[/C][/ROW]
[ROW][C]p-value[/C][C]0.0723920830232121[/C][/ROW]
[/TABLE]
Source: https://freestatistics.org/blog/index.php?pk=28223&T=2

Globally Unique Identifier (entire table): ba.freestatistics.org/blog/index.php?pk=28223&T=2

As an alternative you can also use a QR Code:  

The GUIDs for individual cells are displayed in the table below:

Regression: S.E.(k) = alpha + beta * Mean(k)
alpha7.98454916842947
beta-0.0322916400586002
S.D.0.0118607006774054
T-STAT-2.72257440238043
p-value0.0723920830232121


Regression: ln S.E.(k) = alpha + beta * ln Mean(k)
alpha5.48032860105484
beta-0.855091677631911
S.D.0.310423613892127
T-STAT-2.75459610469279
p-value0.0704703479377173
Lambda1.85509167763191

\begin{tabular}{lllllllll}
\hline
Regression: ln S.E.(k) = alpha + beta * ln Mean(k) \tabularnewline
alpha & 5.48032860105484 \tabularnewline
beta & -0.855091677631911 \tabularnewline
S.D. & 0.310423613892127 \tabularnewline
T-STAT & -2.75459610469279 \tabularnewline
p-value & 0.0704703479377173 \tabularnewline
Lambda & 1.85509167763191 \tabularnewline
\hline
\end{tabular}
%Source: https://freestatistics.org/blog/index.php?pk=28223&T=3

[TABLE]
[ROW][C]Regression: ln S.E.(k) = alpha + beta * ln Mean(k)[/C][/ROW]
[ROW][C]alpha[/C][C]5.48032860105484[/C][/ROW]
[ROW][C]beta[/C][C]-0.855091677631911[/C][/ROW]
[ROW][C]S.D.[/C][C]0.310423613892127[/C][/ROW]
[ROW][C]T-STAT[/C][C]-2.75459610469279[/C][/ROW]
[ROW][C]p-value[/C][C]0.0704703479377173[/C][/ROW]
[ROW][C]Lambda[/C][C]1.85509167763191[/C][/ROW]
[/TABLE]
Source: https://freestatistics.org/blog/index.php?pk=28223&T=3

Globally Unique Identifier (entire table): ba.freestatistics.org/blog/index.php?pk=28223&T=3

As an alternative you can also use a QR Code:  

The GUIDs for individual cells are displayed in the table below:

Regression: ln S.E.(k) = alpha + beta * ln Mean(k)
alpha5.48032860105484
beta-0.855091677631911
S.D.0.310423613892127
T-STAT-2.75459610469279
p-value0.0704703479377173
Lambda1.85509167763191


Parameters (Session):
par1 = 12 ;
Parameters (R input):
par1 = 12 ;
R code (references can be found in the software module):
par1 <- as.numeric(par1)
(n <- length(x))
(np <- floor(n / par1))
arr <- array(NA,dim=c(par1,np))
j <- 0
k <- 1
for (i in 1:(np*par1))
{
j = j + 1
arr[j,k] <- x[i]
if (j == par1) {
j = 0
k=k+1
}
}
arr
arr.mean <- array(NA,dim=np)
arr.sd <- array(NA,dim=np)
arr.range <- array(NA,dim=np)
for (j in 1:np)
{
arr.mean[j] <- mean(arr[,j],na.rm=TRUE)
arr.sd[j] <- sd(arr[,j],na.rm=TRUE)
arr.range[j] <- max(arr[,j],na.rm=TRUE) - min(arr[,j],na.rm=TRUE)
}
arr.mean
arr.sd
arr.range
(lm1 <- lm(arr.sd~arr.mean))
(lnlm1 <- lm(log(arr.sd)~log(arr.mean)))
(lm2 <- lm(arr.range~arr.mean))
bitmap(file='test1.png')
plot(arr.mean,arr.sd,main='Standard Deviation-Mean Plot',xlab='mean',ylab='standard deviation')
dev.off()
bitmap(file='test2.png')
plot(arr.mean,arr.range,main='Range-Mean Plot',xlab='mean',ylab='range')
dev.off()
load(file='createtable')
a<-table.start()
a<-table.row.start(a)
a<-table.element(a,'Standard Deviation-Mean Plot',4,TRUE)
a<-table.row.end(a)
a<-table.row.start(a)
a<-table.element(a,'Section',header=TRUE)
a<-table.element(a,'Mean',header=TRUE)
a<-table.element(a,'Standard Deviation',header=TRUE)
a<-table.element(a,'Range',header=TRUE)
a<-table.row.end(a)
for (j in 1:np) {
a<-table.row.start(a)
a<-table.element(a,j,header=TRUE)
a<-table.element(a,arr.mean[j])
a<-table.element(a,arr.sd[j] )
a<-table.element(a,arr.range[j] )
a<-table.row.end(a)
}
a<-table.end(a)
table.save(a,file='mytable.tab')
a<-table.start()
a<-table.row.start(a)
a<-table.element(a,'Regression: S.E.(k) = alpha + beta * Mean(k)',2,TRUE)
a<-table.row.end(a)
a<-table.row.start(a)
a<-table.element(a,'alpha',header=TRUE)
a<-table.element(a,lm1$coefficients[[1]])
a<-table.row.end(a)
a<-table.row.start(a)
a<-table.element(a,'beta',header=TRUE)
a<-table.element(a,lm1$coefficients[[2]])
a<-table.row.end(a)
a<-table.row.start(a)
a<-table.element(a,'S.D.',header=TRUE)
a<-table.element(a,summary(lm1)$coefficients[2,2])
a<-table.row.end(a)
a<-table.row.start(a)
a<-table.element(a,'T-STAT',header=TRUE)
a<-table.element(a,summary(lm1)$coefficients[2,3])
a<-table.row.end(a)
a<-table.row.start(a)
a<-table.element(a,'p-value',header=TRUE)
a<-table.element(a,summary(lm1)$coefficients[2,4])
a<-table.row.end(a)
a<-table.end(a)
table.save(a,file='mytable1.tab')
a<-table.start()
a<-table.row.start(a)
a<-table.element(a,'Regression: ln S.E.(k) = alpha + beta * ln Mean(k)',2,TRUE)
a<-table.row.end(a)
a<-table.row.start(a)
a<-table.element(a,'alpha',header=TRUE)
a<-table.element(a,lnlm1$coefficients[[1]])
a<-table.row.end(a)
a<-table.row.start(a)
a<-table.element(a,'beta',header=TRUE)
a<-table.element(a,lnlm1$coefficients[[2]])
a<-table.row.end(a)
a<-table.row.start(a)
a<-table.element(a,'S.D.',header=TRUE)
a<-table.element(a,summary(lnlm1)$coefficients[2,2])
a<-table.row.end(a)
a<-table.row.start(a)
a<-table.element(a,'T-STAT',header=TRUE)
a<-table.element(a,summary(lnlm1)$coefficients[2,3])
a<-table.row.end(a)
a<-table.row.start(a)
a<-table.element(a,'p-value',header=TRUE)
a<-table.element(a,summary(lnlm1)$coefficients[2,4])
a<-table.row.end(a)
a<-table.row.start(a)
a<-table.element(a,'Lambda',header=TRUE)
a<-table.element(a,1-lnlm1$coefficients[[2]])
a<-table.row.end(a)
a<-table.end(a)
table.save(a,file='mytable2.tab')