Free Statistics

of Irreproducible Research!

Author's title

Author*Unverified author*
R Software Modulerwasp_autocorrelation.wasp
Title produced by software(Partial) Autocorrelation Function
Date of computationTue, 02 Dec 2008 11:04:45 -0700
Cite this page as followsStatistical Computations at FreeStatistics.org, Office for Research Development and Education, URL https://freestatistics.org/blog/index.php?v=date/2008/Dec/02/t1228241190tpy12fe6gtkfkyd.htm/, Retrieved Sun, 19 May 2024 08:54:06 +0000
Statistical Computations at FreeStatistics.org, Office for Research Development and Education, URL https://freestatistics.org/blog/index.php?pk=28173, Retrieved Sun, 19 May 2024 08:54:06 +0000
QR Codes:

Original text written by user:
IsPrivate?No (this computation is public)
User-defined keywordsSeverijns Britt
Estimated Impact198
Family? (F = Feedback message, R = changed R code, M = changed R Module, P = changed Parameters, D = changed Data)
F     [Univariate Data Series] [Airline data] [2007-10-18 09:58:47] [42daae401fd3def69a25014f2252b4c2]
F RMPD  [(Partial) Autocorrelation Function] [non stationary ti...] [2008-12-02 17:57:26] [9ea94c8297ec7e569f27218c1d8ea30f]
-    D    [(Partial) Autocorrelation Function] [non stationary ti...] [2008-12-02 18:02:47] [9ea94c8297ec7e569f27218c1d8ea30f]
F             [(Partial) Autocorrelation Function] [non stationary ti...] [2008-12-02 18:04:45] [7bf28d4d60530086dbc44ae6b648927e] [Current]
Feedback Forum
2008-12-08 18:04:18 [Jessica Alves Pires] [reply
Men ziet dat de differentiatie inderdaad een gunstig effect heeft, maar ik zou toch eerst de VRM hebben berekend om zeker te zijn van welke waarden ik best voor d en D gebruik.

Post a new message
Dataseries X:
98.1
101.1
111.1
93.3
100
108
70.4
75.4
105.5
112.3
102.5
93.5
86.7
95.2
103.8
97
95.5
101
67.5
64
106.7
100.6
101.2
93.1
84.2
85.8
91.8
92.4
80.3
79.7
62.5
57.1
100.8
100.7
86.2
83.2
71.7
77.5
89.8
80.3
78.7
93.8
57.6
60.6
91
85.3
77.4
77.3
68.3
69.9
81.7
75.1
69.9
84
54.3
60
89.9
77
85.3
77.6
69.2
75.5
85.7
72.2
79.9
85.3
52.2
61.2
82.4
85.4
78.2
70.2
70.2
69.3
77.5
66.1
69
79.2
56.2
63.3
77.8
92
78.1
65.1
71.1
70.9
72
81.9
70.6
72.5
65.1
54.9


Summary of computational transaction
Raw Inputview raw input (R code)
Raw Outputview raw output of R engine
Computing time3 seconds
R Server'Herman Ole Andreas Wold' @ 193.190.124.10:1001

\begin{tabular}{lllllllll}
\hline
Summary of computational transaction \tabularnewline
Raw Input & view raw input (R code)  \tabularnewline
Raw Output & view raw output of R engine  \tabularnewline
Computing time & 3 seconds \tabularnewline
R Server & 'Herman Ole Andreas Wold' @ 193.190.124.10:1001 \tabularnewline
\hline
\end{tabular}
%Source: https://freestatistics.org/blog/index.php?pk=28173&T=0

[TABLE]
[ROW][C]Summary of computational transaction[/C][/ROW]
[ROW][C]Raw Input[/C][C]view raw input (R code) [/C][/ROW]
[ROW][C]Raw Output[/C][C]view raw output of R engine [/C][/ROW]
[ROW][C]Computing time[/C][C]3 seconds[/C][/ROW]
[ROW][C]R Server[/C][C]'Herman Ole Andreas Wold' @ 193.190.124.10:1001[/C][/ROW]
[/TABLE]
Source: https://freestatistics.org/blog/index.php?pk=28173&T=0

Globally Unique Identifier (entire table): ba.freestatistics.org/blog/index.php?pk=28173&T=0

As an alternative you can also use a QR Code:  

The GUIDs for individual cells are displayed in the table below:

Summary of computational transaction
Raw Inputview raw input (R code)
Raw Outputview raw output of R engine
Computing time3 seconds
R Server'Herman Ole Andreas Wold' @ 193.190.124.10:1001


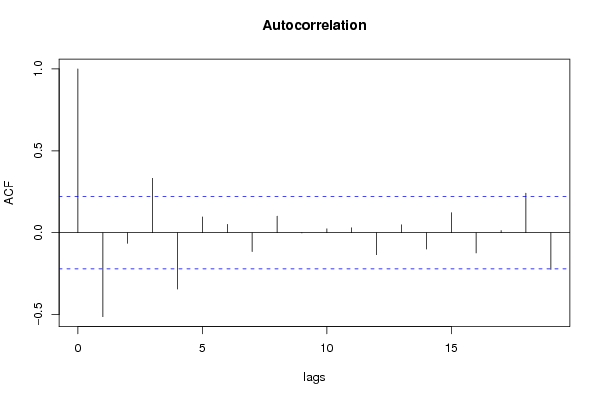
Autocorrelation Function
Time lag kACF(k)T-STATP-value
1-0.512874-4.55859e-06
2-0.064876-0.57660.282914
30.3318052.94910.002095
4-0.344348-3.06060.001509
50.095810.85160.198512
60.050750.45110.326587
7-0.115708-1.02840.153441
80.1004650.8930.187297
9-0.001784-0.01590.493694
100.0233520.20760.418054
110.0294060.26140.397245
12-0.134192-1.19270.118274
130.0484220.43040.334046
14-0.099814-0.88720.188842
150.1222881.08690.140189
16-0.123662-1.09910.137524
170.0130870.11630.453847
180.2411252.14320.017588
19-0.224434-1.99480.024756

\begin{tabular}{lllllllll}
\hline
Autocorrelation Function \tabularnewline
Time lag k & ACF(k) & T-STAT & P-value \tabularnewline
1 & -0.512874 & -4.5585 & 9e-06 \tabularnewline
2 & -0.064876 & -0.5766 & 0.282914 \tabularnewline
3 & 0.331805 & 2.9491 & 0.002095 \tabularnewline
4 & -0.344348 & -3.0606 & 0.001509 \tabularnewline
5 & 0.09581 & 0.8516 & 0.198512 \tabularnewline
6 & 0.05075 & 0.4511 & 0.326587 \tabularnewline
7 & -0.115708 & -1.0284 & 0.153441 \tabularnewline
8 & 0.100465 & 0.893 & 0.187297 \tabularnewline
9 & -0.001784 & -0.0159 & 0.493694 \tabularnewline
10 & 0.023352 & 0.2076 & 0.418054 \tabularnewline
11 & 0.029406 & 0.2614 & 0.397245 \tabularnewline
12 & -0.134192 & -1.1927 & 0.118274 \tabularnewline
13 & 0.048422 & 0.4304 & 0.334046 \tabularnewline
14 & -0.099814 & -0.8872 & 0.188842 \tabularnewline
15 & 0.122288 & 1.0869 & 0.140189 \tabularnewline
16 & -0.123662 & -1.0991 & 0.137524 \tabularnewline
17 & 0.013087 & 0.1163 & 0.453847 \tabularnewline
18 & 0.241125 & 2.1432 & 0.017588 \tabularnewline
19 & -0.224434 & -1.9948 & 0.024756 \tabularnewline
\hline
\end{tabular}
%Source: https://freestatistics.org/blog/index.php?pk=28173&T=1

[TABLE]
[ROW][C]Autocorrelation Function[/C][/ROW]
[ROW][C]Time lag k[/C][C]ACF(k)[/C][C]T-STAT[/C][C]P-value[/C][/ROW]
[ROW][C]1[/C][C]-0.512874[/C][C]-4.5585[/C][C]9e-06[/C][/ROW]
[ROW][C]2[/C][C]-0.064876[/C][C]-0.5766[/C][C]0.282914[/C][/ROW]
[ROW][C]3[/C][C]0.331805[/C][C]2.9491[/C][C]0.002095[/C][/ROW]
[ROW][C]4[/C][C]-0.344348[/C][C]-3.0606[/C][C]0.001509[/C][/ROW]
[ROW][C]5[/C][C]0.09581[/C][C]0.8516[/C][C]0.198512[/C][/ROW]
[ROW][C]6[/C][C]0.05075[/C][C]0.4511[/C][C]0.326587[/C][/ROW]
[ROW][C]7[/C][C]-0.115708[/C][C]-1.0284[/C][C]0.153441[/C][/ROW]
[ROW][C]8[/C][C]0.100465[/C][C]0.893[/C][C]0.187297[/C][/ROW]
[ROW][C]9[/C][C]-0.001784[/C][C]-0.0159[/C][C]0.493694[/C][/ROW]
[ROW][C]10[/C][C]0.023352[/C][C]0.2076[/C][C]0.418054[/C][/ROW]
[ROW][C]11[/C][C]0.029406[/C][C]0.2614[/C][C]0.397245[/C][/ROW]
[ROW][C]12[/C][C]-0.134192[/C][C]-1.1927[/C][C]0.118274[/C][/ROW]
[ROW][C]13[/C][C]0.048422[/C][C]0.4304[/C][C]0.334046[/C][/ROW]
[ROW][C]14[/C][C]-0.099814[/C][C]-0.8872[/C][C]0.188842[/C][/ROW]
[ROW][C]15[/C][C]0.122288[/C][C]1.0869[/C][C]0.140189[/C][/ROW]
[ROW][C]16[/C][C]-0.123662[/C][C]-1.0991[/C][C]0.137524[/C][/ROW]
[ROW][C]17[/C][C]0.013087[/C][C]0.1163[/C][C]0.453847[/C][/ROW]
[ROW][C]18[/C][C]0.241125[/C][C]2.1432[/C][C]0.017588[/C][/ROW]
[ROW][C]19[/C][C]-0.224434[/C][C]-1.9948[/C][C]0.024756[/C][/ROW]
[/TABLE]
Source: https://freestatistics.org/blog/index.php?pk=28173&T=1

Globally Unique Identifier (entire table): ba.freestatistics.org/blog/index.php?pk=28173&T=1

As an alternative you can also use a QR Code:  

The GUIDs for individual cells are displayed in the table below:

Autocorrelation Function
Time lag kACF(k)T-STATP-value
1-0.512874-4.55859e-06
2-0.064876-0.57660.282914
30.3318052.94910.002095
4-0.344348-3.06060.001509
50.095810.85160.198512
60.050750.45110.326587
7-0.115708-1.02840.153441
80.1004650.8930.187297
9-0.001784-0.01590.493694
100.0233520.20760.418054
110.0294060.26140.397245
12-0.134192-1.19270.118274
130.0484220.43040.334046
14-0.099814-0.88720.188842
150.1222881.08690.140189
16-0.123662-1.09910.137524
170.0130870.11630.453847
180.2411252.14320.017588
19-0.224434-1.99480.024756


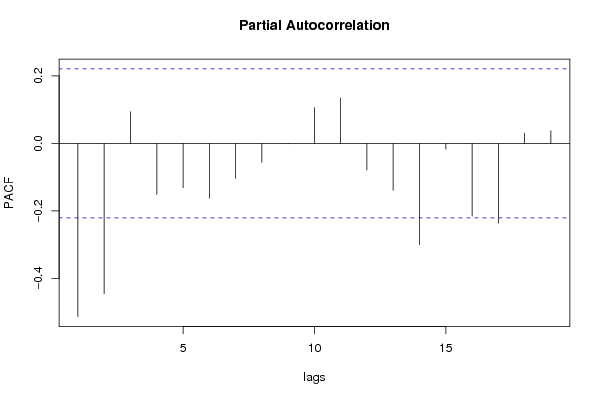
Partial Autocorrelation Function
Time lag kPACF(k)T-STATP-value
1-0.512874-4.55859e-06
2-0.444957-3.95498.3e-05
30.0939340.83490.203144
4-0.151059-1.34260.091616
5-0.130977-1.16410.123935
6-0.16201-1.440.076912
7-0.103488-0.91980.180234
8-0.055992-0.49770.310049
9-0.00099-0.00880.4965
100.1060340.94250.174417
110.1347741.19790.117269
12-0.0789-0.70130.242595
13-0.138816-1.23380.110463
14-0.299903-2.66560.004658
15-0.016921-0.15040.440418
16-0.215012-1.91110.029811
17-0.235641-2.09440.019714
180.0306750.27260.392918
190.0378880.33680.368597

\begin{tabular}{lllllllll}
\hline
Partial Autocorrelation Function \tabularnewline
Time lag k & PACF(k) & T-STAT & P-value \tabularnewline
1 & -0.512874 & -4.5585 & 9e-06 \tabularnewline
2 & -0.444957 & -3.9549 & 8.3e-05 \tabularnewline
3 & 0.093934 & 0.8349 & 0.203144 \tabularnewline
4 & -0.151059 & -1.3426 & 0.091616 \tabularnewline
5 & -0.130977 & -1.1641 & 0.123935 \tabularnewline
6 & -0.16201 & -1.44 & 0.076912 \tabularnewline
7 & -0.103488 & -0.9198 & 0.180234 \tabularnewline
8 & -0.055992 & -0.4977 & 0.310049 \tabularnewline
9 & -0.00099 & -0.0088 & 0.4965 \tabularnewline
10 & 0.106034 & 0.9425 & 0.174417 \tabularnewline
11 & 0.134774 & 1.1979 & 0.117269 \tabularnewline
12 & -0.0789 & -0.7013 & 0.242595 \tabularnewline
13 & -0.138816 & -1.2338 & 0.110463 \tabularnewline
14 & -0.299903 & -2.6656 & 0.004658 \tabularnewline
15 & -0.016921 & -0.1504 & 0.440418 \tabularnewline
16 & -0.215012 & -1.9111 & 0.029811 \tabularnewline
17 & -0.235641 & -2.0944 & 0.019714 \tabularnewline
18 & 0.030675 & 0.2726 & 0.392918 \tabularnewline
19 & 0.037888 & 0.3368 & 0.368597 \tabularnewline
\hline
\end{tabular}
%Source: https://freestatistics.org/blog/index.php?pk=28173&T=2

[TABLE]
[ROW][C]Partial Autocorrelation Function[/C][/ROW]
[ROW][C]Time lag k[/C][C]PACF(k)[/C][C]T-STAT[/C][C]P-value[/C][/ROW]
[ROW][C]1[/C][C]-0.512874[/C][C]-4.5585[/C][C]9e-06[/C][/ROW]
[ROW][C]2[/C][C]-0.444957[/C][C]-3.9549[/C][C]8.3e-05[/C][/ROW]
[ROW][C]3[/C][C]0.093934[/C][C]0.8349[/C][C]0.203144[/C][/ROW]
[ROW][C]4[/C][C]-0.151059[/C][C]-1.3426[/C][C]0.091616[/C][/ROW]
[ROW][C]5[/C][C]-0.130977[/C][C]-1.1641[/C][C]0.123935[/C][/ROW]
[ROW][C]6[/C][C]-0.16201[/C][C]-1.44[/C][C]0.076912[/C][/ROW]
[ROW][C]7[/C][C]-0.103488[/C][C]-0.9198[/C][C]0.180234[/C][/ROW]
[ROW][C]8[/C][C]-0.055992[/C][C]-0.4977[/C][C]0.310049[/C][/ROW]
[ROW][C]9[/C][C]-0.00099[/C][C]-0.0088[/C][C]0.4965[/C][/ROW]
[ROW][C]10[/C][C]0.106034[/C][C]0.9425[/C][C]0.174417[/C][/ROW]
[ROW][C]11[/C][C]0.134774[/C][C]1.1979[/C][C]0.117269[/C][/ROW]
[ROW][C]12[/C][C]-0.0789[/C][C]-0.7013[/C][C]0.242595[/C][/ROW]
[ROW][C]13[/C][C]-0.138816[/C][C]-1.2338[/C][C]0.110463[/C][/ROW]
[ROW][C]14[/C][C]-0.299903[/C][C]-2.6656[/C][C]0.004658[/C][/ROW]
[ROW][C]15[/C][C]-0.016921[/C][C]-0.1504[/C][C]0.440418[/C][/ROW]
[ROW][C]16[/C][C]-0.215012[/C][C]-1.9111[/C][C]0.029811[/C][/ROW]
[ROW][C]17[/C][C]-0.235641[/C][C]-2.0944[/C][C]0.019714[/C][/ROW]
[ROW][C]18[/C][C]0.030675[/C][C]0.2726[/C][C]0.392918[/C][/ROW]
[ROW][C]19[/C][C]0.037888[/C][C]0.3368[/C][C]0.368597[/C][/ROW]
[/TABLE]
Source: https://freestatistics.org/blog/index.php?pk=28173&T=2

Globally Unique Identifier (entire table): ba.freestatistics.org/blog/index.php?pk=28173&T=2

As an alternative you can also use a QR Code:  

The GUIDs for individual cells are displayed in the table below:

Partial Autocorrelation Function
Time lag kPACF(k)T-STATP-value
1-0.512874-4.55859e-06
2-0.444957-3.95498.3e-05
30.0939340.83490.203144
4-0.151059-1.34260.091616
5-0.130977-1.16410.123935
6-0.16201-1.440.076912
7-0.103488-0.91980.180234
8-0.055992-0.49770.310049
9-0.00099-0.00880.4965
100.1060340.94250.174417
110.1347741.19790.117269
12-0.0789-0.70130.242595
13-0.138816-1.23380.110463
14-0.299903-2.66560.004658
15-0.016921-0.15040.440418
16-0.215012-1.91110.029811
17-0.235641-2.09440.019714
180.0306750.27260.392918
190.0378880.33680.368597


Parameters (Session):
par1 = Default ; par2 = 1 ; par3 = 0 ; par4 = 0 ; par5 = 12 ;
Parameters (R input):
par1 = Default ; par2 = 1 ; par3 = 1 ; par4 = 1 ; par5 = 12 ;
R code (references can be found in the software module):
if (par1 == 'Default') {
par1 = 10*log10(length(x))
} else {
par1 <- as.numeric(par1)
}
par2 <- as.numeric(par2)
par3 <- as.numeric(par3)
par4 <- as.numeric(par4)
par5 <- as.numeric(par5)
if (par2 == 0) {
x <- log(x)
} else {
x <- (x ^ par2 - 1) / par2
}
if (par3 > 0) x <- diff(x,lag=1,difference=par3)
if (par4 > 0) x <- diff(x,lag=par5,difference=par4)
bitmap(file='pic1.png')
racf <- acf(x,par1,main='Autocorrelation',xlab='lags',ylab='ACF')
dev.off()
bitmap(file='pic2.png')
rpacf <- pacf(x,par1,main='Partial Autocorrelation',xlab='lags',ylab='PACF')
dev.off()
(myacf <- c(racf$acf))
(mypacf <- c(rpacf$acf))
lengthx <- length(x)
sqrtn <- sqrt(lengthx)
load(file='createtable')
a<-table.start()
a<-table.row.start(a)
a<-table.element(a,'Autocorrelation Function',4,TRUE)
a<-table.row.end(a)
a<-table.row.start(a)
a<-table.element(a,'Time lag k',header=TRUE)
a<-table.element(a,hyperlink('basics.htm','ACF(k)','click here for more information about the Autocorrelation Function'),header=TRUE)
a<-table.element(a,'T-STAT',header=TRUE)
a<-table.element(a,'P-value',header=TRUE)
a<-table.row.end(a)
for (i in 2:(par1+1)) {
a<-table.row.start(a)
a<-table.element(a,i-1,header=TRUE)
a<-table.element(a,round(myacf[i],6))
mytstat <- myacf[i]*sqrtn
a<-table.element(a,round(mytstat,4))
a<-table.element(a,round(1-pt(abs(mytstat),lengthx),6))
a<-table.row.end(a)
}
a<-table.end(a)
table.save(a,file='mytable.tab')
a<-table.start()
a<-table.row.start(a)
a<-table.element(a,'Partial Autocorrelation Function',4,TRUE)
a<-table.row.end(a)
a<-table.row.start(a)
a<-table.element(a,'Time lag k',header=TRUE)
a<-table.element(a,hyperlink('basics.htm','PACF(k)','click here for more information about the Partial Autocorrelation Function'),header=TRUE)
a<-table.element(a,'T-STAT',header=TRUE)
a<-table.element(a,'P-value',header=TRUE)
a<-table.row.end(a)
for (i in 1:par1) {
a<-table.row.start(a)
a<-table.element(a,i,header=TRUE)
a<-table.element(a,round(mypacf[i],6))
mytstat <- mypacf[i]*sqrtn
a<-table.element(a,round(mytstat,4))
a<-table.element(a,round(1-pt(abs(mytstat),lengthx),6))
a<-table.row.end(a)
}
a<-table.end(a)
table.save(a,file='mytable1.tab')