Free Statistics

of Irreproducible Research!

Author's title

Author*The author of this computation has been verified*
R Software Modulerwasp_autocorrelation.wasp
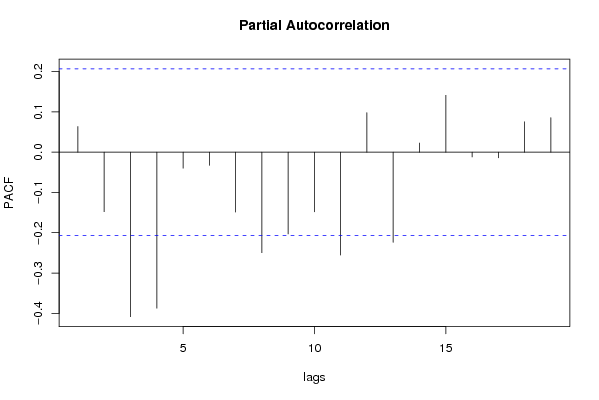
Title produced by software(Partial) Autocorrelation Function
Date of computationTue, 02 Dec 2008 09:43:00 -0700
Cite this page as followsStatistical Computations at FreeStatistics.org, Office for Research Development and Education, URL https://freestatistics.org/blog/index.php?v=date/2008/Dec/02/t1228236250noi4n0dkpheu3yu.htm/, Retrieved Sun, 19 May 2024 09:25:46 +0000
Statistical Computations at FreeStatistics.org, Office for Research Development and Education, URL https://freestatistics.org/blog/index.php?pk=28062, Retrieved Sun, 19 May 2024 09:25:46 +0000
QR Codes:

Original text written by user:
IsPrivate?No (this computation is public)
User-defined keywordshundrasmet
Estimated Impact214
Family? (F = Feedback message, R = changed R code, M = changed R Module, P = changed Parameters, D = changed Data)
F     [Law of Averages] [Random Walk Simul...] [2008-11-25 17:50:19] [b98453cac15ba1066b407e146608df68]
F RMPD    [(Partial) Autocorrelation Function] [workshop 4 Q2] [2008-12-02 16:43:00] [fb0a4305582623ea5408efbbf6f8b708] [Current]
Feedback Forum
2008-12-08 12:29:18 [Jessica Alves Pires] [reply
Je uitleg klopt maar je berekening klopt niet. Hoe ben je tot je conclusie gekomen als je niet eens een ACF-grafiek hebt waaruit je het kan afleiden?
  2008-12-08 12:30:29 [Jessica Alves Pires] [reply
Hier is mijn oplossing:
http://www.freestatistics.org/blog/index.php?v=date/2008/Dec/01/t1228138561609shlu2lpdfnh8.htm

de tweede grafiek is de grafiek dat je had moet hebben.
    2008-12-08 12:31:05 [Jessica Alves Pires] [reply
correctie typfout: 'moeten' ipv 'moet'
2008-12-08 15:12:54 [Jessica Alves Pires] [reply
Twee taken die ik dien te verbeteren, hebben allebei dezelfde links en antwoorden. Aangezien de link en uitleg dezelfden zijn, verwijs ik naar bovenstaande opmerking.

Post a new message
Dataseries X:
5.5
5.3
5.2
5.3
5.3
5
4.8
4.9
5.3
6
6.2
6.4
6.4
6.4
6.2
6.1
6
5.9
6.2
6.2
6.4
6.8
6.9
7
7
6.9
6.7
6.6
6.5
6.4
6.5
6.5
6.6
6.7
6.8
7.2
7.6
7.6
7.3
6.4
6.1
6.3
7.1
7.5
7.4
7.1
6.8
6.9
7.2
7.4
7.3
6.9
6.9
6.8
7.1
7.2
7.1
7
6.9
7
7.4
7.5
7.5
7.4
7.3
7
6.7
6.5
6.5
6.5
6.6
6.8
6.9
6.9
6.8
6.8
6.5
6.1
6
5.9
5.8
5.9
5.9
6.2
6.3
6.2
6
5.8
5.5
5.5
5.7
5.8


Summary of computational transaction
Raw Inputview raw input (R code)
Raw Outputview raw output of R engine
Computing time1 seconds
R Server'George Udny Yule' @ 72.249.76.132

\begin{tabular}{lllllllll}
\hline
Summary of computational transaction \tabularnewline
Raw Input & view raw input (R code)  \tabularnewline
Raw Output & view raw output of R engine  \tabularnewline
Computing time & 1 seconds \tabularnewline
R Server & 'George Udny Yule' @ 72.249.76.132 \tabularnewline
\hline
\end{tabular}
%Source: https://freestatistics.org/blog/index.php?pk=28062&T=0

[TABLE]
[ROW][C]Summary of computational transaction[/C][/ROW]
[ROW][C]Raw Input[/C][C]view raw input (R code) [/C][/ROW]
[ROW][C]Raw Output[/C][C]view raw output of R engine [/C][/ROW]
[ROW][C]Computing time[/C][C]1 seconds[/C][/ROW]
[ROW][C]R Server[/C][C]'George Udny Yule' @ 72.249.76.132[/C][/ROW]
[/TABLE]
Source: https://freestatistics.org/blog/index.php?pk=28062&T=0

Globally Unique Identifier (entire table): ba.freestatistics.org/blog/index.php?pk=28062&T=0

As an alternative you can also use a QR Code:  

The GUIDs for individual cells are displayed in the table below:

Summary of computational transaction
Raw Inputview raw input (R code)
Raw Outputview raw output of R engine
Computing time1 seconds
R Server'George Udny Yule' @ 72.249.76.132


Autocorrelation Function
Time lag kACF(k)T-STATP-value
10.0636470.60380.273746
2-0.143101-1.35760.088996
3-0.417689-3.96257.4e-05
4-0.328957-3.12080.001212
50.121871.15620.125338
60.2419422.29530.012021
70.1452741.37820.08578
8-0.11777-1.11730.133427
9-0.206894-1.96280.026381
10-0.075407-0.71540.238116
110.0445370.42250.336829
120.3714843.52420.000335
13-0.021373-0.20280.419889
140.0233790.22180.41249
15-0.104372-0.99020.162375
16-0.183887-1.74450.042243
170.007960.07550.469987
180.0386540.36670.357352
190.0716040.67930.249346

\begin{tabular}{lllllllll}
\hline
Autocorrelation Function \tabularnewline
Time lag k & ACF(k) & T-STAT & P-value \tabularnewline
1 & 0.063647 & 0.6038 & 0.273746 \tabularnewline
2 & -0.143101 & -1.3576 & 0.088996 \tabularnewline
3 & -0.417689 & -3.9625 & 7.4e-05 \tabularnewline
4 & -0.328957 & -3.1208 & 0.001212 \tabularnewline
5 & 0.12187 & 1.1562 & 0.125338 \tabularnewline
6 & 0.241942 & 2.2953 & 0.012021 \tabularnewline
7 & 0.145274 & 1.3782 & 0.08578 \tabularnewline
8 & -0.11777 & -1.1173 & 0.133427 \tabularnewline
9 & -0.206894 & -1.9628 & 0.026381 \tabularnewline
10 & -0.075407 & -0.7154 & 0.238116 \tabularnewline
11 & 0.044537 & 0.4225 & 0.336829 \tabularnewline
12 & 0.371484 & 3.5242 & 0.000335 \tabularnewline
13 & -0.021373 & -0.2028 & 0.419889 \tabularnewline
14 & 0.023379 & 0.2218 & 0.41249 \tabularnewline
15 & -0.104372 & -0.9902 & 0.162375 \tabularnewline
16 & -0.183887 & -1.7445 & 0.042243 \tabularnewline
17 & 0.00796 & 0.0755 & 0.469987 \tabularnewline
18 & 0.038654 & 0.3667 & 0.357352 \tabularnewline
19 & 0.071604 & 0.6793 & 0.249346 \tabularnewline
\hline
\end{tabular}
%Source: https://freestatistics.org/blog/index.php?pk=28062&T=1

[TABLE]
[ROW][C]Autocorrelation Function[/C][/ROW]
[ROW][C]Time lag k[/C][C]ACF(k)[/C][C]T-STAT[/C][C]P-value[/C][/ROW]
[ROW][C]1[/C][C]0.063647[/C][C]0.6038[/C][C]0.273746[/C][/ROW]
[ROW][C]2[/C][C]-0.143101[/C][C]-1.3576[/C][C]0.088996[/C][/ROW]
[ROW][C]3[/C][C]-0.417689[/C][C]-3.9625[/C][C]7.4e-05[/C][/ROW]
[ROW][C]4[/C][C]-0.328957[/C][C]-3.1208[/C][C]0.001212[/C][/ROW]
[ROW][C]5[/C][C]0.12187[/C][C]1.1562[/C][C]0.125338[/C][/ROW]
[ROW][C]6[/C][C]0.241942[/C][C]2.2953[/C][C]0.012021[/C][/ROW]
[ROW][C]7[/C][C]0.145274[/C][C]1.3782[/C][C]0.08578[/C][/ROW]
[ROW][C]8[/C][C]-0.11777[/C][C]-1.1173[/C][C]0.133427[/C][/ROW]
[ROW][C]9[/C][C]-0.206894[/C][C]-1.9628[/C][C]0.026381[/C][/ROW]
[ROW][C]10[/C][C]-0.075407[/C][C]-0.7154[/C][C]0.238116[/C][/ROW]
[ROW][C]11[/C][C]0.044537[/C][C]0.4225[/C][C]0.336829[/C][/ROW]
[ROW][C]12[/C][C]0.371484[/C][C]3.5242[/C][C]0.000335[/C][/ROW]
[ROW][C]13[/C][C]-0.021373[/C][C]-0.2028[/C][C]0.419889[/C][/ROW]
[ROW][C]14[/C][C]0.023379[/C][C]0.2218[/C][C]0.41249[/C][/ROW]
[ROW][C]15[/C][C]-0.104372[/C][C]-0.9902[/C][C]0.162375[/C][/ROW]
[ROW][C]16[/C][C]-0.183887[/C][C]-1.7445[/C][C]0.042243[/C][/ROW]
[ROW][C]17[/C][C]0.00796[/C][C]0.0755[/C][C]0.469987[/C][/ROW]
[ROW][C]18[/C][C]0.038654[/C][C]0.3667[/C][C]0.357352[/C][/ROW]
[ROW][C]19[/C][C]0.071604[/C][C]0.6793[/C][C]0.249346[/C][/ROW]
[/TABLE]
Source: https://freestatistics.org/blog/index.php?pk=28062&T=1

Globally Unique Identifier (entire table): ba.freestatistics.org/blog/index.php?pk=28062&T=1

As an alternative you can also use a QR Code:  

The GUIDs for individual cells are displayed in the table below:

Autocorrelation Function
Time lag kACF(k)T-STATP-value
10.0636470.60380.273746
2-0.143101-1.35760.088996
3-0.417689-3.96257.4e-05
4-0.328957-3.12080.001212
50.121871.15620.125338
60.2419422.29530.012021
70.1452741.37820.08578
8-0.11777-1.11730.133427
9-0.206894-1.96280.026381
10-0.075407-0.71540.238116
110.0445370.42250.336829
120.3714843.52420.000335
13-0.021373-0.20280.419889
140.0233790.22180.41249
15-0.104372-0.99020.162375
16-0.183887-1.74450.042243
170.007960.07550.469987
180.0386540.36670.357352
190.0716040.67930.249346


Partial Autocorrelation Function
Time lag kPACF(k)T-STATP-value
10.0636470.60380.273746
2-0.14775-1.40170.082225
3-0.408364-3.87410.000101
4-0.387472-3.67590.000201
5-0.039728-0.37690.353569
6-0.032686-0.31010.378607
7-0.148752-1.41120.080819
8-0.249551-2.36750.010027
9-0.202956-1.92540.028668
10-0.148054-1.40460.081796
11-0.255348-2.42240.00871
120.0979540.92930.177617
13-0.223946-2.12450.018183
140.0226360.21470.415226
150.1412711.34020.091774
16-0.011869-0.11260.4553
17-0.014134-0.13410.446817
180.075430.71560.238048
190.085460.81070.209824

\begin{tabular}{lllllllll}
\hline
Partial Autocorrelation Function \tabularnewline
Time lag k & PACF(k) & T-STAT & P-value \tabularnewline
1 & 0.063647 & 0.6038 & 0.273746 \tabularnewline
2 & -0.14775 & -1.4017 & 0.082225 \tabularnewline
3 & -0.408364 & -3.8741 & 0.000101 \tabularnewline
4 & -0.387472 & -3.6759 & 0.000201 \tabularnewline
5 & -0.039728 & -0.3769 & 0.353569 \tabularnewline
6 & -0.032686 & -0.3101 & 0.378607 \tabularnewline
7 & -0.148752 & -1.4112 & 0.080819 \tabularnewline
8 & -0.249551 & -2.3675 & 0.010027 \tabularnewline
9 & -0.202956 & -1.9254 & 0.028668 \tabularnewline
10 & -0.148054 & -1.4046 & 0.081796 \tabularnewline
11 & -0.255348 & -2.4224 & 0.00871 \tabularnewline
12 & 0.097954 & 0.9293 & 0.177617 \tabularnewline
13 & -0.223946 & -2.1245 & 0.018183 \tabularnewline
14 & 0.022636 & 0.2147 & 0.415226 \tabularnewline
15 & 0.141271 & 1.3402 & 0.091774 \tabularnewline
16 & -0.011869 & -0.1126 & 0.4553 \tabularnewline
17 & -0.014134 & -0.1341 & 0.446817 \tabularnewline
18 & 0.07543 & 0.7156 & 0.238048 \tabularnewline
19 & 0.08546 & 0.8107 & 0.209824 \tabularnewline
\hline
\end{tabular}
%Source: https://freestatistics.org/blog/index.php?pk=28062&T=2

[TABLE]
[ROW][C]Partial Autocorrelation Function[/C][/ROW]
[ROW][C]Time lag k[/C][C]PACF(k)[/C][C]T-STAT[/C][C]P-value[/C][/ROW]
[ROW][C]1[/C][C]0.063647[/C][C]0.6038[/C][C]0.273746[/C][/ROW]
[ROW][C]2[/C][C]-0.14775[/C][C]-1.4017[/C][C]0.082225[/C][/ROW]
[ROW][C]3[/C][C]-0.408364[/C][C]-3.8741[/C][C]0.000101[/C][/ROW]
[ROW][C]4[/C][C]-0.387472[/C][C]-3.6759[/C][C]0.000201[/C][/ROW]
[ROW][C]5[/C][C]-0.039728[/C][C]-0.3769[/C][C]0.353569[/C][/ROW]
[ROW][C]6[/C][C]-0.032686[/C][C]-0.3101[/C][C]0.378607[/C][/ROW]
[ROW][C]7[/C][C]-0.148752[/C][C]-1.4112[/C][C]0.080819[/C][/ROW]
[ROW][C]8[/C][C]-0.249551[/C][C]-2.3675[/C][C]0.010027[/C][/ROW]
[ROW][C]9[/C][C]-0.202956[/C][C]-1.9254[/C][C]0.028668[/C][/ROW]
[ROW][C]10[/C][C]-0.148054[/C][C]-1.4046[/C][C]0.081796[/C][/ROW]
[ROW][C]11[/C][C]-0.255348[/C][C]-2.4224[/C][C]0.00871[/C][/ROW]
[ROW][C]12[/C][C]0.097954[/C][C]0.9293[/C][C]0.177617[/C][/ROW]
[ROW][C]13[/C][C]-0.223946[/C][C]-2.1245[/C][C]0.018183[/C][/ROW]
[ROW][C]14[/C][C]0.022636[/C][C]0.2147[/C][C]0.415226[/C][/ROW]
[ROW][C]15[/C][C]0.141271[/C][C]1.3402[/C][C]0.091774[/C][/ROW]
[ROW][C]16[/C][C]-0.011869[/C][C]-0.1126[/C][C]0.4553[/C][/ROW]
[ROW][C]17[/C][C]-0.014134[/C][C]-0.1341[/C][C]0.446817[/C][/ROW]
[ROW][C]18[/C][C]0.07543[/C][C]0.7156[/C][C]0.238048[/C][/ROW]
[ROW][C]19[/C][C]0.08546[/C][C]0.8107[/C][C]0.209824[/C][/ROW]
[/TABLE]
Source: https://freestatistics.org/blog/index.php?pk=28062&T=2

Globally Unique Identifier (entire table): ba.freestatistics.org/blog/index.php?pk=28062&T=2

As an alternative you can also use a QR Code:  

The GUIDs for individual cells are displayed in the table below:

Partial Autocorrelation Function
Time lag kPACF(k)T-STATP-value
10.0636470.60380.273746
2-0.14775-1.40170.082225
3-0.408364-3.87410.000101
4-0.387472-3.67590.000201
5-0.039728-0.37690.353569
6-0.032686-0.31010.378607
7-0.148752-1.41120.080819
8-0.249551-2.36750.010027
9-0.202956-1.92540.028668
10-0.148054-1.40460.081796
11-0.255348-2.42240.00871
120.0979540.92930.177617
13-0.223946-2.12450.018183
140.0226360.21470.415226
150.1412711.34020.091774
16-0.011869-0.11260.4553
17-0.014134-0.13410.446817
180.075430.71560.238048
190.085460.81070.209824


Parameters (Session):
par1 = Default ; par2 = 1 ; par3 = 2 ; par4 = 0 ; par5 = 12 ;
Parameters (R input):
par1 = Default ; par2 = 1 ; par3 = 2 ; par4 = 0 ; par5 = 12 ;
R code (references can be found in the software module):
if (par1 == 'Default') {
par1 = 10*log10(length(x))
} else {
par1 <- as.numeric(par1)
}
par2 <- as.numeric(par2)
par3 <- as.numeric(par3)
par4 <- as.numeric(par4)
par5 <- as.numeric(par5)
if (par2 == 0) {
x <- log(x)
} else {
x <- (x ^ par2 - 1) / par2
}
if (par3 > 0) x <- diff(x,lag=1,difference=par3)
if (par4 > 0) x <- diff(x,lag=par5,difference=par4)
bitmap(file='pic1.png')
racf <- acf(x,par1,main='Autocorrelation',xlab='lags',ylab='ACF')
dev.off()
bitmap(file='pic2.png')
rpacf <- pacf(x,par1,main='Partial Autocorrelation',xlab='lags',ylab='PACF')
dev.off()
(myacf <- c(racf$acf))
(mypacf <- c(rpacf$acf))
lengthx <- length(x)
sqrtn <- sqrt(lengthx)
load(file='createtable')
a<-table.start()
a<-table.row.start(a)
a<-table.element(a,'Autocorrelation Function',4,TRUE)
a<-table.row.end(a)
a<-table.row.start(a)
a<-table.element(a,'Time lag k',header=TRUE)
a<-table.element(a,hyperlink('basics.htm','ACF(k)','click here for more information about the Autocorrelation Function'),header=TRUE)
a<-table.element(a,'T-STAT',header=TRUE)
a<-table.element(a,'P-value',header=TRUE)
a<-table.row.end(a)
for (i in 2:(par1+1)) {
a<-table.row.start(a)
a<-table.element(a,i-1,header=TRUE)
a<-table.element(a,round(myacf[i],6))
mytstat <- myacf[i]*sqrtn
a<-table.element(a,round(mytstat,4))
a<-table.element(a,round(1-pt(abs(mytstat),lengthx),6))
a<-table.row.end(a)
}
a<-table.end(a)
table.save(a,file='mytable.tab')
a<-table.start()
a<-table.row.start(a)
a<-table.element(a,'Partial Autocorrelation Function',4,TRUE)
a<-table.row.end(a)
a<-table.row.start(a)
a<-table.element(a,'Time lag k',header=TRUE)
a<-table.element(a,hyperlink('basics.htm','PACF(k)','click here for more information about the Partial Autocorrelation Function'),header=TRUE)
a<-table.element(a,'T-STAT',header=TRUE)
a<-table.element(a,'P-value',header=TRUE)
a<-table.row.end(a)
for (i in 1:par1) {
a<-table.row.start(a)
a<-table.element(a,i,header=TRUE)
a<-table.element(a,round(mypacf[i],6))
mytstat <- mypacf[i]*sqrtn
a<-table.element(a,round(mytstat,4))
a<-table.element(a,round(1-pt(abs(mytstat),lengthx),6))
a<-table.row.end(a)
}
a<-table.end(a)
table.save(a,file='mytable1.tab')