Free Statistics

of Irreproducible Research!

Author's title

Author*Unverified author*
R Software Modulerwasp_cross.wasp
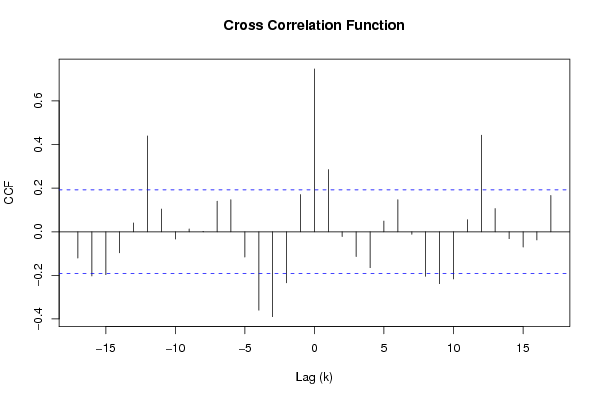
Title produced by softwareCross Correlation Function
Date of computationTue, 02 Dec 2008 09:29:33 -0700
Cite this page as followsStatistical Computations at FreeStatistics.org, Office for Research Development and Education, URL https://freestatistics.org/blog/index.php?v=date/2008/Dec/02/t12282354288ltmz6ug6nhxsqe.htm/, Retrieved Sun, 19 May 2024 10:06:19 +0000
Statistical Computations at FreeStatistics.org, Office for Research Development and Education, URL https://freestatistics.org/blog/index.php?pk=28040, Retrieved Sun, 19 May 2024 10:06:19 +0000
QR Codes:

Original text written by user:
IsPrivate?No (this computation is public)
User-defined keywords
Estimated Impact203
Family? (F = Feedback message, R = changed R code, M = changed R Module, P = changed Parameters, D = changed Data)
F       [Cross Correlation Function] [] [2008-12-02 16:29:33] [cdc575afe547a0c8f1ab59a46ec2fd93] [Current]
F         [Cross Correlation Function] [Q9] [2008-12-02 18:22:47] [74be16979710d4c4e7c6647856088456]
- RMPD    [Variance Reduction Matrix] [] [2008-12-04 12:49:06] [3ba9e05a140f75dbe22af2042ab9e185]
- RMPD    [Variance Reduction Matrix] [] [2008-12-04 12:52:15] [3ba9e05a140f75dbe22af2042ab9e185]
-   P     [Cross Correlation Function] [] [2008-12-04 12:57:44] [3ba9e05a140f75dbe22af2042ab9e185]
Feedback Forum
2008-12-04 13:00:04 [Glenn Maras] [reply
De berekening klopt wel maar ik weet niet of het ook correct is aangezien de d en D uit Q8 moesten ingegeven worden. De student heeft hier alleen d=1 ingevoerd en niets over D gezegd. Ik weet dus niet of het hier om een gok gaat ofniet. Ik heb wel de berekeningen in Q8 voor zijn tijdreeksen gedaan en daaruit zien we dat d=1 en D=1 voor zowel X als Y.
Hij bespreekt ook het verschil met de vorige corss correlation niet. Nochtans is het duidelijk dat het verloop anders is. De lange termijn trend is niet meer te zien. Er zijn wel nog veel uitschieters dus daarom kan het misschien nuttig zijn om D gelijk aan 1 te stellen.
Ik heb dit gereproduced en dat staat dus bij op het feedback forum.
2008-12-06 13:53:10 [Maarten Van Gucht] [reply
je kan hier duidelijk zien (en zoals de student het ook vermeld) dat de lange termijn trend is weggewerkt, maar de seizonale trend is nog sterk aanwezig. dit zie je omdat op de k=-12, K=12 en k= 0 dat de correlatie ongeveer gelijk zijn aan elkaar. (allemaal significant verschillend, en dus niet aan het toeval te wijten kunnen zijn)
de student zou dus eigenlijk D=1 moeten nemen om deze seizoenaliteit te differentieren en om zo een stationnaire tijdreeks te bekomen.
2008-12-10 09:43:39 [Peter Van Doninck] [reply
De student kan hier geen conclusie geven, aangezien ze de berekeningen in vraag 8 niet heeft opgelost. Hierdoor kan ik de verkregen output ook niet analyseren.

Post a new message
Dataseries X:
7.5
7.2
6.9
6.7
6.4
6.3
6.8
7.3
7.1
7.1
6.8
6.5
6.3
6.1
6.1
6.3
6.3
6
6.2
6.4
6.8
7.5
7.5
7.6
7.6
7.4
7.3
7.1
6.9
6.8
7.5
7.6
7.8
8.0
8.1
8.2
8.3
8.2
8.0
7.9
7.6
7.6
8.2
8.3
8.4
8.4
8.4
8.6
8.9
8.8
8.3
7.5
7.2
7.5
8.8
9.3
9.3
8.7
8.2
8.3
8.5
8.6
8.6
8.2
8.1
8.0
8.6
8.7
8.8
8.5
8.4
8.5
8.7
8.7
8.6
8.5
8.3
8.1
8.2
8.1
8.1
7.9
7.9
7.9
8.0
8.0
7.9
8.0
7.7
7.2
7.5
7.3
7.0
7.0
7.0
7.2
7.3
7.1
6.8
6.6
6.2
6.2
6.8
6.9
6.8
Dataseries Y:
15.9
15.5
15.3
14.5
14.4
14.7
19.1
21.6
20.2
17.9
15.7
14.5
14.1
13.9
14.2
15.3
15.4
15.2
16.5
18.2
18.6
21.0
19.2
18.7
18.4
17.8
17.2
16.2
15.5
15.3
18.3
19.2
19.0
18.7
18.1
18.5
21.1
21.0
20.4
19.5
18.6
18.8
23.7
24.8
25.0
23.6
22.3
21.8
20.8
19.7
18.3
17.4
17.0
18.1
23.9
25.6
25.3
23.6
21.9
21.4
20.6
20.5
20.2
20.6
19.7
19.3
22.8
23.5
23.8
22.6
22.0
21.7
20.7
20.2
19.1
19.5
18.7
18.6
22.2
23.2
23.5
21.3
20.0
18.7
18.9
18.3
18.4
19.9
19.2
18.5
20.9
20.5
19.4
18.1
17.0
17.0
17.3
16.7
15.5
15.3
13.7
14.1
17.3
18.1
18.1


Summary of computational transaction
Raw Inputview raw input (R code)
Raw Outputview raw output of R engine
Computing time3 seconds
R Server'Herman Ole Andreas Wold' @ 193.190.124.10:1001

\begin{tabular}{lllllllll}
\hline
Summary of computational transaction \tabularnewline
Raw Input & view raw input (R code)  \tabularnewline
Raw Output & view raw output of R engine  \tabularnewline
Computing time & 3 seconds \tabularnewline
R Server & 'Herman Ole Andreas Wold' @ 193.190.124.10:1001 \tabularnewline
\hline
\end{tabular}
%Source: https://freestatistics.org/blog/index.php?pk=28040&T=0

[TABLE]
[ROW][C]Summary of computational transaction[/C][/ROW]
[ROW][C]Raw Input[/C][C]view raw input (R code) [/C][/ROW]
[ROW][C]Raw Output[/C][C]view raw output of R engine [/C][/ROW]
[ROW][C]Computing time[/C][C]3 seconds[/C][/ROW]
[ROW][C]R Server[/C][C]'Herman Ole Andreas Wold' @ 193.190.124.10:1001[/C][/ROW]
[/TABLE]
Source: https://freestatistics.org/blog/index.php?pk=28040&T=0

Globally Unique Identifier (entire table): ba.freestatistics.org/blog/index.php?pk=28040&T=0

As an alternative you can also use a QR Code:  

The GUIDs for individual cells are displayed in the table below:

Summary of computational transaction
Raw Inputview raw input (R code)
Raw Outputview raw output of R engine
Computing time3 seconds
R Server'Herman Ole Andreas Wold' @ 193.190.124.10:1001


Cross Correlation Function
ParameterValue
Box-Cox transformation parameter (lambda) of X series1
Degree of non-seasonal differencing (d) of X series1
Degree of seasonal differencing (D) of X series0
Seasonal Period (s)1
Box-Cox transformation parameter (lambda) of Y series1
Degree of non-seasonal differencing (d) of Y series1
Degree of seasonal differencing (D) of Y series0
krho(Y[t],X[t+k])
-17-0.120489580146780
-16-0.202474750912598
-15-0.197006936183794
-14-0.09638749276413
-130.0404911573110885
-120.439511016007128
-110.103899834303140
-10-0.0336780408811036
-90.0127200909114158
-80.00209968852846959
-70.140471167703204
-60.146851848473226
-5-0.115889173371662
-4-0.359759411662646
-3-0.389390877472803
-2-0.234315624727332
-10.170616925942105
00.746762108846864
10.285219301245167
2-0.0220575203084153
3-0.113634146223441
4-0.164998604276901
50.0492390810751717
60.146835098637607
7-0.0117115575398368
8-0.204637251324637
9-0.237993542358556
10-0.216571589731008
110.0554216225637522
120.442896576531556
130.106330573669246
14-0.0318775946082062
15-0.0700222448996172
16-0.037689868095947
170.166742882230836

\begin{tabular}{lllllllll}
\hline
Cross Correlation Function \tabularnewline
Parameter & Value \tabularnewline
Box-Cox transformation parameter (lambda) of X series & 1 \tabularnewline
Degree of non-seasonal differencing (d) of X series & 1 \tabularnewline
Degree of seasonal differencing (D) of X series & 0 \tabularnewline
Seasonal Period (s) & 1 \tabularnewline
Box-Cox transformation parameter (lambda) of Y series & 1 \tabularnewline
Degree of non-seasonal differencing (d) of Y series & 1 \tabularnewline
Degree of seasonal differencing (D) of Y series & 0 \tabularnewline
k & rho(Y[t],X[t+k]) \tabularnewline
-17 & -0.120489580146780 \tabularnewline
-16 & -0.202474750912598 \tabularnewline
-15 & -0.197006936183794 \tabularnewline
-14 & -0.09638749276413 \tabularnewline
-13 & 0.0404911573110885 \tabularnewline
-12 & 0.439511016007128 \tabularnewline
-11 & 0.103899834303140 \tabularnewline
-10 & -0.0336780408811036 \tabularnewline
-9 & 0.0127200909114158 \tabularnewline
-8 & 0.00209968852846959 \tabularnewline
-7 & 0.140471167703204 \tabularnewline
-6 & 0.146851848473226 \tabularnewline
-5 & -0.115889173371662 \tabularnewline
-4 & -0.359759411662646 \tabularnewline
-3 & -0.389390877472803 \tabularnewline
-2 & -0.234315624727332 \tabularnewline
-1 & 0.170616925942105 \tabularnewline
0 & 0.746762108846864 \tabularnewline
1 & 0.285219301245167 \tabularnewline
2 & -0.0220575203084153 \tabularnewline
3 & -0.113634146223441 \tabularnewline
4 & -0.164998604276901 \tabularnewline
5 & 0.0492390810751717 \tabularnewline
6 & 0.146835098637607 \tabularnewline
7 & -0.0117115575398368 \tabularnewline
8 & -0.204637251324637 \tabularnewline
9 & -0.237993542358556 \tabularnewline
10 & -0.216571589731008 \tabularnewline
11 & 0.0554216225637522 \tabularnewline
12 & 0.442896576531556 \tabularnewline
13 & 0.106330573669246 \tabularnewline
14 & -0.0318775946082062 \tabularnewline
15 & -0.0700222448996172 \tabularnewline
16 & -0.037689868095947 \tabularnewline
17 & 0.166742882230836 \tabularnewline
\hline
\end{tabular}
%Source: https://freestatistics.org/blog/index.php?pk=28040&T=1

[TABLE]
[ROW][C]Cross Correlation Function[/C][/ROW]
[ROW][C]Parameter[/C][C]Value[/C][/ROW]
[ROW][C]Box-Cox transformation parameter (lambda) of X series[/C][C]1[/C][/ROW]
[ROW][C]Degree of non-seasonal differencing (d) of X series[/C][C]1[/C][/ROW]
[ROW][C]Degree of seasonal differencing (D) of X series[/C][C]0[/C][/ROW]
[ROW][C]Seasonal Period (s)[/C][C]1[/C][/ROW]
[ROW][C]Box-Cox transformation parameter (lambda) of Y series[/C][C]1[/C][/ROW]
[ROW][C]Degree of non-seasonal differencing (d) of Y series[/C][C]1[/C][/ROW]
[ROW][C]Degree of seasonal differencing (D) of Y series[/C][C]0[/C][/ROW]
[ROW][C]k[/C][C]rho(Y[t],X[t+k])[/C][/ROW]
[ROW][C]-17[/C][C]-0.120489580146780[/C][/ROW]
[ROW][C]-16[/C][C]-0.202474750912598[/C][/ROW]
[ROW][C]-15[/C][C]-0.197006936183794[/C][/ROW]
[ROW][C]-14[/C][C]-0.09638749276413[/C][/ROW]
[ROW][C]-13[/C][C]0.0404911573110885[/C][/ROW]
[ROW][C]-12[/C][C]0.439511016007128[/C][/ROW]
[ROW][C]-11[/C][C]0.103899834303140[/C][/ROW]
[ROW][C]-10[/C][C]-0.0336780408811036[/C][/ROW]
[ROW][C]-9[/C][C]0.0127200909114158[/C][/ROW]
[ROW][C]-8[/C][C]0.00209968852846959[/C][/ROW]
[ROW][C]-7[/C][C]0.140471167703204[/C][/ROW]
[ROW][C]-6[/C][C]0.146851848473226[/C][/ROW]
[ROW][C]-5[/C][C]-0.115889173371662[/C][/ROW]
[ROW][C]-4[/C][C]-0.359759411662646[/C][/ROW]
[ROW][C]-3[/C][C]-0.389390877472803[/C][/ROW]
[ROW][C]-2[/C][C]-0.234315624727332[/C][/ROW]
[ROW][C]-1[/C][C]0.170616925942105[/C][/ROW]
[ROW][C]0[/C][C]0.746762108846864[/C][/ROW]
[ROW][C]1[/C][C]0.285219301245167[/C][/ROW]
[ROW][C]2[/C][C]-0.0220575203084153[/C][/ROW]
[ROW][C]3[/C][C]-0.113634146223441[/C][/ROW]
[ROW][C]4[/C][C]-0.164998604276901[/C][/ROW]
[ROW][C]5[/C][C]0.0492390810751717[/C][/ROW]
[ROW][C]6[/C][C]0.146835098637607[/C][/ROW]
[ROW][C]7[/C][C]-0.0117115575398368[/C][/ROW]
[ROW][C]8[/C][C]-0.204637251324637[/C][/ROW]
[ROW][C]9[/C][C]-0.237993542358556[/C][/ROW]
[ROW][C]10[/C][C]-0.216571589731008[/C][/ROW]
[ROW][C]11[/C][C]0.0554216225637522[/C][/ROW]
[ROW][C]12[/C][C]0.442896576531556[/C][/ROW]
[ROW][C]13[/C][C]0.106330573669246[/C][/ROW]
[ROW][C]14[/C][C]-0.0318775946082062[/C][/ROW]
[ROW][C]15[/C][C]-0.0700222448996172[/C][/ROW]
[ROW][C]16[/C][C]-0.037689868095947[/C][/ROW]
[ROW][C]17[/C][C]0.166742882230836[/C][/ROW]
[/TABLE]
Source: https://freestatistics.org/blog/index.php?pk=28040&T=1

Globally Unique Identifier (entire table): ba.freestatistics.org/blog/index.php?pk=28040&T=1

As an alternative you can also use a QR Code:  

The GUIDs for individual cells are displayed in the table below:

Cross Correlation Function
ParameterValue
Box-Cox transformation parameter (lambda) of X series1
Degree of non-seasonal differencing (d) of X series1
Degree of seasonal differencing (D) of X series0
Seasonal Period (s)1
Box-Cox transformation parameter (lambda) of Y series1
Degree of non-seasonal differencing (d) of Y series1
Degree of seasonal differencing (D) of Y series0
krho(Y[t],X[t+k])
-17-0.120489580146780
-16-0.202474750912598
-15-0.197006936183794
-14-0.09638749276413
-130.0404911573110885
-120.439511016007128
-110.103899834303140
-10-0.0336780408811036
-90.0127200909114158
-80.00209968852846959
-70.140471167703204
-60.146851848473226
-5-0.115889173371662
-4-0.359759411662646
-3-0.389390877472803
-2-0.234315624727332
-10.170616925942105
00.746762108846864
10.285219301245167
2-0.0220575203084153
3-0.113634146223441
4-0.164998604276901
50.0492390810751717
60.146835098637607
7-0.0117115575398368
8-0.204637251324637
9-0.237993542358556
10-0.216571589731008
110.0554216225637522
120.442896576531556
130.106330573669246
14-0.0318775946082062
15-0.0700222448996172
16-0.037689868095947
170.166742882230836


Parameters (Session):
par1 = 1 ; par2 = 1 ; par3 = 0 ; par4 = 1 ; par5 = 1 ; par6 = 1 ; par7 = 0 ;
Parameters (R input):
par1 = 1 ; par2 = 1 ; par3 = 0 ; par4 = 1 ; par5 = 1 ; par6 = 1 ; par7 = 0 ;
R code (references can be found in the software module):
par1 <- as.numeric(par1)
par2 <- as.numeric(par2)
par3 <- as.numeric(par3)
par4 <- as.numeric(par4)
par5 <- as.numeric(par5)
par6 <- as.numeric(par6)
par7 <- as.numeric(par7)
if (par1 == 0) {
x <- log(x)
} else {
x <- (x ^ par1 - 1) / par1
}
if (par5 == 0) {
y <- log(y)
} else {
y <- (y ^ par5 - 1) / par5
}
if (par2 > 0) x <- diff(x,lag=1,difference=par2)
if (par6 > 0) y <- diff(y,lag=1,difference=par6)
if (par3 > 0) x <- diff(x,lag=par4,difference=par3)
if (par7 > 0) y <- diff(y,lag=par4,difference=par7)
x
y
bitmap(file='test1.png')
(r <- ccf(x,y,main='Cross Correlation Function',ylab='CCF',xlab='Lag (k)'))
dev.off()
load(file='createtable')
a<-table.start()
a<-table.row.start(a)
a<-table.element(a,'Cross Correlation Function',2,TRUE)
a<-table.row.end(a)
a<-table.row.start(a)
a<-table.element(a,'Parameter',header=TRUE)
a<-table.element(a,'Value',header=TRUE)
a<-table.row.end(a)
a<-table.row.start(a)
a<-table.element(a,'Box-Cox transformation parameter (lambda) of X series',header=TRUE)
a<-table.element(a,par1)
a<-table.row.end(a)
a<-table.row.start(a)
a<-table.element(a,'Degree of non-seasonal differencing (d) of X series',header=TRUE)
a<-table.element(a,par2)
a<-table.row.end(a)
a<-table.row.start(a)
a<-table.element(a,'Degree of seasonal differencing (D) of X series',header=TRUE)
a<-table.element(a,par3)
a<-table.row.end(a)
a<-table.row.start(a)
a<-table.element(a,'Seasonal Period (s)',header=TRUE)
a<-table.element(a,par4)
a<-table.row.end(a)
a<-table.row.start(a)
a<-table.element(a,'Box-Cox transformation parameter (lambda) of Y series',header=TRUE)
a<-table.element(a,par5)
a<-table.row.end(a)
a<-table.row.start(a)
a<-table.element(a,'Degree of non-seasonal differencing (d) of Y series',header=TRUE)
a<-table.element(a,par6)
a<-table.row.end(a)
a<-table.row.start(a)
a<-table.element(a,'Degree of seasonal differencing (D) of Y series',header=TRUE)
a<-table.element(a,par7)
a<-table.row.end(a)
a<-table.row.start(a)
a<-table.element(a,'k',header=TRUE)
a<-table.element(a,'rho(Y[t],X[t+k])',header=TRUE)
a<-table.row.end(a)
mylength <- length(r$acf)
myhalf <- floor((mylength-1)/2)
for (i in 1:mylength) {
a<-table.row.start(a)
a<-table.element(a,i-myhalf-1,header=TRUE)
a<-table.element(a,r$acf[i])
a<-table.row.end(a)
}
a<-table.end(a)
table.save(a,file='mytable.tab')