Free Statistics

of Irreproducible Research!

Author's title

Author*Unverified author*
R Software Modulerwasp_cross.wasp
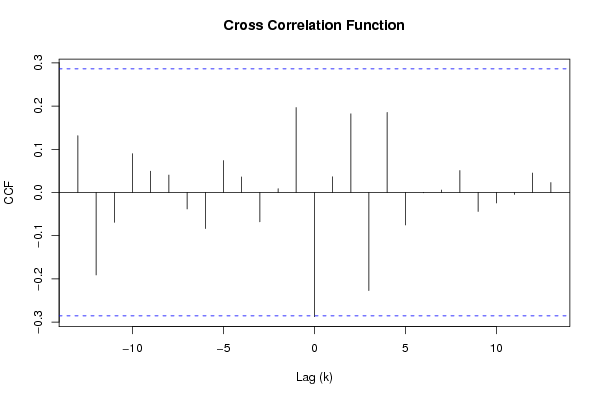
Title produced by softwareCross Correlation Function
Date of computationTue, 02 Dec 2008 09:07:01 -0700
Cite this page as followsStatistical Computations at FreeStatistics.org, Office for Research Development and Education, URL https://freestatistics.org/blog/index.php?v=date/2008/Dec/02/t122823407270d0br45buafjqa.htm/, Retrieved Sun, 19 May 2024 12:37:34 +0000
Statistical Computations at FreeStatistics.org, Office for Research Development and Education, URL https://freestatistics.org/blog/index.php?pk=28003, Retrieved Sun, 19 May 2024 12:37:34 +0000
QR Codes:

Original text written by user:
IsPrivate?No (this computation is public)
User-defined keywords
Estimated Impact174
Family? (F = Feedback message, R = changed R code, M = changed R Module, P = changed Parameters, D = changed Data)
F       [Cross Correlation Function] [Stefan Temmerman] [2008-12-02 16:07:01] [30f7cb12a8cb61e43b87da59ece37a2f] [Current]
Feedback Forum
2008-12-06 14:44:09 [Natalie De Wilde] [reply
Slechts een zeer korte bespreking. Maar alle waarden liggen binnen het 95% betrouwbaarheidsinterval. Er is geen trend te zien, en ook geen seizoenaliteit.
Het model is goed
2008-12-07 10:50:13 [Lana Van Wesemael] [reply
Hier heeft de student de lamda waarde niet aangepast. Misschien waren de lambda’s echt gelijk aan 1, maar dit zou wel erg toevalig zijn. De lamda waarde kan je bepalen door de standard deviation mean plot te produceren (dit wordt gevraagd in Q8). Hierin staat duidelijk aangegeven waaraan lambda gelijk moet zijn. Waarschijnlijk bekom je een andere grafiek daar de lambda waarden aan te passen.
2008-12-07 21:14:51 [Stefan Temmerman] [reply
Ik heb de lambda waarde niet toegepast, voor de rest is de tijdreeks wel meer stationair geworden.

Post a new message
Dataseries X:
8
-10
-24
-19
8
24
14
7
9
-26
19
15
-1
-10
-21
-14
-27
26
23
5
19
-19
24
17
1
-9
-16
-21
-14
31
27
10
12
-23
13
26
-1
4
-16
-5
9
23
9
2
10
-29
17
9
9
-10
-23
13
13
-9
9
5
8
-18
7
4
Dataseries Y:
-7
-13
-11
-9
8
24
4
7
16
-30
26
19
2
-12
-29
-24
-16
25
22
-7
17
-29
18
15
1
6
-21
-23
-15
24
15
15
14
-25
14
21
13
4
-16
13
20
27
-8
13
12
-25
20
22
16
-12
-13
7
12
-8
12
-13
12
-25
0
18


Summary of computational transaction
Raw Inputview raw input (R code)
Raw Outputview raw output of R engine
Computing time0 seconds
R Server'George Udny Yule' @ 72.249.76.132

\begin{tabular}{lllllllll}
\hline
Summary of computational transaction \tabularnewline
Raw Input & view raw input (R code)  \tabularnewline
Raw Output & view raw output of R engine  \tabularnewline
Computing time & 0 seconds \tabularnewline
R Server & 'George Udny Yule' @ 72.249.76.132 \tabularnewline
\hline
\end{tabular}
%Source: https://freestatistics.org/blog/index.php?pk=28003&T=0

[TABLE]
[ROW][C]Summary of computational transaction[/C][/ROW]
[ROW][C]Raw Input[/C][C]view raw input (R code) [/C][/ROW]
[ROW][C]Raw Output[/C][C]view raw output of R engine [/C][/ROW]
[ROW][C]Computing time[/C][C]0 seconds[/C][/ROW]
[ROW][C]R Server[/C][C]'George Udny Yule' @ 72.249.76.132[/C][/ROW]
[/TABLE]
Source: https://freestatistics.org/blog/index.php?pk=28003&T=0

Globally Unique Identifier (entire table): ba.freestatistics.org/blog/index.php?pk=28003&T=0

As an alternative you can also use a QR Code:  

The GUIDs for individual cells are displayed in the table below:

Summary of computational transaction
Raw Inputview raw input (R code)
Raw Outputview raw output of R engine
Computing time0 seconds
R Server'George Udny Yule' @ 72.249.76.132


Cross Correlation Function
ParameterValue
Box-Cox transformation parameter (lambda) of X series1
Degree of non-seasonal differencing (d) of X series1
Degree of seasonal differencing (D) of X series0
Seasonal Period (s)12
Box-Cox transformation parameter (lambda) of Y series1
Degree of non-seasonal differencing (d) of Y series1
Degree of seasonal differencing (D) of Y series1
krho(Y[t],X[t+k])
-130.131413961208041
-12-0.190927481279190
-11-0.0691834756364674
-100.0898205183864452
-90.0492802527155734
-80.0401301993615137
-7-0.0381417138055877
-6-0.0835684111901116
-50.0737306865784916
-40.0359803494862137
-3-0.0680261937530745
-20.00865381235553238
-10.196579380844791
0-0.287457840847948
10.0362823521829519
20.181973392482712
3-0.227136502116070
40.185314549061015
5-0.0750777645321004
6-0.00089933323448311
70.00552569875878633
80.0506451686457063
9-0.0439503113636736
10-0.0241230206809123
11-0.00456293137810932
120.0449323667757405
130.0229875356539946

\begin{tabular}{lllllllll}
\hline
Cross Correlation Function \tabularnewline
Parameter & Value \tabularnewline
Box-Cox transformation parameter (lambda) of X series & 1 \tabularnewline
Degree of non-seasonal differencing (d) of X series & 1 \tabularnewline
Degree of seasonal differencing (D) of X series & 0 \tabularnewline
Seasonal Period (s) & 12 \tabularnewline
Box-Cox transformation parameter (lambda) of Y series & 1 \tabularnewline
Degree of non-seasonal differencing (d) of Y series & 1 \tabularnewline
Degree of seasonal differencing (D) of Y series & 1 \tabularnewline
k & rho(Y[t],X[t+k]) \tabularnewline
-13 & 0.131413961208041 \tabularnewline
-12 & -0.190927481279190 \tabularnewline
-11 & -0.0691834756364674 \tabularnewline
-10 & 0.0898205183864452 \tabularnewline
-9 & 0.0492802527155734 \tabularnewline
-8 & 0.0401301993615137 \tabularnewline
-7 & -0.0381417138055877 \tabularnewline
-6 & -0.0835684111901116 \tabularnewline
-5 & 0.0737306865784916 \tabularnewline
-4 & 0.0359803494862137 \tabularnewline
-3 & -0.0680261937530745 \tabularnewline
-2 & 0.00865381235553238 \tabularnewline
-1 & 0.196579380844791 \tabularnewline
0 & -0.287457840847948 \tabularnewline
1 & 0.0362823521829519 \tabularnewline
2 & 0.181973392482712 \tabularnewline
3 & -0.227136502116070 \tabularnewline
4 & 0.185314549061015 \tabularnewline
5 & -0.0750777645321004 \tabularnewline
6 & -0.00089933323448311 \tabularnewline
7 & 0.00552569875878633 \tabularnewline
8 & 0.0506451686457063 \tabularnewline
9 & -0.0439503113636736 \tabularnewline
10 & -0.0241230206809123 \tabularnewline
11 & -0.00456293137810932 \tabularnewline
12 & 0.0449323667757405 \tabularnewline
13 & 0.0229875356539946 \tabularnewline
\hline
\end{tabular}
%Source: https://freestatistics.org/blog/index.php?pk=28003&T=1

[TABLE]
[ROW][C]Cross Correlation Function[/C][/ROW]
[ROW][C]Parameter[/C][C]Value[/C][/ROW]
[ROW][C]Box-Cox transformation parameter (lambda) of X series[/C][C]1[/C][/ROW]
[ROW][C]Degree of non-seasonal differencing (d) of X series[/C][C]1[/C][/ROW]
[ROW][C]Degree of seasonal differencing (D) of X series[/C][C]0[/C][/ROW]
[ROW][C]Seasonal Period (s)[/C][C]12[/C][/ROW]
[ROW][C]Box-Cox transformation parameter (lambda) of Y series[/C][C]1[/C][/ROW]
[ROW][C]Degree of non-seasonal differencing (d) of Y series[/C][C]1[/C][/ROW]
[ROW][C]Degree of seasonal differencing (D) of Y series[/C][C]1[/C][/ROW]
[ROW][C]k[/C][C]rho(Y[t],X[t+k])[/C][/ROW]
[ROW][C]-13[/C][C]0.131413961208041[/C][/ROW]
[ROW][C]-12[/C][C]-0.190927481279190[/C][/ROW]
[ROW][C]-11[/C][C]-0.0691834756364674[/C][/ROW]
[ROW][C]-10[/C][C]0.0898205183864452[/C][/ROW]
[ROW][C]-9[/C][C]0.0492802527155734[/C][/ROW]
[ROW][C]-8[/C][C]0.0401301993615137[/C][/ROW]
[ROW][C]-7[/C][C]-0.0381417138055877[/C][/ROW]
[ROW][C]-6[/C][C]-0.0835684111901116[/C][/ROW]
[ROW][C]-5[/C][C]0.0737306865784916[/C][/ROW]
[ROW][C]-4[/C][C]0.0359803494862137[/C][/ROW]
[ROW][C]-3[/C][C]-0.0680261937530745[/C][/ROW]
[ROW][C]-2[/C][C]0.00865381235553238[/C][/ROW]
[ROW][C]-1[/C][C]0.196579380844791[/C][/ROW]
[ROW][C]0[/C][C]-0.287457840847948[/C][/ROW]
[ROW][C]1[/C][C]0.0362823521829519[/C][/ROW]
[ROW][C]2[/C][C]0.181973392482712[/C][/ROW]
[ROW][C]3[/C][C]-0.227136502116070[/C][/ROW]
[ROW][C]4[/C][C]0.185314549061015[/C][/ROW]
[ROW][C]5[/C][C]-0.0750777645321004[/C][/ROW]
[ROW][C]6[/C][C]-0.00089933323448311[/C][/ROW]
[ROW][C]7[/C][C]0.00552569875878633[/C][/ROW]
[ROW][C]8[/C][C]0.0506451686457063[/C][/ROW]
[ROW][C]9[/C][C]-0.0439503113636736[/C][/ROW]
[ROW][C]10[/C][C]-0.0241230206809123[/C][/ROW]
[ROW][C]11[/C][C]-0.00456293137810932[/C][/ROW]
[ROW][C]12[/C][C]0.0449323667757405[/C][/ROW]
[ROW][C]13[/C][C]0.0229875356539946[/C][/ROW]
[/TABLE]
Source: https://freestatistics.org/blog/index.php?pk=28003&T=1

Globally Unique Identifier (entire table): ba.freestatistics.org/blog/index.php?pk=28003&T=1

As an alternative you can also use a QR Code:  

The GUIDs for individual cells are displayed in the table below:

Cross Correlation Function
ParameterValue
Box-Cox transformation parameter (lambda) of X series1
Degree of non-seasonal differencing (d) of X series1
Degree of seasonal differencing (D) of X series0
Seasonal Period (s)12
Box-Cox transformation parameter (lambda) of Y series1
Degree of non-seasonal differencing (d) of Y series1
Degree of seasonal differencing (D) of Y series1
krho(Y[t],X[t+k])
-130.131413961208041
-12-0.190927481279190
-11-0.0691834756364674
-100.0898205183864452
-90.0492802527155734
-80.0401301993615137
-7-0.0381417138055877
-6-0.0835684111901116
-50.0737306865784916
-40.0359803494862137
-3-0.0680261937530745
-20.00865381235553238
-10.196579380844791
0-0.287457840847948
10.0362823521829519
20.181973392482712
3-0.227136502116070
40.185314549061015
5-0.0750777645321004
6-0.00089933323448311
70.00552569875878633
80.0506451686457063
9-0.0439503113636736
10-0.0241230206809123
11-0.00456293137810932
120.0449323667757405
130.0229875356539946


Parameters (Session):
par1 = 1 ; par2 = 1 ; par3 = 0 ; par4 = 12 ; par5 = 1 ; par6 = 1 ; par7 = 1 ;
Parameters (R input):
par1 = 1 ; par2 = 1 ; par3 = 0 ; par4 = 12 ; par5 = 1 ; par6 = 1 ; par7 = 1 ;
R code (references can be found in the software module):
par1 <- as.numeric(par1)
par2 <- as.numeric(par2)
par3 <- as.numeric(par3)
par4 <- as.numeric(par4)
par5 <- as.numeric(par5)
par6 <- as.numeric(par6)
par7 <- as.numeric(par7)
if (par1 == 0) {
x <- log(x)
} else {
x <- (x ^ par1 - 1) / par1
}
if (par5 == 0) {
y <- log(y)
} else {
y <- (y ^ par5 - 1) / par5
}
if (par2 > 0) x <- diff(x,lag=1,difference=par2)
if (par6 > 0) y <- diff(y,lag=1,difference=par6)
if (par3 > 0) x <- diff(x,lag=par4,difference=par3)
if (par7 > 0) y <- diff(y,lag=par4,difference=par7)
x
y
bitmap(file='test1.png')
(r <- ccf(x,y,main='Cross Correlation Function',ylab='CCF',xlab='Lag (k)'))
dev.off()
load(file='createtable')
a<-table.start()
a<-table.row.start(a)
a<-table.element(a,'Cross Correlation Function',2,TRUE)
a<-table.row.end(a)
a<-table.row.start(a)
a<-table.element(a,'Parameter',header=TRUE)
a<-table.element(a,'Value',header=TRUE)
a<-table.row.end(a)
a<-table.row.start(a)
a<-table.element(a,'Box-Cox transformation parameter (lambda) of X series',header=TRUE)
a<-table.element(a,par1)
a<-table.row.end(a)
a<-table.row.start(a)
a<-table.element(a,'Degree of non-seasonal differencing (d) of X series',header=TRUE)
a<-table.element(a,par2)
a<-table.row.end(a)
a<-table.row.start(a)
a<-table.element(a,'Degree of seasonal differencing (D) of X series',header=TRUE)
a<-table.element(a,par3)
a<-table.row.end(a)
a<-table.row.start(a)
a<-table.element(a,'Seasonal Period (s)',header=TRUE)
a<-table.element(a,par4)
a<-table.row.end(a)
a<-table.row.start(a)
a<-table.element(a,'Box-Cox transformation parameter (lambda) of Y series',header=TRUE)
a<-table.element(a,par5)
a<-table.row.end(a)
a<-table.row.start(a)
a<-table.element(a,'Degree of non-seasonal differencing (d) of Y series',header=TRUE)
a<-table.element(a,par6)
a<-table.row.end(a)
a<-table.row.start(a)
a<-table.element(a,'Degree of seasonal differencing (D) of Y series',header=TRUE)
a<-table.element(a,par7)
a<-table.row.end(a)
a<-table.row.start(a)
a<-table.element(a,'k',header=TRUE)
a<-table.element(a,'rho(Y[t],X[t+k])',header=TRUE)
a<-table.row.end(a)
mylength <- length(r$acf)
myhalf <- floor((mylength-1)/2)
for (i in 1:mylength) {
a<-table.row.start(a)
a<-table.element(a,i-myhalf-1,header=TRUE)
a<-table.element(a,r$acf[i])
a<-table.row.end(a)
}
a<-table.end(a)
table.save(a,file='mytable.tab')