Free Statistics

of Irreproducible Research!

Author's title

Author*Unverified author*
R Software Modulerwasp_cross.wasp
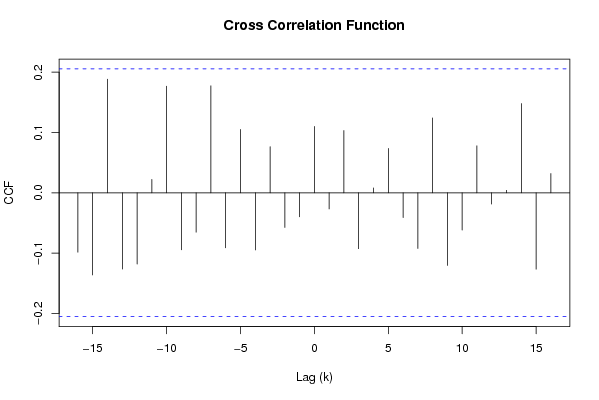
Title produced by softwareCross Correlation Function
Date of computationTue, 02 Dec 2008 08:44:42 -0700
Cite this page as followsStatistical Computations at FreeStatistics.org, Office for Research Development and Education, URL https://freestatistics.org/blog/index.php?v=date/2008/Dec/02/t1228232848ekj6qi8fuhaop91.htm/, Retrieved Sun, 19 May 2024 08:46:44 +0000
Statistical Computations at FreeStatistics.org, Office for Research Development and Education, URL https://freestatistics.org/blog/index.php?pk=27971, Retrieved Sun, 19 May 2024 08:46:44 +0000
QR Codes:

Original text written by user:
IsPrivate?No (this computation is public)
User-defined keywordsk_vanderheggen
Estimated Impact154
Family? (F = Feedback message, R = changed R code, M = changed R Module, P = changed Parameters, D = changed Data)
F       [Cross Correlation Function] [Non stationary Ti...] [2008-12-02 15:44:42] [2731fa16c50d4727d0297daf34574cde] [Current]
-         [Cross Correlation Function] [Paper Cross corre...] [2008-12-18 15:07:05] [1640119c345fbfa2091dc1243f79f7a6]
Feedback Forum
2008-12-06 11:44:49 [Britt Severijns] [reply
Alles ligt in het betrouwbaarheidsinterval. Men kan dus y niet meer verklaren aan de hand van het verleden van x.
2008-12-06 11:59:30 [Käthe Vanderheggen] [reply
Wanneer we d gelijkstellen aan 1 en D aan 0 bekomen we deze autocorrelatie. De tijdreeks is nu redelijk stationair: de waarden schommelen rond 0 en de correlatie is niet significant verschillend van 0.
2008-12-08 15:37:12 [Jessica Alves Pires] [reply
Hoe heb je Q9 kunnen oplossen zonder Q8 te hebben opgelost? Hoe ben je aan je lambda, d en D geraakt?
2008-12-08 20:25:16 [Erik Geysen] [reply
Met de eerste coëfficiënt moeten we geen rekening houden.
De rest van de coëfficiënten liggen bijna allemaal binnen het betrouwbaarheidsinterval wat wil zeggen dat ze aan het toeval kunnen worden toegeschreven. Men kan y dus niet meer verklaren aan de hand van het verleden X.

Post a new message
Dataseries X:
25
27
25
23
24
24
26
25
24
24
22
22
22
27
24
24
22
23
25
23
21
21
22
20
22
22
20
21
20
21
21
21
19
21
21
22
19
24
22
22
22
24
22
23
24
21
20
22
23
23
22
20
21
21
20
20
17
18
19
19
20
21
20
21
19
22
20
18
16
17
18
19
18
20
21
18
19
19
19
21
19
19
17
16
16
17
16
15
16
16
16
18
Dataseries Y:
27
25
20
19
19
17
12
13
13
11
4
8
1
5
4
3
4
2
8
-2
1
0
1
7
1
0
-3
0
3
1
3
2
6
2
3
9
12
8
7
9
11
13
9
9
13
14
16
20
19
18
18
19
16
10
11
17
3
14
15
17
20
19
21
17
15
18
19
16
21
26
23
24
23
19
25
21
19
20
20
17
25
19
13
15
15
13
11
9
2
-2
-4
-2


Summary of computational transaction
Raw Inputview raw input (R code)
Raw Outputview raw output of R engine
Computing time1 seconds
R Server'George Udny Yule' @ 72.249.76.132

\begin{tabular}{lllllllll}
\hline
Summary of computational transaction \tabularnewline
Raw Input & view raw input (R code)  \tabularnewline
Raw Output & view raw output of R engine  \tabularnewline
Computing time & 1 seconds \tabularnewline
R Server & 'George Udny Yule' @ 72.249.76.132 \tabularnewline
\hline
\end{tabular}
%Source: https://freestatistics.org/blog/index.php?pk=27971&T=0

[TABLE]
[ROW][C]Summary of computational transaction[/C][/ROW]
[ROW][C]Raw Input[/C][C]view raw input (R code) [/C][/ROW]
[ROW][C]Raw Output[/C][C]view raw output of R engine [/C][/ROW]
[ROW][C]Computing time[/C][C]1 seconds[/C][/ROW]
[ROW][C]R Server[/C][C]'George Udny Yule' @ 72.249.76.132[/C][/ROW]
[/TABLE]
Source: https://freestatistics.org/blog/index.php?pk=27971&T=0

Globally Unique Identifier (entire table): ba.freestatistics.org/blog/index.php?pk=27971&T=0

As an alternative you can also use a QR Code:  

The GUIDs for individual cells are displayed in the table below:

Summary of computational transaction
Raw Inputview raw input (R code)
Raw Outputview raw output of R engine
Computing time1 seconds
R Server'George Udny Yule' @ 72.249.76.132


Cross Correlation Function
ParameterValue
Box-Cox transformation parameter (lambda) of X series1
Degree of non-seasonal differencing (d) of X series1
Degree of seasonal differencing (D) of X series0
Seasonal Period (s)12
Box-Cox transformation parameter (lambda) of Y series1
Degree of non-seasonal differencing (d) of Y series1
Degree of seasonal differencing (D) of Y series0
krho(Y[t],X[t+k])
-16-0.0985380541422518
-15-0.136343243477076
-140.188380575068228
-13-0.126473020714982
-12-0.118152538980202
-110.0222341840539868
-100.176824743572314
-9-0.094662993929660
-8-0.0652759412436651
-70.177536633742852
-6-0.0913200822342102
-50.105109239155788
-4-0.0948809483755107
-30.0764708741441765
-2-0.0575597877451077
-1-0.0397455500183393
00.110116530255916
1-0.0268664236726181
20.103337297816795
3-0.0926872510309099
40.00809686613449126
50.073610575864539
6-0.0410914894858976
7-0.0922442656961614
80.124231203557661
9-0.120513240380715
10-0.0617886701100544
110.0779088073713472
12-0.0185968923277776
130.00419491543832064
140.148068909606120
15-0.126683898717786
160.0319826919956711

\begin{tabular}{lllllllll}
\hline
Cross Correlation Function \tabularnewline
Parameter & Value \tabularnewline
Box-Cox transformation parameter (lambda) of X series & 1 \tabularnewline
Degree of non-seasonal differencing (d) of X series & 1 \tabularnewline
Degree of seasonal differencing (D) of X series & 0 \tabularnewline
Seasonal Period (s) & 12 \tabularnewline
Box-Cox transformation parameter (lambda) of Y series & 1 \tabularnewline
Degree of non-seasonal differencing (d) of Y series & 1 \tabularnewline
Degree of seasonal differencing (D) of Y series & 0 \tabularnewline
k & rho(Y[t],X[t+k]) \tabularnewline
-16 & -0.0985380541422518 \tabularnewline
-15 & -0.136343243477076 \tabularnewline
-14 & 0.188380575068228 \tabularnewline
-13 & -0.126473020714982 \tabularnewline
-12 & -0.118152538980202 \tabularnewline
-11 & 0.0222341840539868 \tabularnewline
-10 & 0.176824743572314 \tabularnewline
-9 & -0.094662993929660 \tabularnewline
-8 & -0.0652759412436651 \tabularnewline
-7 & 0.177536633742852 \tabularnewline
-6 & -0.0913200822342102 \tabularnewline
-5 & 0.105109239155788 \tabularnewline
-4 & -0.0948809483755107 \tabularnewline
-3 & 0.0764708741441765 \tabularnewline
-2 & -0.0575597877451077 \tabularnewline
-1 & -0.0397455500183393 \tabularnewline
0 & 0.110116530255916 \tabularnewline
1 & -0.0268664236726181 \tabularnewline
2 & 0.103337297816795 \tabularnewline
3 & -0.0926872510309099 \tabularnewline
4 & 0.00809686613449126 \tabularnewline
5 & 0.073610575864539 \tabularnewline
6 & -0.0410914894858976 \tabularnewline
7 & -0.0922442656961614 \tabularnewline
8 & 0.124231203557661 \tabularnewline
9 & -0.120513240380715 \tabularnewline
10 & -0.0617886701100544 \tabularnewline
11 & 0.0779088073713472 \tabularnewline
12 & -0.0185968923277776 \tabularnewline
13 & 0.00419491543832064 \tabularnewline
14 & 0.148068909606120 \tabularnewline
15 & -0.126683898717786 \tabularnewline
16 & 0.0319826919956711 \tabularnewline
\hline
\end{tabular}
%Source: https://freestatistics.org/blog/index.php?pk=27971&T=1

[TABLE]
[ROW][C]Cross Correlation Function[/C][/ROW]
[ROW][C]Parameter[/C][C]Value[/C][/ROW]
[ROW][C]Box-Cox transformation parameter (lambda) of X series[/C][C]1[/C][/ROW]
[ROW][C]Degree of non-seasonal differencing (d) of X series[/C][C]1[/C][/ROW]
[ROW][C]Degree of seasonal differencing (D) of X series[/C][C]0[/C][/ROW]
[ROW][C]Seasonal Period (s)[/C][C]12[/C][/ROW]
[ROW][C]Box-Cox transformation parameter (lambda) of Y series[/C][C]1[/C][/ROW]
[ROW][C]Degree of non-seasonal differencing (d) of Y series[/C][C]1[/C][/ROW]
[ROW][C]Degree of seasonal differencing (D) of Y series[/C][C]0[/C][/ROW]
[ROW][C]k[/C][C]rho(Y[t],X[t+k])[/C][/ROW]
[ROW][C]-16[/C][C]-0.0985380541422518[/C][/ROW]
[ROW][C]-15[/C][C]-0.136343243477076[/C][/ROW]
[ROW][C]-14[/C][C]0.188380575068228[/C][/ROW]
[ROW][C]-13[/C][C]-0.126473020714982[/C][/ROW]
[ROW][C]-12[/C][C]-0.118152538980202[/C][/ROW]
[ROW][C]-11[/C][C]0.0222341840539868[/C][/ROW]
[ROW][C]-10[/C][C]0.176824743572314[/C][/ROW]
[ROW][C]-9[/C][C]-0.094662993929660[/C][/ROW]
[ROW][C]-8[/C][C]-0.0652759412436651[/C][/ROW]
[ROW][C]-7[/C][C]0.177536633742852[/C][/ROW]
[ROW][C]-6[/C][C]-0.0913200822342102[/C][/ROW]
[ROW][C]-5[/C][C]0.105109239155788[/C][/ROW]
[ROW][C]-4[/C][C]-0.0948809483755107[/C][/ROW]
[ROW][C]-3[/C][C]0.0764708741441765[/C][/ROW]
[ROW][C]-2[/C][C]-0.0575597877451077[/C][/ROW]
[ROW][C]-1[/C][C]-0.0397455500183393[/C][/ROW]
[ROW][C]0[/C][C]0.110116530255916[/C][/ROW]
[ROW][C]1[/C][C]-0.0268664236726181[/C][/ROW]
[ROW][C]2[/C][C]0.103337297816795[/C][/ROW]
[ROW][C]3[/C][C]-0.0926872510309099[/C][/ROW]
[ROW][C]4[/C][C]0.00809686613449126[/C][/ROW]
[ROW][C]5[/C][C]0.073610575864539[/C][/ROW]
[ROW][C]6[/C][C]-0.0410914894858976[/C][/ROW]
[ROW][C]7[/C][C]-0.0922442656961614[/C][/ROW]
[ROW][C]8[/C][C]0.124231203557661[/C][/ROW]
[ROW][C]9[/C][C]-0.120513240380715[/C][/ROW]
[ROW][C]10[/C][C]-0.0617886701100544[/C][/ROW]
[ROW][C]11[/C][C]0.0779088073713472[/C][/ROW]
[ROW][C]12[/C][C]-0.0185968923277776[/C][/ROW]
[ROW][C]13[/C][C]0.00419491543832064[/C][/ROW]
[ROW][C]14[/C][C]0.148068909606120[/C][/ROW]
[ROW][C]15[/C][C]-0.126683898717786[/C][/ROW]
[ROW][C]16[/C][C]0.0319826919956711[/C][/ROW]
[/TABLE]
Source: https://freestatistics.org/blog/index.php?pk=27971&T=1

Globally Unique Identifier (entire table): ba.freestatistics.org/blog/index.php?pk=27971&T=1

As an alternative you can also use a QR Code:  

The GUIDs for individual cells are displayed in the table below:

Cross Correlation Function
ParameterValue
Box-Cox transformation parameter (lambda) of X series1
Degree of non-seasonal differencing (d) of X series1
Degree of seasonal differencing (D) of X series0
Seasonal Period (s)12
Box-Cox transformation parameter (lambda) of Y series1
Degree of non-seasonal differencing (d) of Y series1
Degree of seasonal differencing (D) of Y series0
krho(Y[t],X[t+k])
-16-0.0985380541422518
-15-0.136343243477076
-140.188380575068228
-13-0.126473020714982
-12-0.118152538980202
-110.0222341840539868
-100.176824743572314
-9-0.094662993929660
-8-0.0652759412436651
-70.177536633742852
-6-0.0913200822342102
-50.105109239155788
-4-0.0948809483755107
-30.0764708741441765
-2-0.0575597877451077
-1-0.0397455500183393
00.110116530255916
1-0.0268664236726181
20.103337297816795
3-0.0926872510309099
40.00809686613449126
50.073610575864539
6-0.0410914894858976
7-0.0922442656961614
80.124231203557661
9-0.120513240380715
10-0.0617886701100544
110.0779088073713472
12-0.0185968923277776
130.00419491543832064
140.148068909606120
15-0.126683898717786
160.0319826919956711


Parameters (Session):
par1 = 1 ; par2 = 1 ; par3 = 0 ; par4 = 12 ; par5 = 1 ; par6 = 1 ; par7 = 0 ;
Parameters (R input):
par1 = 1 ; par2 = 1 ; par3 = 0 ; par4 = 12 ; par5 = 1 ; par6 = 1 ; par7 = 0 ;
R code (references can be found in the software module):
par1 <- as.numeric(par1)
par2 <- as.numeric(par2)
par3 <- as.numeric(par3)
par4 <- as.numeric(par4)
par5 <- as.numeric(par5)
par6 <- as.numeric(par6)
par7 <- as.numeric(par7)
if (par1 == 0) {
x <- log(x)
} else {
x <- (x ^ par1 - 1) / par1
}
if (par5 == 0) {
y <- log(y)
} else {
y <- (y ^ par5 - 1) / par5
}
if (par2 > 0) x <- diff(x,lag=1,difference=par2)
if (par6 > 0) y <- diff(y,lag=1,difference=par6)
if (par3 > 0) x <- diff(x,lag=par4,difference=par3)
if (par7 > 0) y <- diff(y,lag=par4,difference=par7)
x
y
bitmap(file='test1.png')
(r <- ccf(x,y,main='Cross Correlation Function',ylab='CCF',xlab='Lag (k)'))
dev.off()
load(file='createtable')
a<-table.start()
a<-table.row.start(a)
a<-table.element(a,'Cross Correlation Function',2,TRUE)
a<-table.row.end(a)
a<-table.row.start(a)
a<-table.element(a,'Parameter',header=TRUE)
a<-table.element(a,'Value',header=TRUE)
a<-table.row.end(a)
a<-table.row.start(a)
a<-table.element(a,'Box-Cox transformation parameter (lambda) of X series',header=TRUE)
a<-table.element(a,par1)
a<-table.row.end(a)
a<-table.row.start(a)
a<-table.element(a,'Degree of non-seasonal differencing (d) of X series',header=TRUE)
a<-table.element(a,par2)
a<-table.row.end(a)
a<-table.row.start(a)
a<-table.element(a,'Degree of seasonal differencing (D) of X series',header=TRUE)
a<-table.element(a,par3)
a<-table.row.end(a)
a<-table.row.start(a)
a<-table.element(a,'Seasonal Period (s)',header=TRUE)
a<-table.element(a,par4)
a<-table.row.end(a)
a<-table.row.start(a)
a<-table.element(a,'Box-Cox transformation parameter (lambda) of Y series',header=TRUE)
a<-table.element(a,par5)
a<-table.row.end(a)
a<-table.row.start(a)
a<-table.element(a,'Degree of non-seasonal differencing (d) of Y series',header=TRUE)
a<-table.element(a,par6)
a<-table.row.end(a)
a<-table.row.start(a)
a<-table.element(a,'Degree of seasonal differencing (D) of Y series',header=TRUE)
a<-table.element(a,par7)
a<-table.row.end(a)
a<-table.row.start(a)
a<-table.element(a,'k',header=TRUE)
a<-table.element(a,'rho(Y[t],X[t+k])',header=TRUE)
a<-table.row.end(a)
mylength <- length(r$acf)
myhalf <- floor((mylength-1)/2)
for (i in 1:mylength) {
a<-table.row.start(a)
a<-table.element(a,i-myhalf-1,header=TRUE)
a<-table.element(a,r$acf[i])
a<-table.row.end(a)
}
a<-table.end(a)
table.save(a,file='mytable.tab')