Free Statistics

of Irreproducible Research!

Author's title

Author*Unverified author*
R Software Modulerwasp_cross.wasp
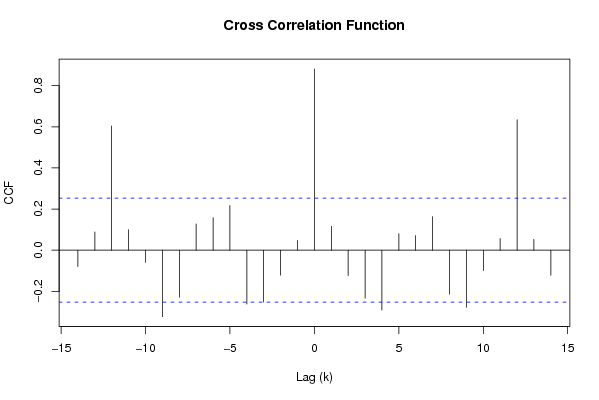
Title produced by softwareCross Correlation Function
Date of computationTue, 02 Dec 2008 08:39:31 -0700
Cite this page as followsStatistical Computations at FreeStatistics.org, Office for Research Development and Education, URL https://freestatistics.org/blog/index.php?v=date/2008/Dec/02/t1228232456642xpw3ntla35xo.htm/, Retrieved Sun, 19 May 2024 09:19:49 +0000
Statistical Computations at FreeStatistics.org, Office for Research Development and Education, URL https://freestatistics.org/blog/index.php?pk=27966, Retrieved Sun, 19 May 2024 09:19:49 +0000
QR Codes:

Original text written by user:
IsPrivate?No (this computation is public)
User-defined keywords
Estimated Impact199
Family? (F = Feedback message, R = changed R code, M = changed R Module, P = changed Parameters, D = changed Data)
F       [Cross Correlation Function] [Stefan Temmerman] [2008-12-02 15:39:31] [30f7cb12a8cb61e43b87da59ece37a2f] [Current]
Feedback Forum
2008-12-06 14:42:08 [Natalie De Wilde] [reply
Cross correlation geeft het verband tussen twee reeksen op dynamische waarden. We voorspellen Y(t) aan de hand van X(t) of het verleden van X(t).
Wanneer k=0 heeft er geen verschuiving in de tijd plaatsgevonden.
Bij k groter dan 0 wordt de toekomstige waarde van X(t) gecorreleerd aan de waarde van Y(t). Bij k kleiner dan 0 wordt de verleden waarde van X(t) gecorreleerd aan de waarde van Y(t).
X(t) is leading indicator voor Y(t), deze geeft op voorhand informatie over andere variabelen.
2008-12-07 10:48:27 [Lana Van Wesemael] [reply
Klopt. De bevindingen van de student kunnen we ook terugvinden in de tabel die de student gegeven heeft bij de k -12 en 12 hebben de correlatie tussen Y(t) en X(t+k) de hoogste waarden.
Wanneer de staafjes binnen het betrouwbaarheidsinterval vallen is de correlatie waarschijnlijk te wijten aan het toeval. Wanneer ze buiten het 95% betrouwbaarheidsinterval vallen, is er wel degelijk sprake van een significante correlatie tussen de variabelen.
2008-12-07 21:13:37 [Stefan Temmerman] [reply
We zien hier voor de meeste periodes terug in de tijd een lage autocorrelatie. Dit wil zeggen dat het verleden van het verloop van de bouw van woongebouwen, geen goede voorspeller is voor de niet-woongebouwen. We nemen ook waar dat er pieken zijn met wel een hoge autocorrelatie, voor k=-12 en k=12. Dit wil zeggen dat de bouwnijverheid een sterke seizoenaliteit kent, en dat de bouw van woongebouwen een sterke voorspeller is van de niet-woongebouwen als het gaat over dezelfde maand.

Post a new message
Dataseries X:
8
-10
-24
-19
8
24
14
7
9
-26
19
15
-1
-10
-21
-14
-27
26
23
5
19
-19
24
17
1
-9
-16
-21
-14
31
27
10
12
-23
13
26
-1
4
-16
-5
9
23
9
2
10
-29
17
9
9
-10
-23
13
13
-9
9
5
8
-18
7
4
Dataseries Y:
-7
-13
-11
-9
8
24
4
7
16
-30
26
19
2
-12
-29
-24
-16
25
22
-7
17
-29
18
15
1
6
-21
-23
-15
24
15
15
14
-25
14
21
13
4
-16
13
20
27
-8
13
12
-25
20
22
16
-12
-13
7
12
-8
12
-13
12
-25
0
18


Summary of computational transaction
Raw Inputview raw input (R code)
Raw Outputview raw output of R engine
Computing time2 seconds
R Server'Sir Ronald Aylmer Fisher' @ 193.190.124.24

\begin{tabular}{lllllllll}
\hline
Summary of computational transaction \tabularnewline
Raw Input & view raw input (R code)  \tabularnewline
Raw Output & view raw output of R engine  \tabularnewline
Computing time & 2 seconds \tabularnewline
R Server & 'Sir Ronald Aylmer Fisher' @ 193.190.124.24 \tabularnewline
\hline
\end{tabular}
%Source: https://freestatistics.org/blog/index.php?pk=27966&T=0

[TABLE]
[ROW][C]Summary of computational transaction[/C][/ROW]
[ROW][C]Raw Input[/C][C]view raw input (R code) [/C][/ROW]
[ROW][C]Raw Output[/C][C]view raw output of R engine [/C][/ROW]
[ROW][C]Computing time[/C][C]2 seconds[/C][/ROW]
[ROW][C]R Server[/C][C]'Sir Ronald Aylmer Fisher' @ 193.190.124.24[/C][/ROW]
[/TABLE]
Source: https://freestatistics.org/blog/index.php?pk=27966&T=0

Globally Unique Identifier (entire table): ba.freestatistics.org/blog/index.php?pk=27966&T=0

As an alternative you can also use a QR Code:  

The GUIDs for individual cells are displayed in the table below:

Summary of computational transaction
Raw Inputview raw input (R code)
Raw Outputview raw output of R engine
Computing time2 seconds
R Server'Sir Ronald Aylmer Fisher' @ 193.190.124.24


Cross Correlation Function
ParameterValue
Box-Cox transformation parameter (lambda) of X series1
Degree of non-seasonal differencing (d) of X series0
Degree of seasonal differencing (D) of X series0
Seasonal Period (s)12
Box-Cox transformation parameter (lambda) of Y series1
Degree of non-seasonal differencing (d) of Y series0
Degree of seasonal differencing (D) of Y series0
krho(Y[t],X[t+k])
-14-0.0793156224711763
-130.0883695262624678
-120.604638507010919
-110.0998048525349143
-10-0.0591470362571001
-9-0.323475447165208
-8-0.229037737741554
-70.12700551810561
-60.158229711856161
-50.216816010918321
-4-0.261661572720504
-3-0.252731712641177
-2-0.121608295579761
-10.0469243609838575
00.88161951203232
10.115834673892973
2-0.123099055755506
3-0.233506292215183
4-0.291454419913765
50.080307294702604
60.0709221786186872
70.162435206944994
8-0.214031564929531
9-0.277442764683199
10-0.0989026733365318
110.0562435597921097
120.634676257545936
130.0524662898825945
14-0.122426740191585

\begin{tabular}{lllllllll}
\hline
Cross Correlation Function \tabularnewline
Parameter & Value \tabularnewline
Box-Cox transformation parameter (lambda) of X series & 1 \tabularnewline
Degree of non-seasonal differencing (d) of X series & 0 \tabularnewline
Degree of seasonal differencing (D) of X series & 0 \tabularnewline
Seasonal Period (s) & 12 \tabularnewline
Box-Cox transformation parameter (lambda) of Y series & 1 \tabularnewline
Degree of non-seasonal differencing (d) of Y series & 0 \tabularnewline
Degree of seasonal differencing (D) of Y series & 0 \tabularnewline
k & rho(Y[t],X[t+k]) \tabularnewline
-14 & -0.0793156224711763 \tabularnewline
-13 & 0.0883695262624678 \tabularnewline
-12 & 0.604638507010919 \tabularnewline
-11 & 0.0998048525349143 \tabularnewline
-10 & -0.0591470362571001 \tabularnewline
-9 & -0.323475447165208 \tabularnewline
-8 & -0.229037737741554 \tabularnewline
-7 & 0.12700551810561 \tabularnewline
-6 & 0.158229711856161 \tabularnewline
-5 & 0.216816010918321 \tabularnewline
-4 & -0.261661572720504 \tabularnewline
-3 & -0.252731712641177 \tabularnewline
-2 & -0.121608295579761 \tabularnewline
-1 & 0.0469243609838575 \tabularnewline
0 & 0.88161951203232 \tabularnewline
1 & 0.115834673892973 \tabularnewline
2 & -0.123099055755506 \tabularnewline
3 & -0.233506292215183 \tabularnewline
4 & -0.291454419913765 \tabularnewline
5 & 0.080307294702604 \tabularnewline
6 & 0.0709221786186872 \tabularnewline
7 & 0.162435206944994 \tabularnewline
8 & -0.214031564929531 \tabularnewline
9 & -0.277442764683199 \tabularnewline
10 & -0.0989026733365318 \tabularnewline
11 & 0.0562435597921097 \tabularnewline
12 & 0.634676257545936 \tabularnewline
13 & 0.0524662898825945 \tabularnewline
14 & -0.122426740191585 \tabularnewline
\hline
\end{tabular}
%Source: https://freestatistics.org/blog/index.php?pk=27966&T=1

[TABLE]
[ROW][C]Cross Correlation Function[/C][/ROW]
[ROW][C]Parameter[/C][C]Value[/C][/ROW]
[ROW][C]Box-Cox transformation parameter (lambda) of X series[/C][C]1[/C][/ROW]
[ROW][C]Degree of non-seasonal differencing (d) of X series[/C][C]0[/C][/ROW]
[ROW][C]Degree of seasonal differencing (D) of X series[/C][C]0[/C][/ROW]
[ROW][C]Seasonal Period (s)[/C][C]12[/C][/ROW]
[ROW][C]Box-Cox transformation parameter (lambda) of Y series[/C][C]1[/C][/ROW]
[ROW][C]Degree of non-seasonal differencing (d) of Y series[/C][C]0[/C][/ROW]
[ROW][C]Degree of seasonal differencing (D) of Y series[/C][C]0[/C][/ROW]
[ROW][C]k[/C][C]rho(Y[t],X[t+k])[/C][/ROW]
[ROW][C]-14[/C][C]-0.0793156224711763[/C][/ROW]
[ROW][C]-13[/C][C]0.0883695262624678[/C][/ROW]
[ROW][C]-12[/C][C]0.604638507010919[/C][/ROW]
[ROW][C]-11[/C][C]0.0998048525349143[/C][/ROW]
[ROW][C]-10[/C][C]-0.0591470362571001[/C][/ROW]
[ROW][C]-9[/C][C]-0.323475447165208[/C][/ROW]
[ROW][C]-8[/C][C]-0.229037737741554[/C][/ROW]
[ROW][C]-7[/C][C]0.12700551810561[/C][/ROW]
[ROW][C]-6[/C][C]0.158229711856161[/C][/ROW]
[ROW][C]-5[/C][C]0.216816010918321[/C][/ROW]
[ROW][C]-4[/C][C]-0.261661572720504[/C][/ROW]
[ROW][C]-3[/C][C]-0.252731712641177[/C][/ROW]
[ROW][C]-2[/C][C]-0.121608295579761[/C][/ROW]
[ROW][C]-1[/C][C]0.0469243609838575[/C][/ROW]
[ROW][C]0[/C][C]0.88161951203232[/C][/ROW]
[ROW][C]1[/C][C]0.115834673892973[/C][/ROW]
[ROW][C]2[/C][C]-0.123099055755506[/C][/ROW]
[ROW][C]3[/C][C]-0.233506292215183[/C][/ROW]
[ROW][C]4[/C][C]-0.291454419913765[/C][/ROW]
[ROW][C]5[/C][C]0.080307294702604[/C][/ROW]
[ROW][C]6[/C][C]0.0709221786186872[/C][/ROW]
[ROW][C]7[/C][C]0.162435206944994[/C][/ROW]
[ROW][C]8[/C][C]-0.214031564929531[/C][/ROW]
[ROW][C]9[/C][C]-0.277442764683199[/C][/ROW]
[ROW][C]10[/C][C]-0.0989026733365318[/C][/ROW]
[ROW][C]11[/C][C]0.0562435597921097[/C][/ROW]
[ROW][C]12[/C][C]0.634676257545936[/C][/ROW]
[ROW][C]13[/C][C]0.0524662898825945[/C][/ROW]
[ROW][C]14[/C][C]-0.122426740191585[/C][/ROW]
[/TABLE]
Source: https://freestatistics.org/blog/index.php?pk=27966&T=1

Globally Unique Identifier (entire table): ba.freestatistics.org/blog/index.php?pk=27966&T=1

As an alternative you can also use a QR Code:  

The GUIDs for individual cells are displayed in the table below:

Cross Correlation Function
ParameterValue
Box-Cox transformation parameter (lambda) of X series1
Degree of non-seasonal differencing (d) of X series0
Degree of seasonal differencing (D) of X series0
Seasonal Period (s)12
Box-Cox transformation parameter (lambda) of Y series1
Degree of non-seasonal differencing (d) of Y series0
Degree of seasonal differencing (D) of Y series0
krho(Y[t],X[t+k])
-14-0.0793156224711763
-130.0883695262624678
-120.604638507010919
-110.0998048525349143
-10-0.0591470362571001
-9-0.323475447165208
-8-0.229037737741554
-70.12700551810561
-60.158229711856161
-50.216816010918321
-4-0.261661572720504
-3-0.252731712641177
-2-0.121608295579761
-10.0469243609838575
00.88161951203232
10.115834673892973
2-0.123099055755506
3-0.233506292215183
4-0.291454419913765
50.080307294702604
60.0709221786186872
70.162435206944994
8-0.214031564929531
9-0.277442764683199
10-0.0989026733365318
110.0562435597921097
120.634676257545936
130.0524662898825945
14-0.122426740191585


Parameters (Session):
par1 = 1 ; par2 = 0 ; par3 = 0 ; par4 = 12 ; par5 = 1 ; par6 = 0 ; par7 = 0 ;
Parameters (R input):
par1 = 1 ; par2 = 0 ; par3 = 0 ; par4 = 12 ; par5 = 1 ; par6 = 0 ; par7 = 0 ;
R code (references can be found in the software module):
par1 <- as.numeric(par1)
par2 <- as.numeric(par2)
par3 <- as.numeric(par3)
par4 <- as.numeric(par4)
par5 <- as.numeric(par5)
par6 <- as.numeric(par6)
par7 <- as.numeric(par7)
if (par1 == 0) {
x <- log(x)
} else {
x <- (x ^ par1 - 1) / par1
}
if (par5 == 0) {
y <- log(y)
} else {
y <- (y ^ par5 - 1) / par5
}
if (par2 > 0) x <- diff(x,lag=1,difference=par2)
if (par6 > 0) y <- diff(y,lag=1,difference=par6)
if (par3 > 0) x <- diff(x,lag=par4,difference=par3)
if (par7 > 0) y <- diff(y,lag=par4,difference=par7)
x
y
bitmap(file='test1.png')
(r <- ccf(x,y,main='Cross Correlation Function',ylab='CCF',xlab='Lag (k)'))
dev.off()
load(file='createtable')
a<-table.start()
a<-table.row.start(a)
a<-table.element(a,'Cross Correlation Function',2,TRUE)
a<-table.row.end(a)
a<-table.row.start(a)
a<-table.element(a,'Parameter',header=TRUE)
a<-table.element(a,'Value',header=TRUE)
a<-table.row.end(a)
a<-table.row.start(a)
a<-table.element(a,'Box-Cox transformation parameter (lambda) of X series',header=TRUE)
a<-table.element(a,par1)
a<-table.row.end(a)
a<-table.row.start(a)
a<-table.element(a,'Degree of non-seasonal differencing (d) of X series',header=TRUE)
a<-table.element(a,par2)
a<-table.row.end(a)
a<-table.row.start(a)
a<-table.element(a,'Degree of seasonal differencing (D) of X series',header=TRUE)
a<-table.element(a,par3)
a<-table.row.end(a)
a<-table.row.start(a)
a<-table.element(a,'Seasonal Period (s)',header=TRUE)
a<-table.element(a,par4)
a<-table.row.end(a)
a<-table.row.start(a)
a<-table.element(a,'Box-Cox transformation parameter (lambda) of Y series',header=TRUE)
a<-table.element(a,par5)
a<-table.row.end(a)
a<-table.row.start(a)
a<-table.element(a,'Degree of non-seasonal differencing (d) of Y series',header=TRUE)
a<-table.element(a,par6)
a<-table.row.end(a)
a<-table.row.start(a)
a<-table.element(a,'Degree of seasonal differencing (D) of Y series',header=TRUE)
a<-table.element(a,par7)
a<-table.row.end(a)
a<-table.row.start(a)
a<-table.element(a,'k',header=TRUE)
a<-table.element(a,'rho(Y[t],X[t+k])',header=TRUE)
a<-table.row.end(a)
mylength <- length(r$acf)
myhalf <- floor((mylength-1)/2)
for (i in 1:mylength) {
a<-table.row.start(a)
a<-table.element(a,i-myhalf-1,header=TRUE)
a<-table.element(a,r$acf[i])
a<-table.row.end(a)
}
a<-table.end(a)
table.save(a,file='mytable.tab')