Free Statistics

of Irreproducible Research!

Author's title

Author*Unverified author*
R Software Modulerwasp_cross.wasp
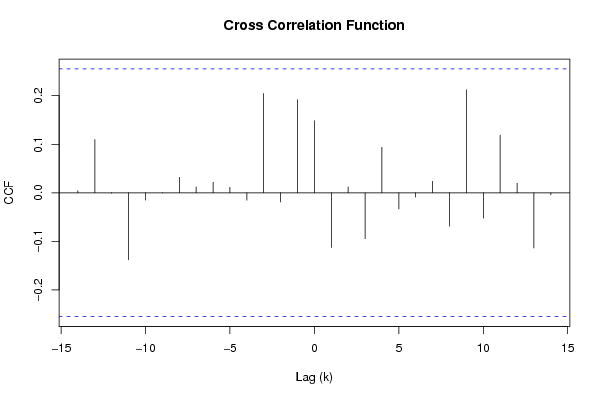
Title produced by softwareCross Correlation Function
Date of computationTue, 02 Dec 2008 08:35:06 -0700
Cite this page as followsStatistical Computations at FreeStatistics.org, Office for Research Development and Education, URL https://freestatistics.org/blog/index.php?v=date/2008/Dec/02/t1228232146en24uu9uytf05kd.htm/, Retrieved Sun, 19 May 2024 08:46:38 +0000
Statistical Computations at FreeStatistics.org, Office for Research Development and Education, URL https://freestatistics.org/blog/index.php?pk=27962, Retrieved Sun, 19 May 2024 08:46:38 +0000
QR Codes:

Original text written by user:
IsPrivate?No (this computation is public)
User-defined keywordsjulie govaerts
Estimated Impact167
Family? (F = Feedback message, R = changed R code, M = changed R Module, P = changed Parameters, D = changed Data)
F       [Cross Correlation Function] [eigen data] [2008-12-02 15:35:06] [02bc582261bca489735616f51251e20c] [Current]
Feedback Forum
2008-12-06 13:54:41 [Thomas Plasschaert] [reply
goede uitwerking en aanpassing van de data set
2008-12-07 12:28:48 [Jolien Van Landeghem] [reply
De correlatie tussen x en y is slechts klein. Dit zie je inderdaad ook aan de Cross correlation function : alle waarden liggen binnen het betrouwbaarheidsinterval : ze verschillen niet significant van 0 en de tijdreeks kan niet verklaard worden adhv de andere tijdreeds. Hier had je ook eventuele schijncorrelatie kunnen nagaan door de correlatie tussen x en y te gaan vergelijken met de gevonden correlatie in Q7.

Post a new message
Dataseries X:
519164
517009
509933
509127
500857
506971
569323
579714
577992
565464
547344
554788
562325
560854
555332
543599
536662
542722
593530
610763
612613
611324
594167
595454
590865
589379
584428
573100
567456
569028
620735
628884
628232
612117
595404
597141
593408
590072
579799
574205
572775
572942
619567
625809
619916
587625
565742
557274
560576
548854
531673
525919
511038
498662
555362
564591
541657
527070
509846
514258
Dataseries Y:
345
334
345
333
336
324
320
330
313
301
288
294
302
294
293
290
283
286
293
334
329
411
416
418
408
402
401
400
389
371
364
350
332
323
316
312
315
314
313
314
317
308
312
306
304
297
284
278
273
265
259
252
245
235
232
229
219
218
215
211


Summary of computational transaction
Raw Inputview raw input (R code)
Raw Outputview raw output of R engine
Computing time2 seconds
R Server'Herman Ole Andreas Wold' @ 193.190.124.10:1001

\begin{tabular}{lllllllll}
\hline
Summary of computational transaction \tabularnewline
Raw Input & view raw input (R code)  \tabularnewline
Raw Output & view raw output of R engine  \tabularnewline
Computing time & 2 seconds \tabularnewline
R Server & 'Herman Ole Andreas Wold' @ 193.190.124.10:1001 \tabularnewline
\hline
\end{tabular}
%Source: https://freestatistics.org/blog/index.php?pk=27962&T=0

[TABLE]
[ROW][C]Summary of computational transaction[/C][/ROW]
[ROW][C]Raw Input[/C][C]view raw input (R code) [/C][/ROW]
[ROW][C]Raw Output[/C][C]view raw output of R engine [/C][/ROW]
[ROW][C]Computing time[/C][C]2 seconds[/C][/ROW]
[ROW][C]R Server[/C][C]'Herman Ole Andreas Wold' @ 193.190.124.10:1001[/C][/ROW]
[/TABLE]
Source: https://freestatistics.org/blog/index.php?pk=27962&T=0

Globally Unique Identifier (entire table): ba.freestatistics.org/blog/index.php?pk=27962&T=0

As an alternative you can also use a QR Code:  

The GUIDs for individual cells are displayed in the table below:

Summary of computational transaction
Raw Inputview raw input (R code)
Raw Outputview raw output of R engine
Computing time2 seconds
R Server'Herman Ole Andreas Wold' @ 193.190.124.10:1001


Cross Correlation Function
ParameterValue
Box-Cox transformation parameter (lambda) of X series1
Degree of non-seasonal differencing (d) of X series1
Degree of seasonal differencing (D) of X series0
Seasonal Period (s)12
Box-Cox transformation parameter (lambda) of Y series1
Degree of non-seasonal differencing (d) of Y series1
Degree of seasonal differencing (D) of Y series0
krho(Y[t],X[t+k])
-140.00447093814786459
-130.10967617743232
-12-0.00069966118484203
-11-0.138140242752314
-10-0.0150724614165474
-90.000241243925744940
-80.0319215247869136
-70.0120095703190204
-60.0214976400724193
-50.0112573638279186
-4-0.0152598116933755
-30.204813613231297
-2-0.0187009020527894
-10.191748434132423
00.148690246792591
1-0.112487975781657
20.0121350150356891
3-0.0944781966749285
40.0938413591227847
5-0.0331549583804172
6-0.00881329674349022
70.0235514294860196
8-0.068719728721961
90.212083919741371
10-0.0521257321882744
110.118693206584261
120.0196466367210879
13-0.113507987516405
14-0.00406245502380129

\begin{tabular}{lllllllll}
\hline
Cross Correlation Function \tabularnewline
Parameter & Value \tabularnewline
Box-Cox transformation parameter (lambda) of X series & 1 \tabularnewline
Degree of non-seasonal differencing (d) of X series & 1 \tabularnewline
Degree of seasonal differencing (D) of X series & 0 \tabularnewline
Seasonal Period (s) & 12 \tabularnewline
Box-Cox transformation parameter (lambda) of Y series & 1 \tabularnewline
Degree of non-seasonal differencing (d) of Y series & 1 \tabularnewline
Degree of seasonal differencing (D) of Y series & 0 \tabularnewline
k & rho(Y[t],X[t+k]) \tabularnewline
-14 & 0.00447093814786459 \tabularnewline
-13 & 0.10967617743232 \tabularnewline
-12 & -0.00069966118484203 \tabularnewline
-11 & -0.138140242752314 \tabularnewline
-10 & -0.0150724614165474 \tabularnewline
-9 & 0.000241243925744940 \tabularnewline
-8 & 0.0319215247869136 \tabularnewline
-7 & 0.0120095703190204 \tabularnewline
-6 & 0.0214976400724193 \tabularnewline
-5 & 0.0112573638279186 \tabularnewline
-4 & -0.0152598116933755 \tabularnewline
-3 & 0.204813613231297 \tabularnewline
-2 & -0.0187009020527894 \tabularnewline
-1 & 0.191748434132423 \tabularnewline
0 & 0.148690246792591 \tabularnewline
1 & -0.112487975781657 \tabularnewline
2 & 0.0121350150356891 \tabularnewline
3 & -0.0944781966749285 \tabularnewline
4 & 0.0938413591227847 \tabularnewline
5 & -0.0331549583804172 \tabularnewline
6 & -0.00881329674349022 \tabularnewline
7 & 0.0235514294860196 \tabularnewline
8 & -0.068719728721961 \tabularnewline
9 & 0.212083919741371 \tabularnewline
10 & -0.0521257321882744 \tabularnewline
11 & 0.118693206584261 \tabularnewline
12 & 0.0196466367210879 \tabularnewline
13 & -0.113507987516405 \tabularnewline
14 & -0.00406245502380129 \tabularnewline
\hline
\end{tabular}
%Source: https://freestatistics.org/blog/index.php?pk=27962&T=1

[TABLE]
[ROW][C]Cross Correlation Function[/C][/ROW]
[ROW][C]Parameter[/C][C]Value[/C][/ROW]
[ROW][C]Box-Cox transformation parameter (lambda) of X series[/C][C]1[/C][/ROW]
[ROW][C]Degree of non-seasonal differencing (d) of X series[/C][C]1[/C][/ROW]
[ROW][C]Degree of seasonal differencing (D) of X series[/C][C]0[/C][/ROW]
[ROW][C]Seasonal Period (s)[/C][C]12[/C][/ROW]
[ROW][C]Box-Cox transformation parameter (lambda) of Y series[/C][C]1[/C][/ROW]
[ROW][C]Degree of non-seasonal differencing (d) of Y series[/C][C]1[/C][/ROW]
[ROW][C]Degree of seasonal differencing (D) of Y series[/C][C]0[/C][/ROW]
[ROW][C]k[/C][C]rho(Y[t],X[t+k])[/C][/ROW]
[ROW][C]-14[/C][C]0.00447093814786459[/C][/ROW]
[ROW][C]-13[/C][C]0.10967617743232[/C][/ROW]
[ROW][C]-12[/C][C]-0.00069966118484203[/C][/ROW]
[ROW][C]-11[/C][C]-0.138140242752314[/C][/ROW]
[ROW][C]-10[/C][C]-0.0150724614165474[/C][/ROW]
[ROW][C]-9[/C][C]0.000241243925744940[/C][/ROW]
[ROW][C]-8[/C][C]0.0319215247869136[/C][/ROW]
[ROW][C]-7[/C][C]0.0120095703190204[/C][/ROW]
[ROW][C]-6[/C][C]0.0214976400724193[/C][/ROW]
[ROW][C]-5[/C][C]0.0112573638279186[/C][/ROW]
[ROW][C]-4[/C][C]-0.0152598116933755[/C][/ROW]
[ROW][C]-3[/C][C]0.204813613231297[/C][/ROW]
[ROW][C]-2[/C][C]-0.0187009020527894[/C][/ROW]
[ROW][C]-1[/C][C]0.191748434132423[/C][/ROW]
[ROW][C]0[/C][C]0.148690246792591[/C][/ROW]
[ROW][C]1[/C][C]-0.112487975781657[/C][/ROW]
[ROW][C]2[/C][C]0.0121350150356891[/C][/ROW]
[ROW][C]3[/C][C]-0.0944781966749285[/C][/ROW]
[ROW][C]4[/C][C]0.0938413591227847[/C][/ROW]
[ROW][C]5[/C][C]-0.0331549583804172[/C][/ROW]
[ROW][C]6[/C][C]-0.00881329674349022[/C][/ROW]
[ROW][C]7[/C][C]0.0235514294860196[/C][/ROW]
[ROW][C]8[/C][C]-0.068719728721961[/C][/ROW]
[ROW][C]9[/C][C]0.212083919741371[/C][/ROW]
[ROW][C]10[/C][C]-0.0521257321882744[/C][/ROW]
[ROW][C]11[/C][C]0.118693206584261[/C][/ROW]
[ROW][C]12[/C][C]0.0196466367210879[/C][/ROW]
[ROW][C]13[/C][C]-0.113507987516405[/C][/ROW]
[ROW][C]14[/C][C]-0.00406245502380129[/C][/ROW]
[/TABLE]
Source: https://freestatistics.org/blog/index.php?pk=27962&T=1

Globally Unique Identifier (entire table): ba.freestatistics.org/blog/index.php?pk=27962&T=1

As an alternative you can also use a QR Code:  

The GUIDs for individual cells are displayed in the table below:

Cross Correlation Function
ParameterValue
Box-Cox transformation parameter (lambda) of X series1
Degree of non-seasonal differencing (d) of X series1
Degree of seasonal differencing (D) of X series0
Seasonal Period (s)12
Box-Cox transformation parameter (lambda) of Y series1
Degree of non-seasonal differencing (d) of Y series1
Degree of seasonal differencing (D) of Y series0
krho(Y[t],X[t+k])
-140.00447093814786459
-130.10967617743232
-12-0.00069966118484203
-11-0.138140242752314
-10-0.0150724614165474
-90.000241243925744940
-80.0319215247869136
-70.0120095703190204
-60.0214976400724193
-50.0112573638279186
-4-0.0152598116933755
-30.204813613231297
-2-0.0187009020527894
-10.191748434132423
00.148690246792591
1-0.112487975781657
20.0121350150356891
3-0.0944781966749285
40.0938413591227847
5-0.0331549583804172
6-0.00881329674349022
70.0235514294860196
8-0.068719728721961
90.212083919741371
10-0.0521257321882744
110.118693206584261
120.0196466367210879
13-0.113507987516405
14-0.00406245502380129


Parameters (Session):
par1 = 1 ; par2 = 1 ; par3 = 0 ; par4 = 12 ; par5 = 1 ; par6 = 1 ; par7 = 0 ;
Parameters (R input):
par1 = 1 ; par2 = 1 ; par3 = 0 ; par4 = 12 ; par5 = 1 ; par6 = 1 ; par7 = 0 ;
R code (references can be found in the software module):
par1 <- as.numeric(par1)
par2 <- as.numeric(par2)
par3 <- as.numeric(par3)
par4 <- as.numeric(par4)
par5 <- as.numeric(par5)
par6 <- as.numeric(par6)
par7 <- as.numeric(par7)
if (par1 == 0) {
x <- log(x)
} else {
x <- (x ^ par1 - 1) / par1
}
if (par5 == 0) {
y <- log(y)
} else {
y <- (y ^ par5 - 1) / par5
}
if (par2 > 0) x <- diff(x,lag=1,difference=par2)
if (par6 > 0) y <- diff(y,lag=1,difference=par6)
if (par3 > 0) x <- diff(x,lag=par4,difference=par3)
if (par7 > 0) y <- diff(y,lag=par4,difference=par7)
x
y
bitmap(file='test1.png')
(r <- ccf(x,y,main='Cross Correlation Function',ylab='CCF',xlab='Lag (k)'))
dev.off()
load(file='createtable')
a<-table.start()
a<-table.row.start(a)
a<-table.element(a,'Cross Correlation Function',2,TRUE)
a<-table.row.end(a)
a<-table.row.start(a)
a<-table.element(a,'Parameter',header=TRUE)
a<-table.element(a,'Value',header=TRUE)
a<-table.row.end(a)
a<-table.row.start(a)
a<-table.element(a,'Box-Cox transformation parameter (lambda) of X series',header=TRUE)
a<-table.element(a,par1)
a<-table.row.end(a)
a<-table.row.start(a)
a<-table.element(a,'Degree of non-seasonal differencing (d) of X series',header=TRUE)
a<-table.element(a,par2)
a<-table.row.end(a)
a<-table.row.start(a)
a<-table.element(a,'Degree of seasonal differencing (D) of X series',header=TRUE)
a<-table.element(a,par3)
a<-table.row.end(a)
a<-table.row.start(a)
a<-table.element(a,'Seasonal Period (s)',header=TRUE)
a<-table.element(a,par4)
a<-table.row.end(a)
a<-table.row.start(a)
a<-table.element(a,'Box-Cox transformation parameter (lambda) of Y series',header=TRUE)
a<-table.element(a,par5)
a<-table.row.end(a)
a<-table.row.start(a)
a<-table.element(a,'Degree of non-seasonal differencing (d) of Y series',header=TRUE)
a<-table.element(a,par6)
a<-table.row.end(a)
a<-table.row.start(a)
a<-table.element(a,'Degree of seasonal differencing (D) of Y series',header=TRUE)
a<-table.element(a,par7)
a<-table.row.end(a)
a<-table.row.start(a)
a<-table.element(a,'k',header=TRUE)
a<-table.element(a,'rho(Y[t],X[t+k])',header=TRUE)
a<-table.row.end(a)
mylength <- length(r$acf)
myhalf <- floor((mylength-1)/2)
for (i in 1:mylength) {
a<-table.row.start(a)
a<-table.element(a,i-myhalf-1,header=TRUE)
a<-table.element(a,r$acf[i])
a<-table.row.end(a)
}
a<-table.end(a)
table.save(a,file='mytable.tab')