Free Statistics

of Irreproducible Research!

Author's title

Author*Unverified author*
R Software Modulerwasp_cross.wasp
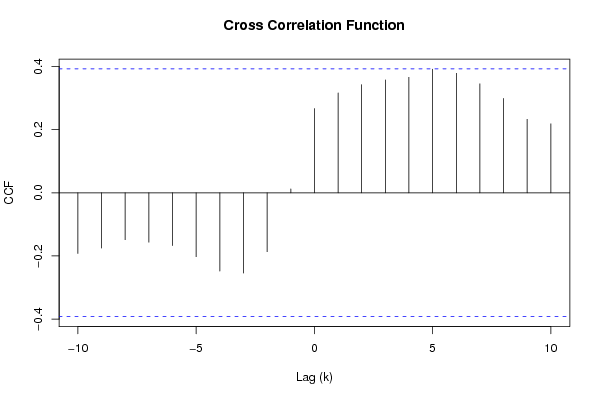
Title produced by softwareCross Correlation Function
Date of computationTue, 02 Dec 2008 08:04:50 -0700
Cite this page as followsStatistical Computations at FreeStatistics.org, Office for Research Development and Education, URL https://freestatistics.org/blog/index.php?v=date/2008/Dec/02/t1228230369fj8xzsvhyhroc5i.htm/, Retrieved Sun, 19 May 2024 10:21:22 +0000
Statistical Computations at FreeStatistics.org, Office for Research Development and Education, URL https://freestatistics.org/blog/index.php?pk=27920, Retrieved Sun, 19 May 2024 10:21:22 +0000
QR Codes:

Original text written by user:
IsPrivate?No (this computation is public)
User-defined keywords
Estimated Impact147
Family? (F = Feedback message, R = changed R code, M = changed R Module, P = changed Parameters, D = changed Data)
F       [Cross Correlation Function] [] [2008-12-02 15:04:50] [626e377fc325feb39b4d1ec8dd6da88c] [Current]
Feedback Forum
2008-12-06 18:28:17 [a2386b643d711541400692649981f2dc] [reply
Je vertelt niet waar x en y voor staan. Ook vertel je niets over de cross correlatie. Bij cross correlatie kijken we naar het verband tussen 2 verschillende reeksen. We gaan na op welke basis we yt kunnen verklaren op de waarde van xt of de vorige waarde van xt. Met andere woorden gaan we kijken of xt een ‘leading indicator’ is. (Of hij op voorhand al informatie gaat geven over yt). Alle lijnen langs de linkerkant van nul, hebben een negatieve k-waarde. Deze k- waarde stelt het verleden van xt voor dat een uitspraak toelaat over yt. Alle lijnen langs de rechterkant van nul, hebben een positieve k-waarde. Deze k-waarde stelt de toekomst van xt voor dat een uitspraak toelaat over yt.
2008-12-08 16:10:35 [Jonas Scheltjens] [reply
De student geeft hier een te beperkt antwoord. De student had best nog vermeld dat de gebruikte methode de correlatie berekend tussen 2 tijdreeksen. De reden waarom we deze methode gebruiken is om na te gaan of het verleden van Xt ons kan helpen om Yt te voorspellen. We kunnen dit fenomeen beschrijven als het verschuiven in de tijd. Als K negatief is vb: K=-9 wil zeggen correlatie tussen Yt en Xt-9, k=-8 is correlatie tussen Yt en Xt-8. Negatieve waarden duiden aan in welke mate kan ik Yt verklaren op basis van het verleden van Xt. Positieve k-waarden worden gebruikt om een antwoord te vinden op de vraag of het verleden van Yt een invloed heeft op Xt. We vinden hier een leading indicator, daar deze op voorhand informatie geeft omtrent verloop van de andere variabele.

Post a new message
Dataseries X:
1.2732
1.2733
1.2734
1.2735
1.2736
1.2737
1.2738
1.2739
1.2740
1.2741
1.2742
1.2743
1.2744
1.2745
1.2746
1.2747
1.2748
1.2749
1.2750
1.2751
1.2752
1.2753
1.2754
1.2755
1.2756
Dataseries Y:
123.28
133.52
153.20
163.63
168.45
166.26
162.31
161.56
156.59
157.97
158.68
163.55
162.89
164.95
159.82
159.05
166.76
164.55
163.22
160.68
155.24
157.60
156.56
154.82
151.11


Summary of computational transaction
Raw Inputview raw input (R code)
Raw Outputview raw output of R engine
Computing time1 seconds
R Server'Gwilym Jenkins' @ 72.249.127.135

\begin{tabular}{lllllllll}
\hline
Summary of computational transaction \tabularnewline
Raw Input & view raw input (R code)  \tabularnewline
Raw Output & view raw output of R engine  \tabularnewline
Computing time & 1 seconds \tabularnewline
R Server & 'Gwilym Jenkins' @ 72.249.127.135 \tabularnewline
\hline
\end{tabular}
%Source: https://freestatistics.org/blog/index.php?pk=27920&T=0

[TABLE]
[ROW][C]Summary of computational transaction[/C][/ROW]
[ROW][C]Raw Input[/C][C]view raw input (R code) [/C][/ROW]
[ROW][C]Raw Output[/C][C]view raw output of R engine [/C][/ROW]
[ROW][C]Computing time[/C][C]1 seconds[/C][/ROW]
[ROW][C]R Server[/C][C]'Gwilym Jenkins' @ 72.249.127.135[/C][/ROW]
[/TABLE]
Source: https://freestatistics.org/blog/index.php?pk=27920&T=0

Globally Unique Identifier (entire table): ba.freestatistics.org/blog/index.php?pk=27920&T=0

As an alternative you can also use a QR Code:  

The GUIDs for individual cells are displayed in the table below:

Summary of computational transaction
Raw Inputview raw input (R code)
Raw Outputview raw output of R engine
Computing time1 seconds
R Server'Gwilym Jenkins' @ 72.249.127.135


Cross Correlation Function
ParameterValue
Box-Cox transformation parameter (lambda) of X series1
Degree of non-seasonal differencing (d) of X series0
Degree of seasonal differencing (D) of X series0
Seasonal Period (s)12
Box-Cox transformation parameter (lambda) of Y series1
Degree of non-seasonal differencing (d) of Y series0
Degree of seasonal differencing (D) of Y series0
krho(Y[t],X[t+k])
-10-0.192012196539133
-9-0.174860262146583
-8-0.148263155562954
-7-0.156151120108621
-6-0.167034585906735
-5-0.202233141266294
-4-0.2475507150344
-3-0.254113637438163
-2-0.186530825627305
-10.0121462196341852
00.266627924333973
10.316243391203414
20.342364841633542
30.357393311055085
40.36549645338449
50.391113934794837
60.378163629758268
70.344912999598787
80.298830978441121
90.232686460237294
100.218252561007650

\begin{tabular}{lllllllll}
\hline
Cross Correlation Function \tabularnewline
Parameter & Value \tabularnewline
Box-Cox transformation parameter (lambda) of X series & 1 \tabularnewline
Degree of non-seasonal differencing (d) of X series & 0 \tabularnewline
Degree of seasonal differencing (D) of X series & 0 \tabularnewline
Seasonal Period (s) & 12 \tabularnewline
Box-Cox transformation parameter (lambda) of Y series & 1 \tabularnewline
Degree of non-seasonal differencing (d) of Y series & 0 \tabularnewline
Degree of seasonal differencing (D) of Y series & 0 \tabularnewline
k & rho(Y[t],X[t+k]) \tabularnewline
-10 & -0.192012196539133 \tabularnewline
-9 & -0.174860262146583 \tabularnewline
-8 & -0.148263155562954 \tabularnewline
-7 & -0.156151120108621 \tabularnewline
-6 & -0.167034585906735 \tabularnewline
-5 & -0.202233141266294 \tabularnewline
-4 & -0.2475507150344 \tabularnewline
-3 & -0.254113637438163 \tabularnewline
-2 & -0.186530825627305 \tabularnewline
-1 & 0.0121462196341852 \tabularnewline
0 & 0.266627924333973 \tabularnewline
1 & 0.316243391203414 \tabularnewline
2 & 0.342364841633542 \tabularnewline
3 & 0.357393311055085 \tabularnewline
4 & 0.36549645338449 \tabularnewline
5 & 0.391113934794837 \tabularnewline
6 & 0.378163629758268 \tabularnewline
7 & 0.344912999598787 \tabularnewline
8 & 0.298830978441121 \tabularnewline
9 & 0.232686460237294 \tabularnewline
10 & 0.218252561007650 \tabularnewline
\hline
\end{tabular}
%Source: https://freestatistics.org/blog/index.php?pk=27920&T=1

[TABLE]
[ROW][C]Cross Correlation Function[/C][/ROW]
[ROW][C]Parameter[/C][C]Value[/C][/ROW]
[ROW][C]Box-Cox transformation parameter (lambda) of X series[/C][C]1[/C][/ROW]
[ROW][C]Degree of non-seasonal differencing (d) of X series[/C][C]0[/C][/ROW]
[ROW][C]Degree of seasonal differencing (D) of X series[/C][C]0[/C][/ROW]
[ROW][C]Seasonal Period (s)[/C][C]12[/C][/ROW]
[ROW][C]Box-Cox transformation parameter (lambda) of Y series[/C][C]1[/C][/ROW]
[ROW][C]Degree of non-seasonal differencing (d) of Y series[/C][C]0[/C][/ROW]
[ROW][C]Degree of seasonal differencing (D) of Y series[/C][C]0[/C][/ROW]
[ROW][C]k[/C][C]rho(Y[t],X[t+k])[/C][/ROW]
[ROW][C]-10[/C][C]-0.192012196539133[/C][/ROW]
[ROW][C]-9[/C][C]-0.174860262146583[/C][/ROW]
[ROW][C]-8[/C][C]-0.148263155562954[/C][/ROW]
[ROW][C]-7[/C][C]-0.156151120108621[/C][/ROW]
[ROW][C]-6[/C][C]-0.167034585906735[/C][/ROW]
[ROW][C]-5[/C][C]-0.202233141266294[/C][/ROW]
[ROW][C]-4[/C][C]-0.2475507150344[/C][/ROW]
[ROW][C]-3[/C][C]-0.254113637438163[/C][/ROW]
[ROW][C]-2[/C][C]-0.186530825627305[/C][/ROW]
[ROW][C]-1[/C][C]0.0121462196341852[/C][/ROW]
[ROW][C]0[/C][C]0.266627924333973[/C][/ROW]
[ROW][C]1[/C][C]0.316243391203414[/C][/ROW]
[ROW][C]2[/C][C]0.342364841633542[/C][/ROW]
[ROW][C]3[/C][C]0.357393311055085[/C][/ROW]
[ROW][C]4[/C][C]0.36549645338449[/C][/ROW]
[ROW][C]5[/C][C]0.391113934794837[/C][/ROW]
[ROW][C]6[/C][C]0.378163629758268[/C][/ROW]
[ROW][C]7[/C][C]0.344912999598787[/C][/ROW]
[ROW][C]8[/C][C]0.298830978441121[/C][/ROW]
[ROW][C]9[/C][C]0.232686460237294[/C][/ROW]
[ROW][C]10[/C][C]0.218252561007650[/C][/ROW]
[/TABLE]
Source: https://freestatistics.org/blog/index.php?pk=27920&T=1

Globally Unique Identifier (entire table): ba.freestatistics.org/blog/index.php?pk=27920&T=1

As an alternative you can also use a QR Code:  

The GUIDs for individual cells are displayed in the table below:

Cross Correlation Function
ParameterValue
Box-Cox transformation parameter (lambda) of X series1
Degree of non-seasonal differencing (d) of X series0
Degree of seasonal differencing (D) of X series0
Seasonal Period (s)12
Box-Cox transformation parameter (lambda) of Y series1
Degree of non-seasonal differencing (d) of Y series0
Degree of seasonal differencing (D) of Y series0
krho(Y[t],X[t+k])
-10-0.192012196539133
-9-0.174860262146583
-8-0.148263155562954
-7-0.156151120108621
-6-0.167034585906735
-5-0.202233141266294
-4-0.2475507150344
-3-0.254113637438163
-2-0.186530825627305
-10.0121462196341852
00.266627924333973
10.316243391203414
20.342364841633542
30.357393311055085
40.36549645338449
50.391113934794837
60.378163629758268
70.344912999598787
80.298830978441121
90.232686460237294
100.218252561007650


Parameters (Session):
par1 = 1 ; par2 = 0 ; par3 = 0 ; par4 = 12 ; par5 = 1 ; par6 = 0 ; par7 = 0 ;
Parameters (R input):
par1 = 1 ; par2 = 0 ; par3 = 0 ; par4 = 12 ; par5 = 1 ; par6 = 0 ; par7 = 0 ;
R code (references can be found in the software module):
par1 <- as.numeric(par1)
par2 <- as.numeric(par2)
par3 <- as.numeric(par3)
par4 <- as.numeric(par4)
par5 <- as.numeric(par5)
par6 <- as.numeric(par6)
par7 <- as.numeric(par7)
if (par1 == 0) {
x <- log(x)
} else {
x <- (x ^ par1 - 1) / par1
}
if (par5 == 0) {
y <- log(y)
} else {
y <- (y ^ par5 - 1) / par5
}
if (par2 > 0) x <- diff(x,lag=1,difference=par2)
if (par6 > 0) y <- diff(y,lag=1,difference=par6)
if (par3 > 0) x <- diff(x,lag=par4,difference=par3)
if (par7 > 0) y <- diff(y,lag=par4,difference=par7)
x
y
bitmap(file='test1.png')
(r <- ccf(x,y,main='Cross Correlation Function',ylab='CCF',xlab='Lag (k)'))
dev.off()
load(file='createtable')
a<-table.start()
a<-table.row.start(a)
a<-table.element(a,'Cross Correlation Function',2,TRUE)
a<-table.row.end(a)
a<-table.row.start(a)
a<-table.element(a,'Parameter',header=TRUE)
a<-table.element(a,'Value',header=TRUE)
a<-table.row.end(a)
a<-table.row.start(a)
a<-table.element(a,'Box-Cox transformation parameter (lambda) of X series',header=TRUE)
a<-table.element(a,par1)
a<-table.row.end(a)
a<-table.row.start(a)
a<-table.element(a,'Degree of non-seasonal differencing (d) of X series',header=TRUE)
a<-table.element(a,par2)
a<-table.row.end(a)
a<-table.row.start(a)
a<-table.element(a,'Degree of seasonal differencing (D) of X series',header=TRUE)
a<-table.element(a,par3)
a<-table.row.end(a)
a<-table.row.start(a)
a<-table.element(a,'Seasonal Period (s)',header=TRUE)
a<-table.element(a,par4)
a<-table.row.end(a)
a<-table.row.start(a)
a<-table.element(a,'Box-Cox transformation parameter (lambda) of Y series',header=TRUE)
a<-table.element(a,par5)
a<-table.row.end(a)
a<-table.row.start(a)
a<-table.element(a,'Degree of non-seasonal differencing (d) of Y series',header=TRUE)
a<-table.element(a,par6)
a<-table.row.end(a)
a<-table.row.start(a)
a<-table.element(a,'Degree of seasonal differencing (D) of Y series',header=TRUE)
a<-table.element(a,par7)
a<-table.row.end(a)
a<-table.row.start(a)
a<-table.element(a,'k',header=TRUE)
a<-table.element(a,'rho(Y[t],X[t+k])',header=TRUE)
a<-table.row.end(a)
mylength <- length(r$acf)
myhalf <- floor((mylength-1)/2)
for (i in 1:mylength) {
a<-table.row.start(a)
a<-table.element(a,i-myhalf-1,header=TRUE)
a<-table.element(a,r$acf[i])
a<-table.row.end(a)
}
a<-table.end(a)
table.save(a,file='mytable.tab')