Free Statistics

of Irreproducible Research!

Author's title

Author*The author of this computation has been verified*
R Software Modulerwasp_cross.wasp
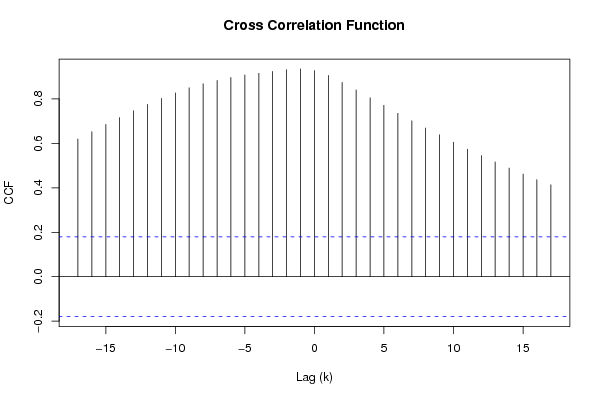
Title produced by softwareCross Correlation Function
Date of computationTue, 02 Dec 2008 07:59:01 -0700
Cite this page as followsStatistical Computations at FreeStatistics.org, Office for Research Development and Education, URL https://freestatistics.org/blog/index.php?v=date/2008/Dec/02/t1228230052jmr8rqtvgbylrnx.htm/, Retrieved Sun, 19 May 2024 10:05:28 +0000
Statistical Computations at FreeStatistics.org, Office for Research Development and Education, URL https://freestatistics.org/blog/index.php?pk=27914, Retrieved Sun, 19 May 2024 10:05:28 +0000
QR Codes:

Original text written by user:
IsPrivate?No (this computation is public)
User-defined keywords
Estimated Impact156
Family? (F = Feedback message, R = changed R code, M = changed R Module, P = changed Parameters, D = changed Data)
F     [Univariate Data Series] [Airline data] [2007-10-18 09:58:47] [42daae401fd3def69a25014f2252b4c2]
F RMPD    [Cross Correlation Function] [question 7] [2008-12-02 14:59:01] [f7fbcd402030df685d3fe4ce577d7846] [Current]
Feedback Forum
2008-12-06 11:54:41 [Glenn Maras] [reply
De gegevens zijn correct ingevoerd en ook correct besproken. De correlatiex liggen allemaal vrij hoog en ik denk ook dar er niet echt seizoenaliteit op te merken is.

Post a new message
Dataseries X:
1.2732
1.3322
1.4369
1.4975
1.5770
1.5553
1.5557
1.5750
1.5527
1.4748
1.4718
1.4570
1.4684
1.4227
1.3896
1.3622
1.3716
1.3419
1.3511
1.3516
1.3242
1.3074
1.2999
1.3213
1.2881
1.2611
1.2727
1.2811
1.2684
1.2650
1.2770
1.2271
1.2020
1.1938
1.2103
1.1856
1.1786
1.2015
1.2256
1.2292
1.2037
1.2165
1.2694
1.2938
1.3201
1.3014
1.3119
1.3408
1.2991
1.2490
1.2218
1.2176
1.2266
1.2138
1.2007
1.1985
1.2262
1.2646
1.2613
1.2286
1.1702
1.1692
1.1222
1.1139
1.1372
1.1663
1.1582
1.0848
1.0807
1.0773
1.0622
1.0183
1.0014
0.9811
0.9808
0.9778
0.9922
0.9554
0.9170
0.8858
0.8758
0.8700
0.8833
0.8924
0.8883
0.9059
0.9111
0.9005
0.8607
0.8532
0.8742
0.8920
0.9095
0.9217
0.9383
0.8973
0.8564
0.8552
0.8721
0.9041
0.9397
0.9492
0.9060
0.9470
0.9643
0.9834
1.0137
1.0110
1.0338
1.0706
1.0501
1.0604
1.0353
1.0378
1.0628
1.0704
1.0883
1.1208
1.1608
Dataseries Y:
123.28
133.52
153.20
163.63
168.45
166.26
162.31
161.56
156.59
157.97
158.68
163.55
162.89
164.95
159.82
159.05
166.76
164.55
163.22
160.68
155.24
157.60
156.56
154.82
151.11
149.65
148.99
148.53
146.70
145.11
142.70
143.59
140.96
140.77
139.81
140.58
139.59
138.05
136.06
135.98
134.75
132.22
135.37
138.84
138.83
136.55
135.63
139.14
136.09
135.97
134.51
134.54
134.08
132.86
134.48
129.08
133.13
134.78
134.13
132.43
127.84
128.12
128.94
132.38
134.99
138.05
135.83
130.12
128.16
128.60
126.12
124.20
121.65
121.57
118.38
116.31
117.11
117.80
115.86
115.81
114.75
116.23
117.12
113.38
108.68
109.86
108.20
109.34
107.21
104.30
106.50
110.36
110.33
107.08
109.57
100.61
93.26
92.74
93.11
97.76
101.39
100.71
98.09
99.92
102.59
107.64
106.53
103.72
108.25
113.52
112.39
120.10
123.71
125.32
129.71
128.16
130.20
130.78
131.35


Summary of computational transaction
Raw Inputview raw input (R code)
Raw Outputview raw output of R engine
Computing time1 seconds
R Server'Gwilym Jenkins' @ 72.249.127.135

\begin{tabular}{lllllllll}
\hline
Summary of computational transaction \tabularnewline
Raw Input & view raw input (R code)  \tabularnewline
Raw Output & view raw output of R engine  \tabularnewline
Computing time & 1 seconds \tabularnewline
R Server & 'Gwilym Jenkins' @ 72.249.127.135 \tabularnewline
\hline
\end{tabular}
%Source: https://freestatistics.org/blog/index.php?pk=27914&T=0

[TABLE]
[ROW][C]Summary of computational transaction[/C][/ROW]
[ROW][C]Raw Input[/C][C]view raw input (R code) [/C][/ROW]
[ROW][C]Raw Output[/C][C]view raw output of R engine [/C][/ROW]
[ROW][C]Computing time[/C][C]1 seconds[/C][/ROW]
[ROW][C]R Server[/C][C]'Gwilym Jenkins' @ 72.249.127.135[/C][/ROW]
[/TABLE]
Source: https://freestatistics.org/blog/index.php?pk=27914&T=0

Globally Unique Identifier (entire table): ba.freestatistics.org/blog/index.php?pk=27914&T=0

As an alternative you can also use a QR Code:  

The GUIDs for individual cells are displayed in the table below:

Summary of computational transaction
Raw Inputview raw input (R code)
Raw Outputview raw output of R engine
Computing time1 seconds
R Server'Gwilym Jenkins' @ 72.249.127.135


Cross Correlation Function
ParameterValue
Box-Cox transformation parameter (lambda) of X series1
Degree of non-seasonal differencing (d) of X series0
Degree of seasonal differencing (D) of X series0
Seasonal Period (s)12
Box-Cox transformation parameter (lambda) of Y series1
Degree of non-seasonal differencing (d) of Y series0
Degree of seasonal differencing (D) of Y series0
krho(Y[t],X[t+k])
-170.61909279086751
-160.65238652374907
-150.684967551222344
-140.715935385750362
-130.746066663293723
-120.774834057011183
-110.8021801361196
-100.826797259634942
-90.849715723839772
-80.867791077546561
-70.883122648199601
-60.896190324870147
-50.907805099833765
-40.915071250228164
-30.923235269029648
-20.931042657925128
-10.93460224915208
00.927595152424474
10.905356361315113
20.873812902853833
30.840034445949221
40.804634357056447
50.770832229742617
60.735256059284331
70.701367299796042
80.668728837505425
90.638103276434305
100.605295849729418
110.573868310467286
120.544696342202708
130.516183799830165
140.488940888429851
150.461655776492095
160.436632864863719
170.413291923749951

\begin{tabular}{lllllllll}
\hline
Cross Correlation Function \tabularnewline
Parameter & Value \tabularnewline
Box-Cox transformation parameter (lambda) of X series & 1 \tabularnewline
Degree of non-seasonal differencing (d) of X series & 0 \tabularnewline
Degree of seasonal differencing (D) of X series & 0 \tabularnewline
Seasonal Period (s) & 12 \tabularnewline
Box-Cox transformation parameter (lambda) of Y series & 1 \tabularnewline
Degree of non-seasonal differencing (d) of Y series & 0 \tabularnewline
Degree of seasonal differencing (D) of Y series & 0 \tabularnewline
k & rho(Y[t],X[t+k]) \tabularnewline
-17 & 0.61909279086751 \tabularnewline
-16 & 0.65238652374907 \tabularnewline
-15 & 0.684967551222344 \tabularnewline
-14 & 0.715935385750362 \tabularnewline
-13 & 0.746066663293723 \tabularnewline
-12 & 0.774834057011183 \tabularnewline
-11 & 0.8021801361196 \tabularnewline
-10 & 0.826797259634942 \tabularnewline
-9 & 0.849715723839772 \tabularnewline
-8 & 0.867791077546561 \tabularnewline
-7 & 0.883122648199601 \tabularnewline
-6 & 0.896190324870147 \tabularnewline
-5 & 0.907805099833765 \tabularnewline
-4 & 0.915071250228164 \tabularnewline
-3 & 0.923235269029648 \tabularnewline
-2 & 0.931042657925128 \tabularnewline
-1 & 0.93460224915208 \tabularnewline
0 & 0.927595152424474 \tabularnewline
1 & 0.905356361315113 \tabularnewline
2 & 0.873812902853833 \tabularnewline
3 & 0.840034445949221 \tabularnewline
4 & 0.804634357056447 \tabularnewline
5 & 0.770832229742617 \tabularnewline
6 & 0.735256059284331 \tabularnewline
7 & 0.701367299796042 \tabularnewline
8 & 0.668728837505425 \tabularnewline
9 & 0.638103276434305 \tabularnewline
10 & 0.605295849729418 \tabularnewline
11 & 0.573868310467286 \tabularnewline
12 & 0.544696342202708 \tabularnewline
13 & 0.516183799830165 \tabularnewline
14 & 0.488940888429851 \tabularnewline
15 & 0.461655776492095 \tabularnewline
16 & 0.436632864863719 \tabularnewline
17 & 0.413291923749951 \tabularnewline
\hline
\end{tabular}
%Source: https://freestatistics.org/blog/index.php?pk=27914&T=1

[TABLE]
[ROW][C]Cross Correlation Function[/C][/ROW]
[ROW][C]Parameter[/C][C]Value[/C][/ROW]
[ROW][C]Box-Cox transformation parameter (lambda) of X series[/C][C]1[/C][/ROW]
[ROW][C]Degree of non-seasonal differencing (d) of X series[/C][C]0[/C][/ROW]
[ROW][C]Degree of seasonal differencing (D) of X series[/C][C]0[/C][/ROW]
[ROW][C]Seasonal Period (s)[/C][C]12[/C][/ROW]
[ROW][C]Box-Cox transformation parameter (lambda) of Y series[/C][C]1[/C][/ROW]
[ROW][C]Degree of non-seasonal differencing (d) of Y series[/C][C]0[/C][/ROW]
[ROW][C]Degree of seasonal differencing (D) of Y series[/C][C]0[/C][/ROW]
[ROW][C]k[/C][C]rho(Y[t],X[t+k])[/C][/ROW]
[ROW][C]-17[/C][C]0.61909279086751[/C][/ROW]
[ROW][C]-16[/C][C]0.65238652374907[/C][/ROW]
[ROW][C]-15[/C][C]0.684967551222344[/C][/ROW]
[ROW][C]-14[/C][C]0.715935385750362[/C][/ROW]
[ROW][C]-13[/C][C]0.746066663293723[/C][/ROW]
[ROW][C]-12[/C][C]0.774834057011183[/C][/ROW]
[ROW][C]-11[/C][C]0.8021801361196[/C][/ROW]
[ROW][C]-10[/C][C]0.826797259634942[/C][/ROW]
[ROW][C]-9[/C][C]0.849715723839772[/C][/ROW]
[ROW][C]-8[/C][C]0.867791077546561[/C][/ROW]
[ROW][C]-7[/C][C]0.883122648199601[/C][/ROW]
[ROW][C]-6[/C][C]0.896190324870147[/C][/ROW]
[ROW][C]-5[/C][C]0.907805099833765[/C][/ROW]
[ROW][C]-4[/C][C]0.915071250228164[/C][/ROW]
[ROW][C]-3[/C][C]0.923235269029648[/C][/ROW]
[ROW][C]-2[/C][C]0.931042657925128[/C][/ROW]
[ROW][C]-1[/C][C]0.93460224915208[/C][/ROW]
[ROW][C]0[/C][C]0.927595152424474[/C][/ROW]
[ROW][C]1[/C][C]0.905356361315113[/C][/ROW]
[ROW][C]2[/C][C]0.873812902853833[/C][/ROW]
[ROW][C]3[/C][C]0.840034445949221[/C][/ROW]
[ROW][C]4[/C][C]0.804634357056447[/C][/ROW]
[ROW][C]5[/C][C]0.770832229742617[/C][/ROW]
[ROW][C]6[/C][C]0.735256059284331[/C][/ROW]
[ROW][C]7[/C][C]0.701367299796042[/C][/ROW]
[ROW][C]8[/C][C]0.668728837505425[/C][/ROW]
[ROW][C]9[/C][C]0.638103276434305[/C][/ROW]
[ROW][C]10[/C][C]0.605295849729418[/C][/ROW]
[ROW][C]11[/C][C]0.573868310467286[/C][/ROW]
[ROW][C]12[/C][C]0.544696342202708[/C][/ROW]
[ROW][C]13[/C][C]0.516183799830165[/C][/ROW]
[ROW][C]14[/C][C]0.488940888429851[/C][/ROW]
[ROW][C]15[/C][C]0.461655776492095[/C][/ROW]
[ROW][C]16[/C][C]0.436632864863719[/C][/ROW]
[ROW][C]17[/C][C]0.413291923749951[/C][/ROW]
[/TABLE]
Source: https://freestatistics.org/blog/index.php?pk=27914&T=1

Globally Unique Identifier (entire table): ba.freestatistics.org/blog/index.php?pk=27914&T=1

As an alternative you can also use a QR Code:  

The GUIDs for individual cells are displayed in the table below:

Cross Correlation Function
ParameterValue
Box-Cox transformation parameter (lambda) of X series1
Degree of non-seasonal differencing (d) of X series0
Degree of seasonal differencing (D) of X series0
Seasonal Period (s)12
Box-Cox transformation parameter (lambda) of Y series1
Degree of non-seasonal differencing (d) of Y series0
Degree of seasonal differencing (D) of Y series0
krho(Y[t],X[t+k])
-170.61909279086751
-160.65238652374907
-150.684967551222344
-140.715935385750362
-130.746066663293723
-120.774834057011183
-110.8021801361196
-100.826797259634942
-90.849715723839772
-80.867791077546561
-70.883122648199601
-60.896190324870147
-50.907805099833765
-40.915071250228164
-30.923235269029648
-20.931042657925128
-10.93460224915208
00.927595152424474
10.905356361315113
20.873812902853833
30.840034445949221
40.804634357056447
50.770832229742617
60.735256059284331
70.701367299796042
80.668728837505425
90.638103276434305
100.605295849729418
110.573868310467286
120.544696342202708
130.516183799830165
140.488940888429851
150.461655776492095
160.436632864863719
170.413291923749951


Parameters (Session):
par1 = 1 ; par2 = 0 ; par3 = 0 ; par4 = 12 ; par5 = 1 ; par6 = 0 ; par7 = 0 ;
Parameters (R input):
par1 = 1 ; par2 = 0 ; par3 = 0 ; par4 = 12 ; par5 = 1 ; par6 = 0 ; par7 = 0 ;
R code (references can be found in the software module):
par1 <- as.numeric(par1)
par2 <- as.numeric(par2)
par3 <- as.numeric(par3)
par4 <- as.numeric(par4)
par5 <- as.numeric(par5)
par6 <- as.numeric(par6)
par7 <- as.numeric(par7)
if (par1 == 0) {
x <- log(x)
} else {
x <- (x ^ par1 - 1) / par1
}
if (par5 == 0) {
y <- log(y)
} else {
y <- (y ^ par5 - 1) / par5
}
if (par2 > 0) x <- diff(x,lag=1,difference=par2)
if (par6 > 0) y <- diff(y,lag=1,difference=par6)
if (par3 > 0) x <- diff(x,lag=par4,difference=par3)
if (par7 > 0) y <- diff(y,lag=par4,difference=par7)
x
y
bitmap(file='test1.png')
(r <- ccf(x,y,main='Cross Correlation Function',ylab='CCF',xlab='Lag (k)'))
dev.off()
load(file='createtable')
a<-table.start()
a<-table.row.start(a)
a<-table.element(a,'Cross Correlation Function',2,TRUE)
a<-table.row.end(a)
a<-table.row.start(a)
a<-table.element(a,'Parameter',header=TRUE)
a<-table.element(a,'Value',header=TRUE)
a<-table.row.end(a)
a<-table.row.start(a)
a<-table.element(a,'Box-Cox transformation parameter (lambda) of X series',header=TRUE)
a<-table.element(a,par1)
a<-table.row.end(a)
a<-table.row.start(a)
a<-table.element(a,'Degree of non-seasonal differencing (d) of X series',header=TRUE)
a<-table.element(a,par2)
a<-table.row.end(a)
a<-table.row.start(a)
a<-table.element(a,'Degree of seasonal differencing (D) of X series',header=TRUE)
a<-table.element(a,par3)
a<-table.row.end(a)
a<-table.row.start(a)
a<-table.element(a,'Seasonal Period (s)',header=TRUE)
a<-table.element(a,par4)
a<-table.row.end(a)
a<-table.row.start(a)
a<-table.element(a,'Box-Cox transformation parameter (lambda) of Y series',header=TRUE)
a<-table.element(a,par5)
a<-table.row.end(a)
a<-table.row.start(a)
a<-table.element(a,'Degree of non-seasonal differencing (d) of Y series',header=TRUE)
a<-table.element(a,par6)
a<-table.row.end(a)
a<-table.row.start(a)
a<-table.element(a,'Degree of seasonal differencing (D) of Y series',header=TRUE)
a<-table.element(a,par7)
a<-table.row.end(a)
a<-table.row.start(a)
a<-table.element(a,'k',header=TRUE)
a<-table.element(a,'rho(Y[t],X[t+k])',header=TRUE)
a<-table.row.end(a)
mylength <- length(r$acf)
myhalf <- floor((mylength-1)/2)
for (i in 1:mylength) {
a<-table.row.start(a)
a<-table.element(a,i-myhalf-1,header=TRUE)
a<-table.element(a,r$acf[i])
a<-table.row.end(a)
}
a<-table.end(a)
table.save(a,file='mytable.tab')