Free Statistics

of Irreproducible Research!

Author's title

Author*Unverified author*
R Software Modulerwasp_smp.wasp
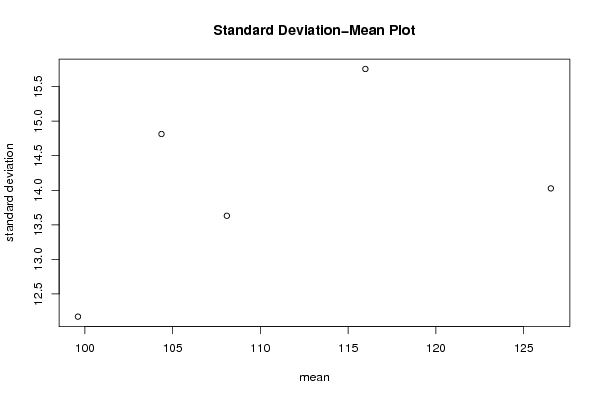
Title produced by softwareStandard Deviation-Mean Plot
Date of computationTue, 02 Dec 2008 07:58:33 -0700
Cite this page as followsStatistical Computations at FreeStatistics.org, Office for Research Development and Education, URL https://freestatistics.org/blog/index.php?v=date/2008/Dec/02/t1228230010i0ldj1e6e15xf5m.htm/, Retrieved Sun, 19 May 2024 10:46:42 +0000
Statistical Computations at FreeStatistics.org, Office for Research Development and Education, URL https://freestatistics.org/blog/index.php?pk=27912, Retrieved Sun, 19 May 2024 10:46:42 +0000
QR Codes:

Original text written by user:
IsPrivate?No (this computation is public)
User-defined keywords
Estimated Impact186
Family? (F = Feedback message, R = changed R code, M = changed R Module, P = changed Parameters, D = changed Data)
F     [Cross Correlation Function] [Non-stationary ti...] [2008-12-02 14:37:27] [6c955a33a02d5e30e404487434e7a5c9]
F RMPD    [Standard Deviation-Mean Plot] [non stationary ti...] [2008-12-02 14:58:33] [a57a97ff9690154d18ed2c72b6ae351a] [Current]
F    D      [Standard Deviation-Mean Plot] [non stationary ti...] [2008-12-02 15:02:16] [6c955a33a02d5e30e404487434e7a5c9]
F RM D        [Variance Reduction Matrix] [non stationary ti...] [2008-12-02 15:05:11] [6c955a33a02d5e30e404487434e7a5c9]
F RM D        [Variance Reduction Matrix] [non stationary ti...] [2008-12-02 15:09:02] [6c955a33a02d5e30e404487434e7a5c9]
Feedback Forum
2008-12-04 11:00:22 [Steven Vercammen] [reply
Dit klopt.
Dit is wat er in de theorie te vinden is over de Standard Deviation-Mean Plot:

1)“The SMP is often used to identify the quasi-optimal Box-Cox transformation parameter that induces stationarity of the variance. “

2)To achieve a constant variance over time a variance stabilizing transformation has to be applied to the measurements. The range of variance stabilizing transformations that can be used is very wide. However for most of the practical situations the power transformation has been found of considerable value. This transformation is given by : G(Zt)= Zt ^ lambda when lambda is not 0 and ln Zt when lambda is 0.

De optimale lambda om een transformatie uit te voeren blijkt hier 0.49 te zijn. Wanneer deze transformatie wordt toegepast zal de variantie stationair worden.

2008-12-07 10:06:17 [Käthe Vanderheggen] [reply
Zowel voor X als Y is dit een goede wijze.
2008-12-08 18:55:49 [Koen Van Baelen] [reply
Correct, hier valt niks aan toe te voegen

Post a new message
Dataseries X:
93,4
101,5
110,4
105,9
108,4
113,9
86,1
69,4
101,2
100,5
98,0
106,6
90,1
96,9
125,9
112,0
100,0
123,9
79,8
83,4
113,6
112,9
104,0
109,9
99,0
106,3
128,9
111,1
102,9
130,0
87,0
87,5
117,6
103,4
110,8
112,6
102,5
112,4
135,6
105,1
127,7
137,0
91,0
90,5
122,4
123,3
124,3
120,0
118,1
119,0
142,7
123,6
129,6
151,6
110,4
99,2
130,5
136,2
129,7
128,0
121,6
135,8
143,8
147,5
136,2
156,6
123,3
104,5
143,6


Summary of computational transaction
Raw Inputview raw input (R code)
Raw Outputview raw output of R engine
Computing time1 seconds
R Server'Gwilym Jenkins' @ 72.249.127.135

\begin{tabular}{lllllllll}
\hline
Summary of computational transaction \tabularnewline
Raw Input & view raw input (R code)  \tabularnewline
Raw Output & view raw output of R engine  \tabularnewline
Computing time & 1 seconds \tabularnewline
R Server & 'Gwilym Jenkins' @ 72.249.127.135 \tabularnewline
\hline
\end{tabular}
%Source: https://freestatistics.org/blog/index.php?pk=27912&T=0

[TABLE]
[ROW][C]Summary of computational transaction[/C][/ROW]
[ROW][C]Raw Input[/C][C]view raw input (R code) [/C][/ROW]
[ROW][C]Raw Output[/C][C]view raw output of R engine [/C][/ROW]
[ROW][C]Computing time[/C][C]1 seconds[/C][/ROW]
[ROW][C]R Server[/C][C]'Gwilym Jenkins' @ 72.249.127.135[/C][/ROW]
[/TABLE]
Source: https://freestatistics.org/blog/index.php?pk=27912&T=0

Globally Unique Identifier (entire table): ba.freestatistics.org/blog/index.php?pk=27912&T=0

As an alternative you can also use a QR Code:  

The GUIDs for individual cells are displayed in the table below:

Summary of computational transaction
Raw Inputview raw input (R code)
Raw Outputview raw output of R engine
Computing time1 seconds
R Server'Gwilym Jenkins' @ 72.249.127.135


Standard Deviation-Mean Plot
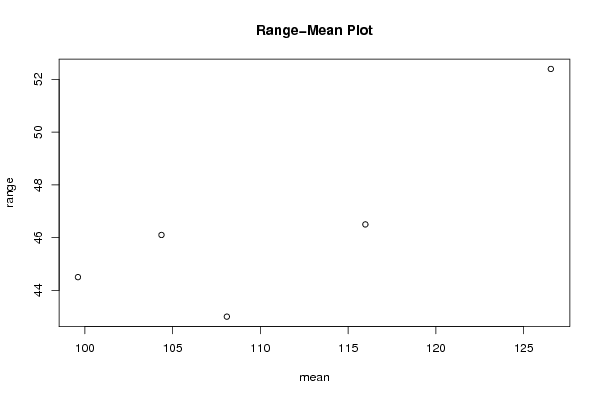
SectionMeanStandard DeviationRange
199.608333333333312.171237207100844.5
2104.36666666666714.813405067605846.1
3108.09166666666713.630811243338243
4115.98333333333315.755104992774046.5
5126.5514.027019381439352.4

\begin{tabular}{lllllllll}
\hline
Standard Deviation-Mean Plot \tabularnewline
Section & Mean & Standard Deviation & Range \tabularnewline
1 & 99.6083333333333 & 12.1712372071008 & 44.5 \tabularnewline
2 & 104.366666666667 & 14.8134050676058 & 46.1 \tabularnewline
3 & 108.091666666667 & 13.6308112433382 & 43 \tabularnewline
4 & 115.983333333333 & 15.7551049927740 & 46.5 \tabularnewline
5 & 126.55 & 14.0270193814393 & 52.4 \tabularnewline
\hline
\end{tabular}
%Source: https://freestatistics.org/blog/index.php?pk=27912&T=1

[TABLE]
[ROW][C]Standard Deviation-Mean Plot[/C][/ROW]
[ROW][C]Section[/C][C]Mean[/C][C]Standard Deviation[/C][C]Range[/C][/ROW]
[ROW][C]1[/C][C]99.6083333333333[/C][C]12.1712372071008[/C][C]44.5[/C][/ROW]
[ROW][C]2[/C][C]104.366666666667[/C][C]14.8134050676058[/C][C]46.1[/C][/ROW]
[ROW][C]3[/C][C]108.091666666667[/C][C]13.6308112433382[/C][C]43[/C][/ROW]
[ROW][C]4[/C][C]115.983333333333[/C][C]15.7551049927740[/C][C]46.5[/C][/ROW]
[ROW][C]5[/C][C]126.55[/C][C]14.0270193814393[/C][C]52.4[/C][/ROW]
[/TABLE]
Source: https://freestatistics.org/blog/index.php?pk=27912&T=1

Globally Unique Identifier (entire table): ba.freestatistics.org/blog/index.php?pk=27912&T=1

As an alternative you can also use a QR Code:  

The GUIDs for individual cells are displayed in the table below:

Standard Deviation-Mean Plot
SectionMeanStandard DeviationRange
199.608333333333312.171237207100844.5
2104.36666666666714.813405067605846.1
3108.09166666666713.630811243338243
4115.98333333333315.755104992774046.5
5126.5514.027019381439352.4


Regression: S.E.(k) = alpha + beta * Mean(k)
alpha7.72605999615192
beta0.0572796211891426
S.D.0.0651725333601848
T-STAT0.878892046018513
p-value0.444167458320269

\begin{tabular}{lllllllll}
\hline
Regression: S.E.(k) = alpha + beta * Mean(k) \tabularnewline
alpha & 7.72605999615192 \tabularnewline
beta & 0.0572796211891426 \tabularnewline
S.D. & 0.0651725333601848 \tabularnewline
T-STAT & 0.878892046018513 \tabularnewline
p-value & 0.444167458320269 \tabularnewline
\hline
\end{tabular}
%Source: https://freestatistics.org/blog/index.php?pk=27912&T=2

[TABLE]
[ROW][C]Regression: S.E.(k) = alpha + beta * Mean(k)[/C][/ROW]
[ROW][C]alpha[/C][C]7.72605999615192[/C][/ROW]
[ROW][C]beta[/C][C]0.0572796211891426[/C][/ROW]
[ROW][C]S.D.[/C][C]0.0651725333601848[/C][/ROW]
[ROW][C]T-STAT[/C][C]0.878892046018513[/C][/ROW]
[ROW][C]p-value[/C][C]0.444167458320269[/C][/ROW]
[/TABLE]
Source: https://freestatistics.org/blog/index.php?pk=27912&T=2

Globally Unique Identifier (entire table): ba.freestatistics.org/blog/index.php?pk=27912&T=2

As an alternative you can also use a QR Code:  

The GUIDs for individual cells are displayed in the table below:

Regression: S.E.(k) = alpha + beta * Mean(k)
alpha7.72605999615192
beta0.0572796211891426
S.D.0.0651725333601848
T-STAT0.878892046018513
p-value0.444167458320269


Regression: ln S.E.(k) = alpha + beta * ln Mean(k)
alpha0.256048455902402
beta0.506874820305337
S.D.0.517972675291591
T-STAT0.97857443931766
p-value0.399956859141921
Lambda0.493125179694663

\begin{tabular}{lllllllll}
\hline
Regression: ln S.E.(k) = alpha + beta * ln Mean(k) \tabularnewline
alpha & 0.256048455902402 \tabularnewline
beta & 0.506874820305337 \tabularnewline
S.D. & 0.517972675291591 \tabularnewline
T-STAT & 0.97857443931766 \tabularnewline
p-value & 0.399956859141921 \tabularnewline
Lambda & 0.493125179694663 \tabularnewline
\hline
\end{tabular}
%Source: https://freestatistics.org/blog/index.php?pk=27912&T=3

[TABLE]
[ROW][C]Regression: ln S.E.(k) = alpha + beta * ln Mean(k)[/C][/ROW]
[ROW][C]alpha[/C][C]0.256048455902402[/C][/ROW]
[ROW][C]beta[/C][C]0.506874820305337[/C][/ROW]
[ROW][C]S.D.[/C][C]0.517972675291591[/C][/ROW]
[ROW][C]T-STAT[/C][C]0.97857443931766[/C][/ROW]
[ROW][C]p-value[/C][C]0.399956859141921[/C][/ROW]
[ROW][C]Lambda[/C][C]0.493125179694663[/C][/ROW]
[/TABLE]
Source: https://freestatistics.org/blog/index.php?pk=27912&T=3

Globally Unique Identifier (entire table): ba.freestatistics.org/blog/index.php?pk=27912&T=3

As an alternative you can also use a QR Code:  

The GUIDs for individual cells are displayed in the table below:

Regression: ln S.E.(k) = alpha + beta * ln Mean(k)
alpha0.256048455902402
beta0.506874820305337
S.D.0.517972675291591
T-STAT0.97857443931766
p-value0.399956859141921
Lambda0.493125179694663


Parameters (Session):
par1 = 12 ;
Parameters (R input):
par1 = 12 ;
R code (references can be found in the software module):
par1 <- as.numeric(par1)
(n <- length(x))
(np <- floor(n / par1))
arr <- array(NA,dim=c(par1,np))
j <- 0
k <- 1
for (i in 1:(np*par1))
{
j = j + 1
arr[j,k] <- x[i]
if (j == par1) {
j = 0
k=k+1
}
}
arr
arr.mean <- array(NA,dim=np)
arr.sd <- array(NA,dim=np)
arr.range <- array(NA,dim=np)
for (j in 1:np)
{
arr.mean[j] <- mean(arr[,j],na.rm=TRUE)
arr.sd[j] <- sd(arr[,j],na.rm=TRUE)
arr.range[j] <- max(arr[,j],na.rm=TRUE) - min(arr[,j],na.rm=TRUE)
}
arr.mean
arr.sd
arr.range
(lm1 <- lm(arr.sd~arr.mean))
(lnlm1 <- lm(log(arr.sd)~log(arr.mean)))
(lm2 <- lm(arr.range~arr.mean))
bitmap(file='test1.png')
plot(arr.mean,arr.sd,main='Standard Deviation-Mean Plot',xlab='mean',ylab='standard deviation')
dev.off()
bitmap(file='test2.png')
plot(arr.mean,arr.range,main='Range-Mean Plot',xlab='mean',ylab='range')
dev.off()
load(file='createtable')
a<-table.start()
a<-table.row.start(a)
a<-table.element(a,'Standard Deviation-Mean Plot',4,TRUE)
a<-table.row.end(a)
a<-table.row.start(a)
a<-table.element(a,'Section',header=TRUE)
a<-table.element(a,'Mean',header=TRUE)
a<-table.element(a,'Standard Deviation',header=TRUE)
a<-table.element(a,'Range',header=TRUE)
a<-table.row.end(a)
for (j in 1:np) {
a<-table.row.start(a)
a<-table.element(a,j,header=TRUE)
a<-table.element(a,arr.mean[j])
a<-table.element(a,arr.sd[j] )
a<-table.element(a,arr.range[j] )
a<-table.row.end(a)
}
a<-table.end(a)
table.save(a,file='mytable.tab')
a<-table.start()
a<-table.row.start(a)
a<-table.element(a,'Regression: S.E.(k) = alpha + beta * Mean(k)',2,TRUE)
a<-table.row.end(a)
a<-table.row.start(a)
a<-table.element(a,'alpha',header=TRUE)
a<-table.element(a,lm1$coefficients[[1]])
a<-table.row.end(a)
a<-table.row.start(a)
a<-table.element(a,'beta',header=TRUE)
a<-table.element(a,lm1$coefficients[[2]])
a<-table.row.end(a)
a<-table.row.start(a)
a<-table.element(a,'S.D.',header=TRUE)
a<-table.element(a,summary(lm1)$coefficients[2,2])
a<-table.row.end(a)
a<-table.row.start(a)
a<-table.element(a,'T-STAT',header=TRUE)
a<-table.element(a,summary(lm1)$coefficients[2,3])
a<-table.row.end(a)
a<-table.row.start(a)
a<-table.element(a,'p-value',header=TRUE)
a<-table.element(a,summary(lm1)$coefficients[2,4])
a<-table.row.end(a)
a<-table.end(a)
table.save(a,file='mytable1.tab')
a<-table.start()
a<-table.row.start(a)
a<-table.element(a,'Regression: ln S.E.(k) = alpha + beta * ln Mean(k)',2,TRUE)
a<-table.row.end(a)
a<-table.row.start(a)
a<-table.element(a,'alpha',header=TRUE)
a<-table.element(a,lnlm1$coefficients[[1]])
a<-table.row.end(a)
a<-table.row.start(a)
a<-table.element(a,'beta',header=TRUE)
a<-table.element(a,lnlm1$coefficients[[2]])
a<-table.row.end(a)
a<-table.row.start(a)
a<-table.element(a,'S.D.',header=TRUE)
a<-table.element(a,summary(lnlm1)$coefficients[2,2])
a<-table.row.end(a)
a<-table.row.start(a)
a<-table.element(a,'T-STAT',header=TRUE)
a<-table.element(a,summary(lnlm1)$coefficients[2,3])
a<-table.row.end(a)
a<-table.row.start(a)
a<-table.element(a,'p-value',header=TRUE)
a<-table.element(a,summary(lnlm1)$coefficients[2,4])
a<-table.row.end(a)
a<-table.row.start(a)
a<-table.element(a,'Lambda',header=TRUE)
a<-table.element(a,1-lnlm1$coefficients[[2]])
a<-table.row.end(a)
a<-table.end(a)
table.save(a,file='mytable2.tab')