Free Statistics

of Irreproducible Research!

Author's title

Author*Unverified author*
R Software Modulerwasp_cross.wasp
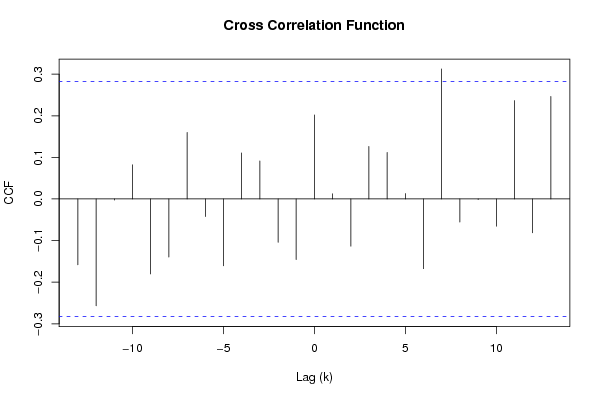
Title produced by softwareCross Correlation Function
Date of computationTue, 02 Dec 2008 07:55:42 -0700
Cite this page as followsStatistical Computations at FreeStatistics.org, Office for Research Development and Education, URL https://freestatistics.org/blog/index.php?v=date/2008/Dec/02/t12282297716k9062a75tx6iuf.htm/, Retrieved Sun, 19 May 2024 10:45:29 +0000
Statistical Computations at FreeStatistics.org, Office for Research Development and Education, URL https://freestatistics.org/blog/index.php?pk=27900, Retrieved Sun, 19 May 2024 10:45:29 +0000
QR Codes:

Original text written by user:
IsPrivate?No (this computation is public)
User-defined keywordskleuter
Estimated Impact167
Family? (F = Feedback message, R = changed R code, M = changed R Module, P = changed Parameters, D = changed Data)
F     [Law of Averages] [Random Walk Simul...] [2008-11-25 17:50:19] [b98453cac15ba1066b407e146608df68]
F RMPD    [Cross Correlation Function] [] [2008-12-02 14:55:42] [c233791e22ae82ed03fa45b0d63a2757] [Current]
Feedback Forum
2008-12-06 11:19:17 [Käthe Vanderheggen] [reply
De correlatie schommelt rond 0 en er is geen duidelijke trend meer. De parameters werden dus juist gekozen.

Post a new message
Dataseries X:
569
580
578
565
547
555
562
561
555
544
537
543
594
611
613
611
594
595
591
589
584
573
567
569
621
629
628
612
595
597
593
590
580
574
573
573
620
626
620
588
566
557
561
549
532
526
511
499
555
565
542
527
510
514
517
508
493
490
469
478
528
Dataseries Y:
104.3
119.8
116.8
118.2
107.4
110.8
94.8
96.5
113.4
109.8
118.7
117.2
110.3
111.6
128.1
121.3
107.3
120.5
98.5
97.7
113.2
114.6
118.3
123.9
113.6
117.5
130.1
124.7
114.2
127.3
105.9
101.5
120.2
117.1
131.1
130
120.6
123.1
135.3
134.1
123.7
134.6
108.3
110.4
127.8
126.6
131.4
141.1
127
127.3
143.6
149.4
126.6
136.5
116
118
131.4
140.7
144.9
143.9
127.1


Summary of computational transaction
Raw Inputview raw input (R code)
Raw Outputview raw output of R engine
Computing time1 seconds
R Server'George Udny Yule' @ 72.249.76.132

\begin{tabular}{lllllllll}
\hline
Summary of computational transaction \tabularnewline
Raw Input & view raw input (R code)  \tabularnewline
Raw Output & view raw output of R engine  \tabularnewline
Computing time & 1 seconds \tabularnewline
R Server & 'George Udny Yule' @ 72.249.76.132 \tabularnewline
\hline
\end{tabular}
%Source: https://freestatistics.org/blog/index.php?pk=27900&T=0

[TABLE]
[ROW][C]Summary of computational transaction[/C][/ROW]
[ROW][C]Raw Input[/C][C]view raw input (R code) [/C][/ROW]
[ROW][C]Raw Output[/C][C]view raw output of R engine [/C][/ROW]
[ROW][C]Computing time[/C][C]1 seconds[/C][/ROW]
[ROW][C]R Server[/C][C]'George Udny Yule' @ 72.249.76.132[/C][/ROW]
[/TABLE]
Source: https://freestatistics.org/blog/index.php?pk=27900&T=0

Globally Unique Identifier (entire table): ba.freestatistics.org/blog/index.php?pk=27900&T=0

As an alternative you can also use a QR Code:  

The GUIDs for individual cells are displayed in the table below:

Summary of computational transaction
Raw Inputview raw input (R code)
Raw Outputview raw output of R engine
Computing time1 seconds
R Server'George Udny Yule' @ 72.249.76.132


Cross Correlation Function
ParameterValue
Box-Cox transformation parameter (lambda) of X series1
Degree of non-seasonal differencing (d) of X series1
Degree of seasonal differencing (D) of X series1
Seasonal Period (s)12
Box-Cox transformation parameter (lambda) of Y series1
Degree of non-seasonal differencing (d) of Y series0
Degree of seasonal differencing (D) of Y series1
krho(Y[t],X[t+k])
-13-0.158156437857964
-12-0.256987004905416
-11-0.00260864932289934
-100.0822235457024163
-9-0.180133611693876
-8-0.139759084183843
-70.159973794071263
-6-0.0423042017420899
-5-0.160693304988424
-40.110770901387521
-30.0913398841422665
-2-0.104097690979768
-1-0.145564996807647
00.202071094199850
10.0125652616624857
2-0.113436131967990
30.126256431537732
40.111997110133668
50.0130989833756850
6-0.167483900393226
70.312575979227153
8-0.0555864408325921
9-0.00141622043201726
10-0.0654687374905932
110.236532458045609
12-0.0814010062266946
130.246629256784548

\begin{tabular}{lllllllll}
\hline
Cross Correlation Function \tabularnewline
Parameter & Value \tabularnewline
Box-Cox transformation parameter (lambda) of X series & 1 \tabularnewline
Degree of non-seasonal differencing (d) of X series & 1 \tabularnewline
Degree of seasonal differencing (D) of X series & 1 \tabularnewline
Seasonal Period (s) & 12 \tabularnewline
Box-Cox transformation parameter (lambda) of Y series & 1 \tabularnewline
Degree of non-seasonal differencing (d) of Y series & 0 \tabularnewline
Degree of seasonal differencing (D) of Y series & 1 \tabularnewline
k & rho(Y[t],X[t+k]) \tabularnewline
-13 & -0.158156437857964 \tabularnewline
-12 & -0.256987004905416 \tabularnewline
-11 & -0.00260864932289934 \tabularnewline
-10 & 0.0822235457024163 \tabularnewline
-9 & -0.180133611693876 \tabularnewline
-8 & -0.139759084183843 \tabularnewline
-7 & 0.159973794071263 \tabularnewline
-6 & -0.0423042017420899 \tabularnewline
-5 & -0.160693304988424 \tabularnewline
-4 & 0.110770901387521 \tabularnewline
-3 & 0.0913398841422665 \tabularnewline
-2 & -0.104097690979768 \tabularnewline
-1 & -0.145564996807647 \tabularnewline
0 & 0.202071094199850 \tabularnewline
1 & 0.0125652616624857 \tabularnewline
2 & -0.113436131967990 \tabularnewline
3 & 0.126256431537732 \tabularnewline
4 & 0.111997110133668 \tabularnewline
5 & 0.0130989833756850 \tabularnewline
6 & -0.167483900393226 \tabularnewline
7 & 0.312575979227153 \tabularnewline
8 & -0.0555864408325921 \tabularnewline
9 & -0.00141622043201726 \tabularnewline
10 & -0.0654687374905932 \tabularnewline
11 & 0.236532458045609 \tabularnewline
12 & -0.0814010062266946 \tabularnewline
13 & 0.246629256784548 \tabularnewline
\hline
\end{tabular}
%Source: https://freestatistics.org/blog/index.php?pk=27900&T=1

[TABLE]
[ROW][C]Cross Correlation Function[/C][/ROW]
[ROW][C]Parameter[/C][C]Value[/C][/ROW]
[ROW][C]Box-Cox transformation parameter (lambda) of X series[/C][C]1[/C][/ROW]
[ROW][C]Degree of non-seasonal differencing (d) of X series[/C][C]1[/C][/ROW]
[ROW][C]Degree of seasonal differencing (D) of X series[/C][C]1[/C][/ROW]
[ROW][C]Seasonal Period (s)[/C][C]12[/C][/ROW]
[ROW][C]Box-Cox transformation parameter (lambda) of Y series[/C][C]1[/C][/ROW]
[ROW][C]Degree of non-seasonal differencing (d) of Y series[/C][C]0[/C][/ROW]
[ROW][C]Degree of seasonal differencing (D) of Y series[/C][C]1[/C][/ROW]
[ROW][C]k[/C][C]rho(Y[t],X[t+k])[/C][/ROW]
[ROW][C]-13[/C][C]-0.158156437857964[/C][/ROW]
[ROW][C]-12[/C][C]-0.256987004905416[/C][/ROW]
[ROW][C]-11[/C][C]-0.00260864932289934[/C][/ROW]
[ROW][C]-10[/C][C]0.0822235457024163[/C][/ROW]
[ROW][C]-9[/C][C]-0.180133611693876[/C][/ROW]
[ROW][C]-8[/C][C]-0.139759084183843[/C][/ROW]
[ROW][C]-7[/C][C]0.159973794071263[/C][/ROW]
[ROW][C]-6[/C][C]-0.0423042017420899[/C][/ROW]
[ROW][C]-5[/C][C]-0.160693304988424[/C][/ROW]
[ROW][C]-4[/C][C]0.110770901387521[/C][/ROW]
[ROW][C]-3[/C][C]0.0913398841422665[/C][/ROW]
[ROW][C]-2[/C][C]-0.104097690979768[/C][/ROW]
[ROW][C]-1[/C][C]-0.145564996807647[/C][/ROW]
[ROW][C]0[/C][C]0.202071094199850[/C][/ROW]
[ROW][C]1[/C][C]0.0125652616624857[/C][/ROW]
[ROW][C]2[/C][C]-0.113436131967990[/C][/ROW]
[ROW][C]3[/C][C]0.126256431537732[/C][/ROW]
[ROW][C]4[/C][C]0.111997110133668[/C][/ROW]
[ROW][C]5[/C][C]0.0130989833756850[/C][/ROW]
[ROW][C]6[/C][C]-0.167483900393226[/C][/ROW]
[ROW][C]7[/C][C]0.312575979227153[/C][/ROW]
[ROW][C]8[/C][C]-0.0555864408325921[/C][/ROW]
[ROW][C]9[/C][C]-0.00141622043201726[/C][/ROW]
[ROW][C]10[/C][C]-0.0654687374905932[/C][/ROW]
[ROW][C]11[/C][C]0.236532458045609[/C][/ROW]
[ROW][C]12[/C][C]-0.0814010062266946[/C][/ROW]
[ROW][C]13[/C][C]0.246629256784548[/C][/ROW]
[/TABLE]
Source: https://freestatistics.org/blog/index.php?pk=27900&T=1

Globally Unique Identifier (entire table): ba.freestatistics.org/blog/index.php?pk=27900&T=1

As an alternative you can also use a QR Code:  

The GUIDs for individual cells are displayed in the table below:

Cross Correlation Function
ParameterValue
Box-Cox transformation parameter (lambda) of X series1
Degree of non-seasonal differencing (d) of X series1
Degree of seasonal differencing (D) of X series1
Seasonal Period (s)12
Box-Cox transformation parameter (lambda) of Y series1
Degree of non-seasonal differencing (d) of Y series0
Degree of seasonal differencing (D) of Y series1
krho(Y[t],X[t+k])
-13-0.158156437857964
-12-0.256987004905416
-11-0.00260864932289934
-100.0822235457024163
-9-0.180133611693876
-8-0.139759084183843
-70.159973794071263
-6-0.0423042017420899
-5-0.160693304988424
-40.110770901387521
-30.0913398841422665
-2-0.104097690979768
-1-0.145564996807647
00.202071094199850
10.0125652616624857
2-0.113436131967990
30.126256431537732
40.111997110133668
50.0130989833756850
6-0.167483900393226
70.312575979227153
8-0.0555864408325921
9-0.00141622043201726
10-0.0654687374905932
110.236532458045609
12-0.0814010062266946
130.246629256784548


Parameters (Session):
par1 = 1 ; par2 = 1 ; par3 = 1 ; par4 = 12 ; par5 = 1 ; par6 = 0 ; par7 = 1 ;
Parameters (R input):
par1 = 1 ; par2 = 1 ; par3 = 1 ; par4 = 12 ; par5 = 1 ; par6 = 0 ; par7 = 1 ;
R code (references can be found in the software module):
par1 <- as.numeric(par1)
par2 <- as.numeric(par2)
par3 <- as.numeric(par3)
par4 <- as.numeric(par4)
par5 <- as.numeric(par5)
par6 <- as.numeric(par6)
par7 <- as.numeric(par7)
if (par1 == 0) {
x <- log(x)
} else {
x <- (x ^ par1 - 1) / par1
}
if (par5 == 0) {
y <- log(y)
} else {
y <- (y ^ par5 - 1) / par5
}
if (par2 > 0) x <- diff(x,lag=1,difference=par2)
if (par6 > 0) y <- diff(y,lag=1,difference=par6)
if (par3 > 0) x <- diff(x,lag=par4,difference=par3)
if (par7 > 0) y <- diff(y,lag=par4,difference=par7)
x
y
bitmap(file='test1.png')
(r <- ccf(x,y,main='Cross Correlation Function',ylab='CCF',xlab='Lag (k)'))
dev.off()
load(file='createtable')
a<-table.start()
a<-table.row.start(a)
a<-table.element(a,'Cross Correlation Function',2,TRUE)
a<-table.row.end(a)
a<-table.row.start(a)
a<-table.element(a,'Parameter',header=TRUE)
a<-table.element(a,'Value',header=TRUE)
a<-table.row.end(a)
a<-table.row.start(a)
a<-table.element(a,'Box-Cox transformation parameter (lambda) of X series',header=TRUE)
a<-table.element(a,par1)
a<-table.row.end(a)
a<-table.row.start(a)
a<-table.element(a,'Degree of non-seasonal differencing (d) of X series',header=TRUE)
a<-table.element(a,par2)
a<-table.row.end(a)
a<-table.row.start(a)
a<-table.element(a,'Degree of seasonal differencing (D) of X series',header=TRUE)
a<-table.element(a,par3)
a<-table.row.end(a)
a<-table.row.start(a)
a<-table.element(a,'Seasonal Period (s)',header=TRUE)
a<-table.element(a,par4)
a<-table.row.end(a)
a<-table.row.start(a)
a<-table.element(a,'Box-Cox transformation parameter (lambda) of Y series',header=TRUE)
a<-table.element(a,par5)
a<-table.row.end(a)
a<-table.row.start(a)
a<-table.element(a,'Degree of non-seasonal differencing (d) of Y series',header=TRUE)
a<-table.element(a,par6)
a<-table.row.end(a)
a<-table.row.start(a)
a<-table.element(a,'Degree of seasonal differencing (D) of Y series',header=TRUE)
a<-table.element(a,par7)
a<-table.row.end(a)
a<-table.row.start(a)
a<-table.element(a,'k',header=TRUE)
a<-table.element(a,'rho(Y[t],X[t+k])',header=TRUE)
a<-table.row.end(a)
mylength <- length(r$acf)
myhalf <- floor((mylength-1)/2)
for (i in 1:mylength) {
a<-table.row.start(a)
a<-table.element(a,i-myhalf-1,header=TRUE)
a<-table.element(a,r$acf[i])
a<-table.row.end(a)
}
a<-table.end(a)
table.save(a,file='mytable.tab')