Free Statistics

of Irreproducible Research!

Author's title

Author*The author of this computation has been verified*
R Software Modulerwasp_autocorrelation.wasp
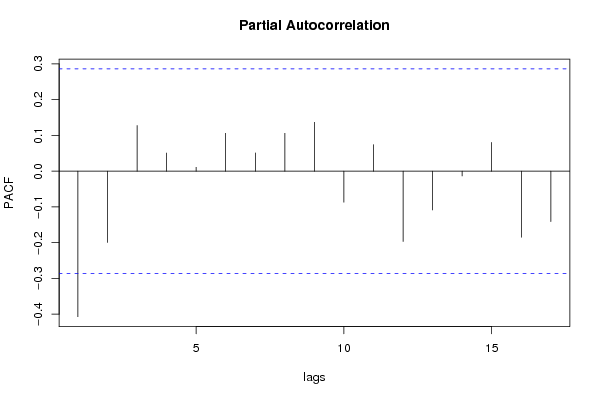
Title produced by software(Partial) Autocorrelation Function
Date of computationTue, 02 Dec 2008 07:50:00 -0700
Cite this page as followsStatistical Computations at FreeStatistics.org, Office for Research Development and Education, URL https://freestatistics.org/blog/index.php?v=date/2008/Dec/02/t1228229553h1r02hqxcmxacn8.htm/, Retrieved Sun, 19 May 2024 08:45:51 +0000
Statistical Computations at FreeStatistics.org, Office for Research Development and Education, URL https://freestatistics.org/blog/index.php?pk=27889, Retrieved Sun, 19 May 2024 08:45:51 +0000
QR Codes:

Original text written by user:
IsPrivate?No (this computation is public)
User-defined keywords
Estimated Impact194
Family? (F = Feedback message, R = changed R code, M = changed R Module, P = changed Parameters, D = changed Data)
F     [Univariate Data Series] [Airline data] [2007-10-18 09:58:47] [42daae401fd3def69a25014f2252b4c2]
F RMPD  [Cross Correlation Function] [Q7] [2008-12-02 13:17:13] [5387335d8669ad018e3e2def51162329]
- RMPD      [(Partial) Autocorrelation Function] [autocorrelation] [2008-12-02 14:50:00] [c4248bbb85fa4e400deddbf50234dcae] [Current]
Feedback Forum

Post a new message
Dataseries X:
35810356.5
35492936.3
38937434.1
40059102.8
37708710.2
41570965.7
36333563
34181220.1
42593543.9
43119727.6
38497690.9
45473273.4
38399780.4
38882302.6
44051120.6
41677559.9
40699203.5
44150027.6
38225518.7
35447405.7
43075518.3
42302792
39743541.7
44670641.2
37123384
37668266.4
46117528.8
42273156.4
39404153.2
45799994.5
38602505.2
39454830.1
47427901.4
46497980.9
45057149.4
50615569.2
43033396.2
46013056.5
54222266.3
46417306.4
51046271.8
51201279.6
43475288.7
44968981.1
53939345.4
54549319.7
54072107.3
58434230.1
51158751
50039368
57872617.4
51642978.8
54534465.9
56094697.8
48189983.1
47492381
52987449.1
55719803.5
53922860.5
54931231.9


Summary of computational transaction
Raw Inputview raw input (R code)
Raw Outputview raw output of R engine
Computing time1 seconds
R Server'Gwilym Jenkins' @ 72.249.127.135

\begin{tabular}{lllllllll}
\hline
Summary of computational transaction \tabularnewline
Raw Input & view raw input (R code)  \tabularnewline
Raw Output & view raw output of R engine  \tabularnewline
Computing time & 1 seconds \tabularnewline
R Server & 'Gwilym Jenkins' @ 72.249.127.135 \tabularnewline
\hline
\end{tabular}
%Source: https://freestatistics.org/blog/index.php?pk=27889&T=0

[TABLE]
[ROW][C]Summary of computational transaction[/C][/ROW]
[ROW][C]Raw Input[/C][C]view raw input (R code) [/C][/ROW]
[ROW][C]Raw Output[/C][C]view raw output of R engine [/C][/ROW]
[ROW][C]Computing time[/C][C]1 seconds[/C][/ROW]
[ROW][C]R Server[/C][C]'Gwilym Jenkins' @ 72.249.127.135[/C][/ROW]
[/TABLE]
Source: https://freestatistics.org/blog/index.php?pk=27889&T=0

Globally Unique Identifier (entire table): ba.freestatistics.org/blog/index.php?pk=27889&T=0

As an alternative you can also use a QR Code:  

The GUIDs for individual cells are displayed in the table below:

Summary of computational transaction
Raw Inputview raw input (R code)
Raw Outputview raw output of R engine
Computing time1 seconds
R Server'Gwilym Jenkins' @ 72.249.127.135


Autocorrelation Function
Time lag kACF(k)T-STATP-value
1-0.406869-2.78940.003802
2-0.000705-0.00480.498082
30.1837351.25960.107013
4-0.096934-0.66450.254795
50.0093530.06410.474572
60.1152390.790.216737
7-0.059566-0.40840.34243
80.0810440.55560.290556
90.0683210.46840.320837
10-0.158616-1.08740.1412
110.1858791.27430.104407
12-0.209824-1.43850.078462
130.0393860.270.394164
140.0891930.61150.271915
15-0.021746-0.14910.441063
16-0.177258-1.21520.115176
170.0914090.62670.266954

\begin{tabular}{lllllllll}
\hline
Autocorrelation Function \tabularnewline
Time lag k & ACF(k) & T-STAT & P-value \tabularnewline
1 & -0.406869 & -2.7894 & 0.003802 \tabularnewline
2 & -0.000705 & -0.0048 & 0.498082 \tabularnewline
3 & 0.183735 & 1.2596 & 0.107013 \tabularnewline
4 & -0.096934 & -0.6645 & 0.254795 \tabularnewline
5 & 0.009353 & 0.0641 & 0.474572 \tabularnewline
6 & 0.115239 & 0.79 & 0.216737 \tabularnewline
7 & -0.059566 & -0.4084 & 0.34243 \tabularnewline
8 & 0.081044 & 0.5556 & 0.290556 \tabularnewline
9 & 0.068321 & 0.4684 & 0.320837 \tabularnewline
10 & -0.158616 & -1.0874 & 0.1412 \tabularnewline
11 & 0.185879 & 1.2743 & 0.104407 \tabularnewline
12 & -0.209824 & -1.4385 & 0.078462 \tabularnewline
13 & 0.039386 & 0.27 & 0.394164 \tabularnewline
14 & 0.089193 & 0.6115 & 0.271915 \tabularnewline
15 & -0.021746 & -0.1491 & 0.441063 \tabularnewline
16 & -0.177258 & -1.2152 & 0.115176 \tabularnewline
17 & 0.091409 & 0.6267 & 0.266954 \tabularnewline
\hline
\end{tabular}
%Source: https://freestatistics.org/blog/index.php?pk=27889&T=1

[TABLE]
[ROW][C]Autocorrelation Function[/C][/ROW]
[ROW][C]Time lag k[/C][C]ACF(k)[/C][C]T-STAT[/C][C]P-value[/C][/ROW]
[ROW][C]1[/C][C]-0.406869[/C][C]-2.7894[/C][C]0.003802[/C][/ROW]
[ROW][C]2[/C][C]-0.000705[/C][C]-0.0048[/C][C]0.498082[/C][/ROW]
[ROW][C]3[/C][C]0.183735[/C][C]1.2596[/C][C]0.107013[/C][/ROW]
[ROW][C]4[/C][C]-0.096934[/C][C]-0.6645[/C][C]0.254795[/C][/ROW]
[ROW][C]5[/C][C]0.009353[/C][C]0.0641[/C][C]0.474572[/C][/ROW]
[ROW][C]6[/C][C]0.115239[/C][C]0.79[/C][C]0.216737[/C][/ROW]
[ROW][C]7[/C][C]-0.059566[/C][C]-0.4084[/C][C]0.34243[/C][/ROW]
[ROW][C]8[/C][C]0.081044[/C][C]0.5556[/C][C]0.290556[/C][/ROW]
[ROW][C]9[/C][C]0.068321[/C][C]0.4684[/C][C]0.320837[/C][/ROW]
[ROW][C]10[/C][C]-0.158616[/C][C]-1.0874[/C][C]0.1412[/C][/ROW]
[ROW][C]11[/C][C]0.185879[/C][C]1.2743[/C][C]0.104407[/C][/ROW]
[ROW][C]12[/C][C]-0.209824[/C][C]-1.4385[/C][C]0.078462[/C][/ROW]
[ROW][C]13[/C][C]0.039386[/C][C]0.27[/C][C]0.394164[/C][/ROW]
[ROW][C]14[/C][C]0.089193[/C][C]0.6115[/C][C]0.271915[/C][/ROW]
[ROW][C]15[/C][C]-0.021746[/C][C]-0.1491[/C][C]0.441063[/C][/ROW]
[ROW][C]16[/C][C]-0.177258[/C][C]-1.2152[/C][C]0.115176[/C][/ROW]
[ROW][C]17[/C][C]0.091409[/C][C]0.6267[/C][C]0.266954[/C][/ROW]
[/TABLE]
Source: https://freestatistics.org/blog/index.php?pk=27889&T=1

Globally Unique Identifier (entire table): ba.freestatistics.org/blog/index.php?pk=27889&T=1

As an alternative you can also use a QR Code:  

The GUIDs for individual cells are displayed in the table below:

Autocorrelation Function
Time lag kACF(k)T-STATP-value
1-0.406869-2.78940.003802
2-0.000705-0.00480.498082
30.1837351.25960.107013
4-0.096934-0.66450.254795
50.0093530.06410.474572
60.1152390.790.216737
7-0.059566-0.40840.34243
80.0810440.55560.290556
90.0683210.46840.320837
10-0.158616-1.08740.1412
110.1858791.27430.104407
12-0.209824-1.43850.078462
130.0393860.270.394164
140.0891930.61150.271915
15-0.021746-0.14910.441063
16-0.177258-1.21520.115176
170.0914090.62670.266954


Partial Autocorrelation Function
Time lag kPACF(k)T-STATP-value
1-0.406869-2.78940.003802
2-0.199228-1.36580.089245
30.12770.87550.192885
40.050620.3470.365058
50.0107870.0740.47068
60.1059310.72620.235651
70.0508460.34860.364479
80.1058910.7260.235733
90.1368030.93790.176552
10-0.086642-0.5940.277685
110.0742260.50890.306613
12-0.196656-1.34820.092027
13-0.108596-0.74450.230141
14-0.013239-0.09080.464034
150.0804910.55180.291843
16-0.184763-1.26670.105757
17-0.140875-0.96580.169546

\begin{tabular}{lllllllll}
\hline
Partial Autocorrelation Function \tabularnewline
Time lag k & PACF(k) & T-STAT & P-value \tabularnewline
1 & -0.406869 & -2.7894 & 0.003802 \tabularnewline
2 & -0.199228 & -1.3658 & 0.089245 \tabularnewline
3 & 0.1277 & 0.8755 & 0.192885 \tabularnewline
4 & 0.05062 & 0.347 & 0.365058 \tabularnewline
5 & 0.010787 & 0.074 & 0.47068 \tabularnewline
6 & 0.105931 & 0.7262 & 0.235651 \tabularnewline
7 & 0.050846 & 0.3486 & 0.364479 \tabularnewline
8 & 0.105891 & 0.726 & 0.235733 \tabularnewline
9 & 0.136803 & 0.9379 & 0.176552 \tabularnewline
10 & -0.086642 & -0.594 & 0.277685 \tabularnewline
11 & 0.074226 & 0.5089 & 0.306613 \tabularnewline
12 & -0.196656 & -1.3482 & 0.092027 \tabularnewline
13 & -0.108596 & -0.7445 & 0.230141 \tabularnewline
14 & -0.013239 & -0.0908 & 0.464034 \tabularnewline
15 & 0.080491 & 0.5518 & 0.291843 \tabularnewline
16 & -0.184763 & -1.2667 & 0.105757 \tabularnewline
17 & -0.140875 & -0.9658 & 0.169546 \tabularnewline
\hline
\end{tabular}
%Source: https://freestatistics.org/blog/index.php?pk=27889&T=2

[TABLE]
[ROW][C]Partial Autocorrelation Function[/C][/ROW]
[ROW][C]Time lag k[/C][C]PACF(k)[/C][C]T-STAT[/C][C]P-value[/C][/ROW]
[ROW][C]1[/C][C]-0.406869[/C][C]-2.7894[/C][C]0.003802[/C][/ROW]
[ROW][C]2[/C][C]-0.199228[/C][C]-1.3658[/C][C]0.089245[/C][/ROW]
[ROW][C]3[/C][C]0.1277[/C][C]0.8755[/C][C]0.192885[/C][/ROW]
[ROW][C]4[/C][C]0.05062[/C][C]0.347[/C][C]0.365058[/C][/ROW]
[ROW][C]5[/C][C]0.010787[/C][C]0.074[/C][C]0.47068[/C][/ROW]
[ROW][C]6[/C][C]0.105931[/C][C]0.7262[/C][C]0.235651[/C][/ROW]
[ROW][C]7[/C][C]0.050846[/C][C]0.3486[/C][C]0.364479[/C][/ROW]
[ROW][C]8[/C][C]0.105891[/C][C]0.726[/C][C]0.235733[/C][/ROW]
[ROW][C]9[/C][C]0.136803[/C][C]0.9379[/C][C]0.176552[/C][/ROW]
[ROW][C]10[/C][C]-0.086642[/C][C]-0.594[/C][C]0.277685[/C][/ROW]
[ROW][C]11[/C][C]0.074226[/C][C]0.5089[/C][C]0.306613[/C][/ROW]
[ROW][C]12[/C][C]-0.196656[/C][C]-1.3482[/C][C]0.092027[/C][/ROW]
[ROW][C]13[/C][C]-0.108596[/C][C]-0.7445[/C][C]0.230141[/C][/ROW]
[ROW][C]14[/C][C]-0.013239[/C][C]-0.0908[/C][C]0.464034[/C][/ROW]
[ROW][C]15[/C][C]0.080491[/C][C]0.5518[/C][C]0.291843[/C][/ROW]
[ROW][C]16[/C][C]-0.184763[/C][C]-1.2667[/C][C]0.105757[/C][/ROW]
[ROW][C]17[/C][C]-0.140875[/C][C]-0.9658[/C][C]0.169546[/C][/ROW]
[/TABLE]
Source: https://freestatistics.org/blog/index.php?pk=27889&T=2

Globally Unique Identifier (entire table): ba.freestatistics.org/blog/index.php?pk=27889&T=2

As an alternative you can also use a QR Code:  

The GUIDs for individual cells are displayed in the table below:

Partial Autocorrelation Function
Time lag kPACF(k)T-STATP-value
1-0.406869-2.78940.003802
2-0.199228-1.36580.089245
30.12770.87550.192885
40.050620.3470.365058
50.0107870.0740.47068
60.1059310.72620.235651
70.0508460.34860.364479
80.1058910.7260.235733
90.1368030.93790.176552
10-0.086642-0.5940.277685
110.0742260.50890.306613
12-0.196656-1.34820.092027
13-0.108596-0.74450.230141
14-0.013239-0.09080.464034
150.0804910.55180.291843
16-0.184763-1.26670.105757
17-0.140875-0.96580.169546


Parameters (Session):
par1 = 1 ; par2 = 0 ; par3 = 1 ; par4 = 12 ; par5 = 1 ; par6 = 0 ; par7 = 1 ;
Parameters (R input):
par1 = Default ; par2 = 1 ; par3 = 1 ; par4 = 1 ; par5 = 12 ;
R code (references can be found in the software module):
if (par1 == 'Default') {
par1 = 10*log10(length(x))
} else {
par1 <- as.numeric(par1)
}
par2 <- as.numeric(par2)
par3 <- as.numeric(par3)
par4 <- as.numeric(par4)
par5 <- as.numeric(par5)
if (par2 == 0) {
x <- log(x)
} else {
x <- (x ^ par2 - 1) / par2
}
if (par3 > 0) x <- diff(x,lag=1,difference=par3)
if (par4 > 0) x <- diff(x,lag=par5,difference=par4)
bitmap(file='pic1.png')
racf <- acf(x,par1,main='Autocorrelation',xlab='lags',ylab='ACF')
dev.off()
bitmap(file='pic2.png')
rpacf <- pacf(x,par1,main='Partial Autocorrelation',xlab='lags',ylab='PACF')
dev.off()
(myacf <- c(racf$acf))
(mypacf <- c(rpacf$acf))
lengthx <- length(x)
sqrtn <- sqrt(lengthx)
load(file='createtable')
a<-table.start()
a<-table.row.start(a)
a<-table.element(a,'Autocorrelation Function',4,TRUE)
a<-table.row.end(a)
a<-table.row.start(a)
a<-table.element(a,'Time lag k',header=TRUE)
a<-table.element(a,hyperlink('basics.htm','ACF(k)','click here for more information about the Autocorrelation Function'),header=TRUE)
a<-table.element(a,'T-STAT',header=TRUE)
a<-table.element(a,'P-value',header=TRUE)
a<-table.row.end(a)
for (i in 2:(par1+1)) {
a<-table.row.start(a)
a<-table.element(a,i-1,header=TRUE)
a<-table.element(a,round(myacf[i],6))
mytstat <- myacf[i]*sqrtn
a<-table.element(a,round(mytstat,4))
a<-table.element(a,round(1-pt(abs(mytstat),lengthx),6))
a<-table.row.end(a)
}
a<-table.end(a)
table.save(a,file='mytable.tab')
a<-table.start()
a<-table.row.start(a)
a<-table.element(a,'Partial Autocorrelation Function',4,TRUE)
a<-table.row.end(a)
a<-table.row.start(a)
a<-table.element(a,'Time lag k',header=TRUE)
a<-table.element(a,hyperlink('basics.htm','PACF(k)','click here for more information about the Partial Autocorrelation Function'),header=TRUE)
a<-table.element(a,'T-STAT',header=TRUE)
a<-table.element(a,'P-value',header=TRUE)
a<-table.row.end(a)
for (i in 1:par1) {
a<-table.row.start(a)
a<-table.element(a,i,header=TRUE)
a<-table.element(a,round(mypacf[i],6))
mytstat <- mypacf[i]*sqrtn
a<-table.element(a,round(mytstat,4))
a<-table.element(a,round(1-pt(abs(mytstat),lengthx),6))
a<-table.row.end(a)
}
a<-table.end(a)
table.save(a,file='mytable1.tab')