Free Statistics

of Irreproducible Research!

Author's title

Author*The author of this computation has been verified*
R Software Modulerwasp_cross.wasp
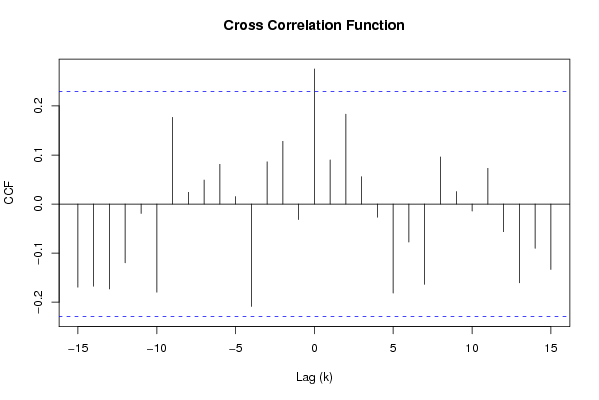
Title produced by softwareCross Correlation Function
Date of computationTue, 02 Dec 2008 06:45:46 -0700
Cite this page as followsStatistical Computations at FreeStatistics.org, Office for Research Development and Education, URL https://freestatistics.org/blog/index.php?v=date/2008/Dec/02/t12282256338kkjfldhzm88upt.htm/, Retrieved Sun, 19 May 2024 09:40:50 +0000
Statistical Computations at FreeStatistics.org, Office for Research Development and Education, URL https://freestatistics.org/blog/index.php?pk=27781, Retrieved Sun, 19 May 2024 09:40:50 +0000
QR Codes:

Original text written by user:
IsPrivate?No (this computation is public)
User-defined keywords
Estimated Impact196
Family? (F = Feedback message, R = changed R code, M = changed R Module, P = changed Parameters, D = changed Data)
F     [Univariate Data Series] [Airline data] [2007-10-18 09:58:47] [42daae401fd3def69a25014f2252b4c2]
F RMPD  [Cross Correlation Function] [Q7] [2008-12-02 13:17:13] [5387335d8669ad018e3e2def51162329]
F   PD      [Cross Correlation Function] [q9] [2008-12-02 13:45:46] [c4248bbb85fa4e400deddbf50234dcae] [Current]
Feedback Forum
2008-12-07 14:18:36 [Katrijn Truyman] [reply
Het is inderdaad een goed model, maar waarom d=0, D=1 en lambda =1? Bij vraag 8 heb je geen enkele berekening gemaakt... Op basis van die berekeningen kan je pas weten welke waarde je moet invullen bij d, D en lambda..
2008-12-08 11:57:08 [Jessica Alves Pires] [reply
Ik ben het volledig eens met Katrijn. Je hebt Q8 niet opgelost dus hoe kom je aan de parameters? Heb je ze gewoon willekeurig gekozen?

Post a new message
Dataseries X:
103.1
100.6
103.1
95.5
90.5
90.9
88.8
90.7
94.3
104.6
111.1
110.8
107.2
99.0
99.0
91.0
96.2
96.9
96.2
100.1
99.0
115.4
106.9
107.1
99.3
99.2
108.3
105.6
99.5
107.4
93.1
88.1
110.7
113.1
99.6
93.6
98.6
99.6
114.3
107.8
101.2
112.5
100.5
93.9
116.2
112.0
106.4
95.7
96.0
95.8
103.0
102.2
98.4
111.4
86.6
91.3
107.9
101.8
104.4
93.4
100.1
98.5
112.9
101.4
107.1
110.8
90.3
95.5
111.4
113.0
107.5
95.9
106.3
105.2
117.2
106.9
108.2
113.0
97.2
99.9
108.1
118.1
109.1
93.3
112.1
Dataseries Y:
119.5
125.0
145.0
105.3
116.9
120.1
88.9
78.4
114.6
113.3
117.0
99.6
99.4
101.9
115.2
108.5
113.8
121.0
92.2
90.2
101.5
126.6
93.9
89.8
93.4
101.5
110.4
105.9
108.4
113.9
86.1
69.4
101.2
100.5
98.0
106.6
90.1
96.9
125.9
112.0
100.0
123.9
79.8
83.4
113.6
112.9
104.0
109.9
99.0
106.3
128.9
111.1
102.9
130.0
87.0
87.5
117.6
103.4
110.8
112.6
102.5
112.4
135.6
105.1
127.7
137.0
91.0
90.5
122.4
123.3
124.3
120.0
118.1
119.0
142.7
123.6
129.6
151.6
110.4
99.2
130.5
136.2
129.7
128.0
121.6


Summary of computational transaction
Raw Inputview raw input (R code)
Raw Outputview raw output of R engine
Computing time0 seconds
R Server'Gwilym Jenkins' @ 72.249.127.135

\begin{tabular}{lllllllll}
\hline
Summary of computational transaction \tabularnewline
Raw Input & view raw input (R code)  \tabularnewline
Raw Output & view raw output of R engine  \tabularnewline
Computing time & 0 seconds \tabularnewline
R Server & 'Gwilym Jenkins' @ 72.249.127.135 \tabularnewline
\hline
\end{tabular}
%Source: https://freestatistics.org/blog/index.php?pk=27781&T=0

[TABLE]
[ROW][C]Summary of computational transaction[/C][/ROW]
[ROW][C]Raw Input[/C][C]view raw input (R code) [/C][/ROW]
[ROW][C]Raw Output[/C][C]view raw output of R engine [/C][/ROW]
[ROW][C]Computing time[/C][C]0 seconds[/C][/ROW]
[ROW][C]R Server[/C][C]'Gwilym Jenkins' @ 72.249.127.135[/C][/ROW]
[/TABLE]
Source: https://freestatistics.org/blog/index.php?pk=27781&T=0

Globally Unique Identifier (entire table): ba.freestatistics.org/blog/index.php?pk=27781&T=0

As an alternative you can also use a QR Code:  

The GUIDs for individual cells are displayed in the table below:

Summary of computational transaction
Raw Inputview raw input (R code)
Raw Outputview raw output of R engine
Computing time0 seconds
R Server'Gwilym Jenkins' @ 72.249.127.135


Cross Correlation Function
ParameterValue
Box-Cox transformation parameter (lambda) of X series1
Degree of non-seasonal differencing (d) of X series0
Degree of seasonal differencing (D) of X series1
Seasonal Period (s)12
Box-Cox transformation parameter (lambda) of Y series1
Degree of non-seasonal differencing (d) of Y series0
Degree of seasonal differencing (D) of Y series1
krho(Y[t],X[t+k])
-15-0.169383815871046
-14-0.167284594655772
-13-0.173021841879155
-12-0.11964390960387
-11-0.0190756217012779
-10-0.179538050285359
-90.176817897652426
-80.0240340221140066
-70.0490381633392539
-60.0812556817693805
-50.0154063864827919
-4-0.208657213079134
-30.0863055318187623
-20.127954348042543
-1-0.0315833686954385
00.275512376353450
10.089967775186433
20.183232587126697
30.0559616135390919
4-0.0267040948864472
5-0.181276820799616
6-0.0773714363449297
7-0.163436776766494
80.0961070277002962
90.0256350305957453
10-0.0140853489468331
110.0730980062954541
12-0.0561038368435531
13-0.160464140000711
14-0.090100764642634
15-0.133218066848514

\begin{tabular}{lllllllll}
\hline
Cross Correlation Function \tabularnewline
Parameter & Value \tabularnewline
Box-Cox transformation parameter (lambda) of X series & 1 \tabularnewline
Degree of non-seasonal differencing (d) of X series & 0 \tabularnewline
Degree of seasonal differencing (D) of X series & 1 \tabularnewline
Seasonal Period (s) & 12 \tabularnewline
Box-Cox transformation parameter (lambda) of Y series & 1 \tabularnewline
Degree of non-seasonal differencing (d) of Y series & 0 \tabularnewline
Degree of seasonal differencing (D) of Y series & 1 \tabularnewline
k & rho(Y[t],X[t+k]) \tabularnewline
-15 & -0.169383815871046 \tabularnewline
-14 & -0.167284594655772 \tabularnewline
-13 & -0.173021841879155 \tabularnewline
-12 & -0.11964390960387 \tabularnewline
-11 & -0.0190756217012779 \tabularnewline
-10 & -0.179538050285359 \tabularnewline
-9 & 0.176817897652426 \tabularnewline
-8 & 0.0240340221140066 \tabularnewline
-7 & 0.0490381633392539 \tabularnewline
-6 & 0.0812556817693805 \tabularnewline
-5 & 0.0154063864827919 \tabularnewline
-4 & -0.208657213079134 \tabularnewline
-3 & 0.0863055318187623 \tabularnewline
-2 & 0.127954348042543 \tabularnewline
-1 & -0.0315833686954385 \tabularnewline
0 & 0.275512376353450 \tabularnewline
1 & 0.089967775186433 \tabularnewline
2 & 0.183232587126697 \tabularnewline
3 & 0.0559616135390919 \tabularnewline
4 & -0.0267040948864472 \tabularnewline
5 & -0.181276820799616 \tabularnewline
6 & -0.0773714363449297 \tabularnewline
7 & -0.163436776766494 \tabularnewline
8 & 0.0961070277002962 \tabularnewline
9 & 0.0256350305957453 \tabularnewline
10 & -0.0140853489468331 \tabularnewline
11 & 0.0730980062954541 \tabularnewline
12 & -0.0561038368435531 \tabularnewline
13 & -0.160464140000711 \tabularnewline
14 & -0.090100764642634 \tabularnewline
15 & -0.133218066848514 \tabularnewline
\hline
\end{tabular}
%Source: https://freestatistics.org/blog/index.php?pk=27781&T=1

[TABLE]
[ROW][C]Cross Correlation Function[/C][/ROW]
[ROW][C]Parameter[/C][C]Value[/C][/ROW]
[ROW][C]Box-Cox transformation parameter (lambda) of X series[/C][C]1[/C][/ROW]
[ROW][C]Degree of non-seasonal differencing (d) of X series[/C][C]0[/C][/ROW]
[ROW][C]Degree of seasonal differencing (D) of X series[/C][C]1[/C][/ROW]
[ROW][C]Seasonal Period (s)[/C][C]12[/C][/ROW]
[ROW][C]Box-Cox transformation parameter (lambda) of Y series[/C][C]1[/C][/ROW]
[ROW][C]Degree of non-seasonal differencing (d) of Y series[/C][C]0[/C][/ROW]
[ROW][C]Degree of seasonal differencing (D) of Y series[/C][C]1[/C][/ROW]
[ROW][C]k[/C][C]rho(Y[t],X[t+k])[/C][/ROW]
[ROW][C]-15[/C][C]-0.169383815871046[/C][/ROW]
[ROW][C]-14[/C][C]-0.167284594655772[/C][/ROW]
[ROW][C]-13[/C][C]-0.173021841879155[/C][/ROW]
[ROW][C]-12[/C][C]-0.11964390960387[/C][/ROW]
[ROW][C]-11[/C][C]-0.0190756217012779[/C][/ROW]
[ROW][C]-10[/C][C]-0.179538050285359[/C][/ROW]
[ROW][C]-9[/C][C]0.176817897652426[/C][/ROW]
[ROW][C]-8[/C][C]0.0240340221140066[/C][/ROW]
[ROW][C]-7[/C][C]0.0490381633392539[/C][/ROW]
[ROW][C]-6[/C][C]0.0812556817693805[/C][/ROW]
[ROW][C]-5[/C][C]0.0154063864827919[/C][/ROW]
[ROW][C]-4[/C][C]-0.208657213079134[/C][/ROW]
[ROW][C]-3[/C][C]0.0863055318187623[/C][/ROW]
[ROW][C]-2[/C][C]0.127954348042543[/C][/ROW]
[ROW][C]-1[/C][C]-0.0315833686954385[/C][/ROW]
[ROW][C]0[/C][C]0.275512376353450[/C][/ROW]
[ROW][C]1[/C][C]0.089967775186433[/C][/ROW]
[ROW][C]2[/C][C]0.183232587126697[/C][/ROW]
[ROW][C]3[/C][C]0.0559616135390919[/C][/ROW]
[ROW][C]4[/C][C]-0.0267040948864472[/C][/ROW]
[ROW][C]5[/C][C]-0.181276820799616[/C][/ROW]
[ROW][C]6[/C][C]-0.0773714363449297[/C][/ROW]
[ROW][C]7[/C][C]-0.163436776766494[/C][/ROW]
[ROW][C]8[/C][C]0.0961070277002962[/C][/ROW]
[ROW][C]9[/C][C]0.0256350305957453[/C][/ROW]
[ROW][C]10[/C][C]-0.0140853489468331[/C][/ROW]
[ROW][C]11[/C][C]0.0730980062954541[/C][/ROW]
[ROW][C]12[/C][C]-0.0561038368435531[/C][/ROW]
[ROW][C]13[/C][C]-0.160464140000711[/C][/ROW]
[ROW][C]14[/C][C]-0.090100764642634[/C][/ROW]
[ROW][C]15[/C][C]-0.133218066848514[/C][/ROW]
[/TABLE]
Source: https://freestatistics.org/blog/index.php?pk=27781&T=1

Globally Unique Identifier (entire table): ba.freestatistics.org/blog/index.php?pk=27781&T=1

As an alternative you can also use a QR Code:  

The GUIDs for individual cells are displayed in the table below:

Cross Correlation Function
ParameterValue
Box-Cox transformation parameter (lambda) of X series1
Degree of non-seasonal differencing (d) of X series0
Degree of seasonal differencing (D) of X series1
Seasonal Period (s)12
Box-Cox transformation parameter (lambda) of Y series1
Degree of non-seasonal differencing (d) of Y series0
Degree of seasonal differencing (D) of Y series1
krho(Y[t],X[t+k])
-15-0.169383815871046
-14-0.167284594655772
-13-0.173021841879155
-12-0.11964390960387
-11-0.0190756217012779
-10-0.179538050285359
-90.176817897652426
-80.0240340221140066
-70.0490381633392539
-60.0812556817693805
-50.0154063864827919
-4-0.208657213079134
-30.0863055318187623
-20.127954348042543
-1-0.0315833686954385
00.275512376353450
10.089967775186433
20.183232587126697
30.0559616135390919
4-0.0267040948864472
5-0.181276820799616
6-0.0773714363449297
7-0.163436776766494
80.0961070277002962
90.0256350305957453
10-0.0140853489468331
110.0730980062954541
12-0.0561038368435531
13-0.160464140000711
14-0.090100764642634
15-0.133218066848514


Parameters (Session):
par1 = 1 ; par2 = 0 ; par3 = 1 ; par4 = 12 ; par5 = 1 ; par6 = 0 ; par7 = 1 ;
Parameters (R input):
par1 = 1 ; par2 = 0 ; par3 = 1 ; par4 = 12 ; par5 = 1 ; par6 = 0 ; par7 = 1 ;
R code (references can be found in the software module):
par1 <- as.numeric(par1)
par2 <- as.numeric(par2)
par3 <- as.numeric(par3)
par4 <- as.numeric(par4)
par5 <- as.numeric(par5)
par6 <- as.numeric(par6)
par7 <- as.numeric(par7)
if (par1 == 0) {
x <- log(x)
} else {
x <- (x ^ par1 - 1) / par1
}
if (par5 == 0) {
y <- log(y)
} else {
y <- (y ^ par5 - 1) / par5
}
if (par2 > 0) x <- diff(x,lag=1,difference=par2)
if (par6 > 0) y <- diff(y,lag=1,difference=par6)
if (par3 > 0) x <- diff(x,lag=par4,difference=par3)
if (par7 > 0) y <- diff(y,lag=par4,difference=par7)
x
y
bitmap(file='test1.png')
(r <- ccf(x,y,main='Cross Correlation Function',ylab='CCF',xlab='Lag (k)'))
dev.off()
load(file='createtable')
a<-table.start()
a<-table.row.start(a)
a<-table.element(a,'Cross Correlation Function',2,TRUE)
a<-table.row.end(a)
a<-table.row.start(a)
a<-table.element(a,'Parameter',header=TRUE)
a<-table.element(a,'Value',header=TRUE)
a<-table.row.end(a)
a<-table.row.start(a)
a<-table.element(a,'Box-Cox transformation parameter (lambda) of X series',header=TRUE)
a<-table.element(a,par1)
a<-table.row.end(a)
a<-table.row.start(a)
a<-table.element(a,'Degree of non-seasonal differencing (d) of X series',header=TRUE)
a<-table.element(a,par2)
a<-table.row.end(a)
a<-table.row.start(a)
a<-table.element(a,'Degree of seasonal differencing (D) of X series',header=TRUE)
a<-table.element(a,par3)
a<-table.row.end(a)
a<-table.row.start(a)
a<-table.element(a,'Seasonal Period (s)',header=TRUE)
a<-table.element(a,par4)
a<-table.row.end(a)
a<-table.row.start(a)
a<-table.element(a,'Box-Cox transformation parameter (lambda) of Y series',header=TRUE)
a<-table.element(a,par5)
a<-table.row.end(a)
a<-table.row.start(a)
a<-table.element(a,'Degree of non-seasonal differencing (d) of Y series',header=TRUE)
a<-table.element(a,par6)
a<-table.row.end(a)
a<-table.row.start(a)
a<-table.element(a,'Degree of seasonal differencing (D) of Y series',header=TRUE)
a<-table.element(a,par7)
a<-table.row.end(a)
a<-table.row.start(a)
a<-table.element(a,'k',header=TRUE)
a<-table.element(a,'rho(Y[t],X[t+k])',header=TRUE)
a<-table.row.end(a)
mylength <- length(r$acf)
myhalf <- floor((mylength-1)/2)
for (i in 1:mylength) {
a<-table.row.start(a)
a<-table.element(a,i-myhalf-1,header=TRUE)
a<-table.element(a,r$acf[i])
a<-table.row.end(a)
}
a<-table.end(a)
table.save(a,file='mytable.tab')