Free Statistics

of Irreproducible Research!

Author's title

Author*Unverified author*
R Software Modulerwasp_autocorrelation.wasp
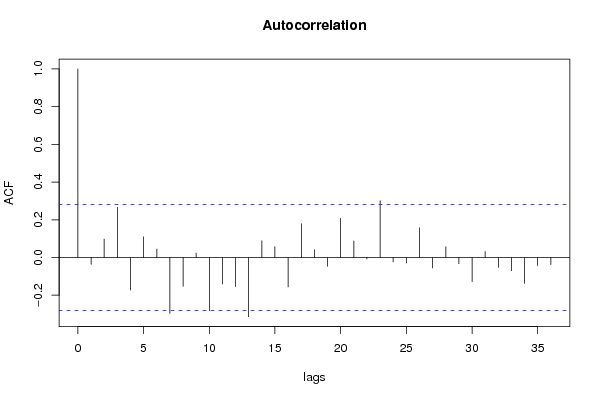
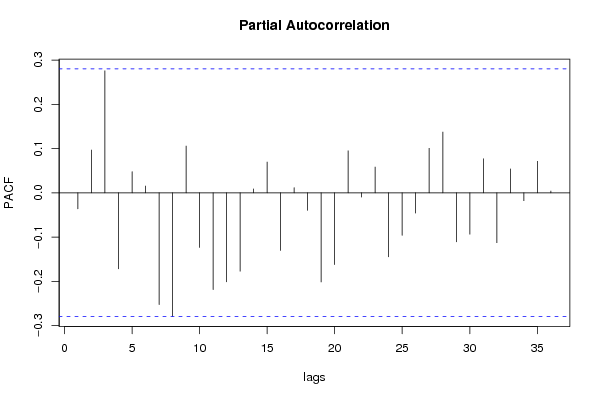
Title produced by software(Partial) Autocorrelation Function
Date of computationTue, 02 Dec 2008 05:22:21 -0700
Cite this page as followsStatistical Computations at FreeStatistics.org, Office for Research Development and Education, URL https://freestatistics.org/blog/index.php?v=date/2008/Dec/02/t1228220567nt2ki31su8hux2i.htm/, Retrieved Sun, 19 May 2024 10:21:00 +0000
Statistical Computations at FreeStatistics.org, Office for Research Development and Education, URL https://freestatistics.org/blog/index.php?pk=27661, Retrieved Sun, 19 May 2024 10:21:00 +0000
QR Codes:

Original text written by user:
IsPrivate?No (this computation is public)
User-defined keywords
Estimated Impact211
Family? (F = Feedback message, R = changed R code, M = changed R Module, P = changed Parameters, D = changed Data)
F     [Univariate Data Series] [Airline data] [2007-10-18 09:58:47] [42daae401fd3def69a25014f2252b4c2]
F RMPD  [Spectral Analysis] [Non Stationary Ti...] [2008-12-02 11:59:49] [74be16979710d4c4e7c6647856088456]
F RM D      [(Partial) Autocorrelation Function] [Non Stationary Ti...] [2008-12-02 12:22:21] [acca1d0ee7cc95ffc080d0867a313954] [Current]
-   PD        [(Partial) Autocorrelation Function] [autocorr1] [2008-12-24 12:30:47] [74be16979710d4c4e7c6647856088456]
-   PD        [(Partial) Autocorrelation Function] [autocorr2] [2008-12-24 12:43:10] [74be16979710d4c4e7c6647856088456]
Feedback Forum
2008-12-04 13:43:53 [Glenn Maras] [reply
Goed. De student heeft telken ACF en VRM uitgevoerd voor beide tijdreeksen. Ik zou dit anders aangepakt hebben en steeds eerst VRM berekend hebben zodat ik kon zien wat ik moest aanpassen voor ACF. Maar uiteindelijk klopt het bij deze student ook.

Post a new message
Dataseries X:
110.40
96.40
101.90
106.20
81.00
94.70
101.00
109.40
102.30
90.70
96.20
96.10
106.00
103.10
102.00
104.70
86.00
92.10
106.90
112.60
101.70
92.00
97.40
97.00
105.40
102.70
98.10
104.50
87.40
89.90
109.80
111.70
98.60
96.90
95.10
97.00
112.70
102.90
97.40
111.40
87.40
96.80
114.10
110.30
103.90
101.60
94.60
95.90
104.70
102.80
98.10
113.90
80.90
95.70
113.20
105.90
108.80
102.30
99.00
100.70
115.50


Summary of computational transaction
Raw Inputview raw input (R code)
Raw Outputview raw output of R engine
Computing time1 seconds
R Server'George Udny Yule' @ 72.249.76.132

\begin{tabular}{lllllllll}
\hline
Summary of computational transaction \tabularnewline
Raw Input & view raw input (R code)  \tabularnewline
Raw Output & view raw output of R engine  \tabularnewline
Computing time & 1 seconds \tabularnewline
R Server & 'George Udny Yule' @ 72.249.76.132 \tabularnewline
\hline
\end{tabular}
%Source: https://freestatistics.org/blog/index.php?pk=27661&T=0

[TABLE]
[ROW][C]Summary of computational transaction[/C][/ROW]
[ROW][C]Raw Input[/C][C]view raw input (R code) [/C][/ROW]
[ROW][C]Raw Output[/C][C]view raw output of R engine [/C][/ROW]
[ROW][C]Computing time[/C][C]1 seconds[/C][/ROW]
[ROW][C]R Server[/C][C]'George Udny Yule' @ 72.249.76.132[/C][/ROW]
[/TABLE]
Source: https://freestatistics.org/blog/index.php?pk=27661&T=0

Globally Unique Identifier (entire table): ba.freestatistics.org/blog/index.php?pk=27661&T=0

As an alternative you can also use a QR Code:  

The GUIDs for individual cells are displayed in the table below:

Summary of computational transaction
Raw Inputview raw input (R code)
Raw Outputview raw output of R engine
Computing time1 seconds
R Server'George Udny Yule' @ 72.249.76.132


Autocorrelation Function
Time lag kACF(k)T-STATP-value
1-0.036298-0.25410.400245
20.0977530.68430.248513
30.2662371.86370.034184
4-0.172635-1.20840.116338
50.1095490.76680.223427
60.044690.31280.377868
7-0.29752-2.08260.021263
8-0.152662-1.06860.145236
90.0232440.16270.435708
10-0.282113-1.97480.02697
11-0.140453-0.98320.165176
12-0.154458-1.08120.142449
13-0.313797-2.19660.016406
140.0883190.61820.269642
150.0571180.39980.345511
16-0.15635-1.09450.139554
170.178621.25030.108556
180.0404820.28340.389042
19-0.04687-0.32810.37212
200.2082491.45770.075646
210.0879110.61540.270577
22-0.00789-0.05520.478089
230.3012532.10880.02005
24-0.023656-0.16560.434579
25-0.029675-0.20770.418152
260.1572231.10060.138232
27-0.05572-0.390.349099
280.0572760.40090.345105
29-0.033047-0.23130.409012
30-0.127668-0.89370.187932
310.0312920.2190.413762
32-0.05263-0.36840.357077
33-0.07032-0.49220.312374
34-0.137685-0.96380.16994
35-0.04232-0.29620.384149
36-0.037384-0.26170.39733

\begin{tabular}{lllllllll}
\hline
Autocorrelation Function \tabularnewline
Time lag k & ACF(k) & T-STAT & P-value \tabularnewline
1 & -0.036298 & -0.2541 & 0.400245 \tabularnewline
2 & 0.097753 & 0.6843 & 0.248513 \tabularnewline
3 & 0.266237 & 1.8637 & 0.034184 \tabularnewline
4 & -0.172635 & -1.2084 & 0.116338 \tabularnewline
5 & 0.109549 & 0.7668 & 0.223427 \tabularnewline
6 & 0.04469 & 0.3128 & 0.377868 \tabularnewline
7 & -0.29752 & -2.0826 & 0.021263 \tabularnewline
8 & -0.152662 & -1.0686 & 0.145236 \tabularnewline
9 & 0.023244 & 0.1627 & 0.435708 \tabularnewline
10 & -0.282113 & -1.9748 & 0.02697 \tabularnewline
11 & -0.140453 & -0.9832 & 0.165176 \tabularnewline
12 & -0.154458 & -1.0812 & 0.142449 \tabularnewline
13 & -0.313797 & -2.1966 & 0.016406 \tabularnewline
14 & 0.088319 & 0.6182 & 0.269642 \tabularnewline
15 & 0.057118 & 0.3998 & 0.345511 \tabularnewline
16 & -0.15635 & -1.0945 & 0.139554 \tabularnewline
17 & 0.17862 & 1.2503 & 0.108556 \tabularnewline
18 & 0.040482 & 0.2834 & 0.389042 \tabularnewline
19 & -0.04687 & -0.3281 & 0.37212 \tabularnewline
20 & 0.208249 & 1.4577 & 0.075646 \tabularnewline
21 & 0.087911 & 0.6154 & 0.270577 \tabularnewline
22 & -0.00789 & -0.0552 & 0.478089 \tabularnewline
23 & 0.301253 & 2.1088 & 0.02005 \tabularnewline
24 & -0.023656 & -0.1656 & 0.434579 \tabularnewline
25 & -0.029675 & -0.2077 & 0.418152 \tabularnewline
26 & 0.157223 & 1.1006 & 0.138232 \tabularnewline
27 & -0.05572 & -0.39 & 0.349099 \tabularnewline
28 & 0.057276 & 0.4009 & 0.345105 \tabularnewline
29 & -0.033047 & -0.2313 & 0.409012 \tabularnewline
30 & -0.127668 & -0.8937 & 0.187932 \tabularnewline
31 & 0.031292 & 0.219 & 0.413762 \tabularnewline
32 & -0.05263 & -0.3684 & 0.357077 \tabularnewline
33 & -0.07032 & -0.4922 & 0.312374 \tabularnewline
34 & -0.137685 & -0.9638 & 0.16994 \tabularnewline
35 & -0.04232 & -0.2962 & 0.384149 \tabularnewline
36 & -0.037384 & -0.2617 & 0.39733 \tabularnewline
\hline
\end{tabular}
%Source: https://freestatistics.org/blog/index.php?pk=27661&T=1

[TABLE]
[ROW][C]Autocorrelation Function[/C][/ROW]
[ROW][C]Time lag k[/C][C]ACF(k)[/C][C]T-STAT[/C][C]P-value[/C][/ROW]
[ROW][C]1[/C][C]-0.036298[/C][C]-0.2541[/C][C]0.400245[/C][/ROW]
[ROW][C]2[/C][C]0.097753[/C][C]0.6843[/C][C]0.248513[/C][/ROW]
[ROW][C]3[/C][C]0.266237[/C][C]1.8637[/C][C]0.034184[/C][/ROW]
[ROW][C]4[/C][C]-0.172635[/C][C]-1.2084[/C][C]0.116338[/C][/ROW]
[ROW][C]5[/C][C]0.109549[/C][C]0.7668[/C][C]0.223427[/C][/ROW]
[ROW][C]6[/C][C]0.04469[/C][C]0.3128[/C][C]0.377868[/C][/ROW]
[ROW][C]7[/C][C]-0.29752[/C][C]-2.0826[/C][C]0.021263[/C][/ROW]
[ROW][C]8[/C][C]-0.152662[/C][C]-1.0686[/C][C]0.145236[/C][/ROW]
[ROW][C]9[/C][C]0.023244[/C][C]0.1627[/C][C]0.435708[/C][/ROW]
[ROW][C]10[/C][C]-0.282113[/C][C]-1.9748[/C][C]0.02697[/C][/ROW]
[ROW][C]11[/C][C]-0.140453[/C][C]-0.9832[/C][C]0.165176[/C][/ROW]
[ROW][C]12[/C][C]-0.154458[/C][C]-1.0812[/C][C]0.142449[/C][/ROW]
[ROW][C]13[/C][C]-0.313797[/C][C]-2.1966[/C][C]0.016406[/C][/ROW]
[ROW][C]14[/C][C]0.088319[/C][C]0.6182[/C][C]0.269642[/C][/ROW]
[ROW][C]15[/C][C]0.057118[/C][C]0.3998[/C][C]0.345511[/C][/ROW]
[ROW][C]16[/C][C]-0.15635[/C][C]-1.0945[/C][C]0.139554[/C][/ROW]
[ROW][C]17[/C][C]0.17862[/C][C]1.2503[/C][C]0.108556[/C][/ROW]
[ROW][C]18[/C][C]0.040482[/C][C]0.2834[/C][C]0.389042[/C][/ROW]
[ROW][C]19[/C][C]-0.04687[/C][C]-0.3281[/C][C]0.37212[/C][/ROW]
[ROW][C]20[/C][C]0.208249[/C][C]1.4577[/C][C]0.075646[/C][/ROW]
[ROW][C]21[/C][C]0.087911[/C][C]0.6154[/C][C]0.270577[/C][/ROW]
[ROW][C]22[/C][C]-0.00789[/C][C]-0.0552[/C][C]0.478089[/C][/ROW]
[ROW][C]23[/C][C]0.301253[/C][C]2.1088[/C][C]0.02005[/C][/ROW]
[ROW][C]24[/C][C]-0.023656[/C][C]-0.1656[/C][C]0.434579[/C][/ROW]
[ROW][C]25[/C][C]-0.029675[/C][C]-0.2077[/C][C]0.418152[/C][/ROW]
[ROW][C]26[/C][C]0.157223[/C][C]1.1006[/C][C]0.138232[/C][/ROW]
[ROW][C]27[/C][C]-0.05572[/C][C]-0.39[/C][C]0.349099[/C][/ROW]
[ROW][C]28[/C][C]0.057276[/C][C]0.4009[/C][C]0.345105[/C][/ROW]
[ROW][C]29[/C][C]-0.033047[/C][C]-0.2313[/C][C]0.409012[/C][/ROW]
[ROW][C]30[/C][C]-0.127668[/C][C]-0.8937[/C][C]0.187932[/C][/ROW]
[ROW][C]31[/C][C]0.031292[/C][C]0.219[/C][C]0.413762[/C][/ROW]
[ROW][C]32[/C][C]-0.05263[/C][C]-0.3684[/C][C]0.357077[/C][/ROW]
[ROW][C]33[/C][C]-0.07032[/C][C]-0.4922[/C][C]0.312374[/C][/ROW]
[ROW][C]34[/C][C]-0.137685[/C][C]-0.9638[/C][C]0.16994[/C][/ROW]
[ROW][C]35[/C][C]-0.04232[/C][C]-0.2962[/C][C]0.384149[/C][/ROW]
[ROW][C]36[/C][C]-0.037384[/C][C]-0.2617[/C][C]0.39733[/C][/ROW]
[/TABLE]
Source: https://freestatistics.org/blog/index.php?pk=27661&T=1

Globally Unique Identifier (entire table): ba.freestatistics.org/blog/index.php?pk=27661&T=1

As an alternative you can also use a QR Code:  

The GUIDs for individual cells are displayed in the table below:

Autocorrelation Function
Time lag kACF(k)T-STATP-value
1-0.036298-0.25410.400245
20.0977530.68430.248513
30.2662371.86370.034184
4-0.172635-1.20840.116338
50.1095490.76680.223427
60.044690.31280.377868
7-0.29752-2.08260.021263
8-0.152662-1.06860.145236
90.0232440.16270.435708
10-0.282113-1.97480.02697
11-0.140453-0.98320.165176
12-0.154458-1.08120.142449
13-0.313797-2.19660.016406
140.0883190.61820.269642
150.0571180.39980.345511
16-0.15635-1.09450.139554
170.178621.25030.108556
180.0404820.28340.389042
19-0.04687-0.32810.37212
200.2082491.45770.075646
210.0879110.61540.270577
22-0.00789-0.05520.478089
230.3012532.10880.02005
24-0.023656-0.16560.434579
25-0.029675-0.20770.418152
260.1572231.10060.138232
27-0.05572-0.390.349099
280.0572760.40090.345105
29-0.033047-0.23130.409012
30-0.127668-0.89370.187932
310.0312920.2190.413762
32-0.05263-0.36840.357077
33-0.07032-0.49220.312374
34-0.137685-0.96380.16994
35-0.04232-0.29620.384149
36-0.037384-0.26170.39733


Partial Autocorrelation Function
Time lag kPACF(k)T-STATP-value
1-0.036298-0.25410.400245
20.0965630.67590.251128
30.275881.93120.029629
4-0.171892-1.20320.117332
50.0477040.33390.36993
60.0153740.10760.457369
7-0.252777-1.76940.041522
8-0.279311-1.95520.028139
90.1055570.73890.231747
10-0.123598-0.86520.195576
11-0.218733-1.53110.066084
12-0.201145-1.4080.08272
13-0.177118-1.23980.110472
140.0086640.06060.475943
150.0694680.48630.314469
16-0.130399-0.91280.182911
170.0116150.08130.467767
18-0.039604-0.27720.391385
19-0.201566-1.4110.082287
20-0.162243-1.13570.130803
210.0950590.66540.254452
22-0.009701-0.06790.473067
230.0582660.40790.342577
24-0.14462-1.01230.158175
25-0.09605-0.67240.252259
26-0.045749-0.32020.375072
270.100540.70380.242451
280.1374430.96210.170362
29-0.110789-0.77550.220879
30-0.093478-0.65430.257974
310.0768430.53790.29654
32-0.112776-0.78940.216831
330.0539040.37730.35378
34-0.017867-0.12510.45049
350.0711740.49820.310281
360.0039090.02740.489139

\begin{tabular}{lllllllll}
\hline
Partial Autocorrelation Function \tabularnewline
Time lag k & PACF(k) & T-STAT & P-value \tabularnewline
1 & -0.036298 & -0.2541 & 0.400245 \tabularnewline
2 & 0.096563 & 0.6759 & 0.251128 \tabularnewline
3 & 0.27588 & 1.9312 & 0.029629 \tabularnewline
4 & -0.171892 & -1.2032 & 0.117332 \tabularnewline
5 & 0.047704 & 0.3339 & 0.36993 \tabularnewline
6 & 0.015374 & 0.1076 & 0.457369 \tabularnewline
7 & -0.252777 & -1.7694 & 0.041522 \tabularnewline
8 & -0.279311 & -1.9552 & 0.028139 \tabularnewline
9 & 0.105557 & 0.7389 & 0.231747 \tabularnewline
10 & -0.123598 & -0.8652 & 0.195576 \tabularnewline
11 & -0.218733 & -1.5311 & 0.066084 \tabularnewline
12 & -0.201145 & -1.408 & 0.08272 \tabularnewline
13 & -0.177118 & -1.2398 & 0.110472 \tabularnewline
14 & 0.008664 & 0.0606 & 0.475943 \tabularnewline
15 & 0.069468 & 0.4863 & 0.314469 \tabularnewline
16 & -0.130399 & -0.9128 & 0.182911 \tabularnewline
17 & 0.011615 & 0.0813 & 0.467767 \tabularnewline
18 & -0.039604 & -0.2772 & 0.391385 \tabularnewline
19 & -0.201566 & -1.411 & 0.082287 \tabularnewline
20 & -0.162243 & -1.1357 & 0.130803 \tabularnewline
21 & 0.095059 & 0.6654 & 0.254452 \tabularnewline
22 & -0.009701 & -0.0679 & 0.473067 \tabularnewline
23 & 0.058266 & 0.4079 & 0.342577 \tabularnewline
24 & -0.14462 & -1.0123 & 0.158175 \tabularnewline
25 & -0.09605 & -0.6724 & 0.252259 \tabularnewline
26 & -0.045749 & -0.3202 & 0.375072 \tabularnewline
27 & 0.10054 & 0.7038 & 0.242451 \tabularnewline
28 & 0.137443 & 0.9621 & 0.170362 \tabularnewline
29 & -0.110789 & -0.7755 & 0.220879 \tabularnewline
30 & -0.093478 & -0.6543 & 0.257974 \tabularnewline
31 & 0.076843 & 0.5379 & 0.29654 \tabularnewline
32 & -0.112776 & -0.7894 & 0.216831 \tabularnewline
33 & 0.053904 & 0.3773 & 0.35378 \tabularnewline
34 & -0.017867 & -0.1251 & 0.45049 \tabularnewline
35 & 0.071174 & 0.4982 & 0.310281 \tabularnewline
36 & 0.003909 & 0.0274 & 0.489139 \tabularnewline
\hline
\end{tabular}
%Source: https://freestatistics.org/blog/index.php?pk=27661&T=2

[TABLE]
[ROW][C]Partial Autocorrelation Function[/C][/ROW]
[ROW][C]Time lag k[/C][C]PACF(k)[/C][C]T-STAT[/C][C]P-value[/C][/ROW]
[ROW][C]1[/C][C]-0.036298[/C][C]-0.2541[/C][C]0.400245[/C][/ROW]
[ROW][C]2[/C][C]0.096563[/C][C]0.6759[/C][C]0.251128[/C][/ROW]
[ROW][C]3[/C][C]0.27588[/C][C]1.9312[/C][C]0.029629[/C][/ROW]
[ROW][C]4[/C][C]-0.171892[/C][C]-1.2032[/C][C]0.117332[/C][/ROW]
[ROW][C]5[/C][C]0.047704[/C][C]0.3339[/C][C]0.36993[/C][/ROW]
[ROW][C]6[/C][C]0.015374[/C][C]0.1076[/C][C]0.457369[/C][/ROW]
[ROW][C]7[/C][C]-0.252777[/C][C]-1.7694[/C][C]0.041522[/C][/ROW]
[ROW][C]8[/C][C]-0.279311[/C][C]-1.9552[/C][C]0.028139[/C][/ROW]
[ROW][C]9[/C][C]0.105557[/C][C]0.7389[/C][C]0.231747[/C][/ROW]
[ROW][C]10[/C][C]-0.123598[/C][C]-0.8652[/C][C]0.195576[/C][/ROW]
[ROW][C]11[/C][C]-0.218733[/C][C]-1.5311[/C][C]0.066084[/C][/ROW]
[ROW][C]12[/C][C]-0.201145[/C][C]-1.408[/C][C]0.08272[/C][/ROW]
[ROW][C]13[/C][C]-0.177118[/C][C]-1.2398[/C][C]0.110472[/C][/ROW]
[ROW][C]14[/C][C]0.008664[/C][C]0.0606[/C][C]0.475943[/C][/ROW]
[ROW][C]15[/C][C]0.069468[/C][C]0.4863[/C][C]0.314469[/C][/ROW]
[ROW][C]16[/C][C]-0.130399[/C][C]-0.9128[/C][C]0.182911[/C][/ROW]
[ROW][C]17[/C][C]0.011615[/C][C]0.0813[/C][C]0.467767[/C][/ROW]
[ROW][C]18[/C][C]-0.039604[/C][C]-0.2772[/C][C]0.391385[/C][/ROW]
[ROW][C]19[/C][C]-0.201566[/C][C]-1.411[/C][C]0.082287[/C][/ROW]
[ROW][C]20[/C][C]-0.162243[/C][C]-1.1357[/C][C]0.130803[/C][/ROW]
[ROW][C]21[/C][C]0.095059[/C][C]0.6654[/C][C]0.254452[/C][/ROW]
[ROW][C]22[/C][C]-0.009701[/C][C]-0.0679[/C][C]0.473067[/C][/ROW]
[ROW][C]23[/C][C]0.058266[/C][C]0.4079[/C][C]0.342577[/C][/ROW]
[ROW][C]24[/C][C]-0.14462[/C][C]-1.0123[/C][C]0.158175[/C][/ROW]
[ROW][C]25[/C][C]-0.09605[/C][C]-0.6724[/C][C]0.252259[/C][/ROW]
[ROW][C]26[/C][C]-0.045749[/C][C]-0.3202[/C][C]0.375072[/C][/ROW]
[ROW][C]27[/C][C]0.10054[/C][C]0.7038[/C][C]0.242451[/C][/ROW]
[ROW][C]28[/C][C]0.137443[/C][C]0.9621[/C][C]0.170362[/C][/ROW]
[ROW][C]29[/C][C]-0.110789[/C][C]-0.7755[/C][C]0.220879[/C][/ROW]
[ROW][C]30[/C][C]-0.093478[/C][C]-0.6543[/C][C]0.257974[/C][/ROW]
[ROW][C]31[/C][C]0.076843[/C][C]0.5379[/C][C]0.29654[/C][/ROW]
[ROW][C]32[/C][C]-0.112776[/C][C]-0.7894[/C][C]0.216831[/C][/ROW]
[ROW][C]33[/C][C]0.053904[/C][C]0.3773[/C][C]0.35378[/C][/ROW]
[ROW][C]34[/C][C]-0.017867[/C][C]-0.1251[/C][C]0.45049[/C][/ROW]
[ROW][C]35[/C][C]0.071174[/C][C]0.4982[/C][C]0.310281[/C][/ROW]
[ROW][C]36[/C][C]0.003909[/C][C]0.0274[/C][C]0.489139[/C][/ROW]
[/TABLE]
Source: https://freestatistics.org/blog/index.php?pk=27661&T=2

Globally Unique Identifier (entire table): ba.freestatistics.org/blog/index.php?pk=27661&T=2

As an alternative you can also use a QR Code:  

The GUIDs for individual cells are displayed in the table below:

Partial Autocorrelation Function
Time lag kPACF(k)T-STATP-value
1-0.036298-0.25410.400245
20.0965630.67590.251128
30.275881.93120.029629
4-0.171892-1.20320.117332
50.0477040.33390.36993
60.0153740.10760.457369
7-0.252777-1.76940.041522
8-0.279311-1.95520.028139
90.1055570.73890.231747
10-0.123598-0.86520.195576
11-0.218733-1.53110.066084
12-0.201145-1.4080.08272
13-0.177118-1.23980.110472
140.0086640.06060.475943
150.0694680.48630.314469
16-0.130399-0.91280.182911
170.0116150.08130.467767
18-0.039604-0.27720.391385
19-0.201566-1.4110.082287
20-0.162243-1.13570.130803
210.0950590.66540.254452
22-0.009701-0.06790.473067
230.0582660.40790.342577
24-0.14462-1.01230.158175
25-0.09605-0.67240.252259
26-0.045749-0.32020.375072
270.100540.70380.242451
280.1374430.96210.170362
29-0.110789-0.77550.220879
30-0.093478-0.65430.257974
310.0768430.53790.29654
32-0.112776-0.78940.216831
330.0539040.37730.35378
34-0.017867-0.12510.45049
350.0711740.49820.310281
360.0039090.02740.489139


Parameters (Session):
par1 = 36 ; par2 = -0.3 ; par3 = 1 ; par4 = 0 ; par5 = 12 ;
Parameters (R input):
par1 = 36 ; par2 = 1 ; par3 = 0 ; par4 = 1 ; par5 = 12 ;
R code (references can be found in the software module):
if (par1 == 'Default') {
par1 = 10*log10(length(x))
} else {
par1 <- as.numeric(par1)
}
par2 <- as.numeric(par2)
par3 <- as.numeric(par3)
par4 <- as.numeric(par4)
par5 <- as.numeric(par5)
if (par2 == 0) {
x <- log(x)
} else {
x <- (x ^ par2 - 1) / par2
}
if (par3 > 0) x <- diff(x,lag=1,difference=par3)
if (par4 > 0) x <- diff(x,lag=par5,difference=par4)
bitmap(file='pic1.png')
racf <- acf(x,par1,main='Autocorrelation',xlab='lags',ylab='ACF')
dev.off()
bitmap(file='pic2.png')
rpacf <- pacf(x,par1,main='Partial Autocorrelation',xlab='lags',ylab='PACF')
dev.off()
(myacf <- c(racf$acf))
(mypacf <- c(rpacf$acf))
lengthx <- length(x)
sqrtn <- sqrt(lengthx)
load(file='createtable')
a<-table.start()
a<-table.row.start(a)
a<-table.element(a,'Autocorrelation Function',4,TRUE)
a<-table.row.end(a)
a<-table.row.start(a)
a<-table.element(a,'Time lag k',header=TRUE)
a<-table.element(a,hyperlink('basics.htm','ACF(k)','click here for more information about the Autocorrelation Function'),header=TRUE)
a<-table.element(a,'T-STAT',header=TRUE)
a<-table.element(a,'P-value',header=TRUE)
a<-table.row.end(a)
for (i in 2:(par1+1)) {
a<-table.row.start(a)
a<-table.element(a,i-1,header=TRUE)
a<-table.element(a,round(myacf[i],6))
mytstat <- myacf[i]*sqrtn
a<-table.element(a,round(mytstat,4))
a<-table.element(a,round(1-pt(abs(mytstat),lengthx),6))
a<-table.row.end(a)
}
a<-table.end(a)
table.save(a,file='mytable.tab')
a<-table.start()
a<-table.row.start(a)
a<-table.element(a,'Partial Autocorrelation Function',4,TRUE)
a<-table.row.end(a)
a<-table.row.start(a)
a<-table.element(a,'Time lag k',header=TRUE)
a<-table.element(a,hyperlink('basics.htm','PACF(k)','click here for more information about the Partial Autocorrelation Function'),header=TRUE)
a<-table.element(a,'T-STAT',header=TRUE)
a<-table.element(a,'P-value',header=TRUE)
a<-table.row.end(a)
for (i in 1:par1) {
a<-table.row.start(a)
a<-table.element(a,i,header=TRUE)
a<-table.element(a,round(mypacf[i],6))
mytstat <- mypacf[i]*sqrtn
a<-table.element(a,round(mytstat,4))
a<-table.element(a,round(1-pt(abs(mytstat),lengthx),6))
a<-table.row.end(a)
}
a<-table.end(a)
table.save(a,file='mytable1.tab')