Free Statistics

of Irreproducible Research!

Author's title

Author*Unverified author*
R Software Modulerwasp_cross.wasp
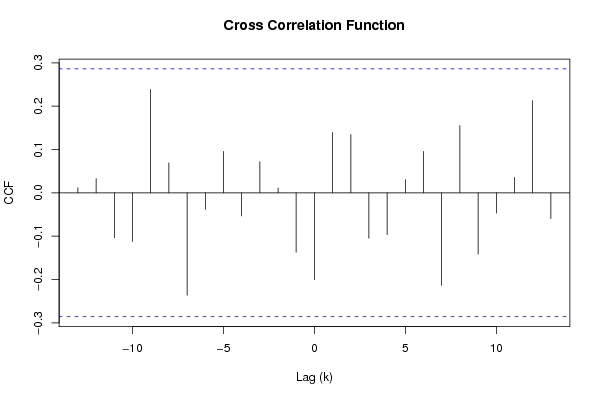
Title produced by softwareCross Correlation Function
Date of computationTue, 02 Dec 2008 04:13:28 -0700
Cite this page as followsStatistical Computations at FreeStatistics.org, Office for Research Development and Education, URL https://freestatistics.org/blog/index.php?v=date/2008/Dec/02/t1228216456qeqo20ddkcub0y1.htm/, Retrieved Sun, 19 May 2024 09:22:17 +0000
Statistical Computations at FreeStatistics.org, Office for Research Development and Education, URL https://freestatistics.org/blog/index.php?pk=27603, Retrieved Sun, 19 May 2024 09:22:17 +0000
QR Codes:

Original text written by user:
IsPrivate?No (this computation is public)
User-defined keywords
Estimated Impact189
Family? (F = Feedback message, R = changed R code, M = changed R Module, P = changed Parameters, D = changed Data)
F     [Law of Averages] [Random Walk Simul...] [2008-11-25 18:31:28] [b98453cac15ba1066b407e146608df68]
F RMPD    [Cross Correlation Function] [Workshop 4] [2008-12-02 11:13:28] [34b2bf1c29318ebc3536134756a32b87] [Current]
Feedback Forum
2008-12-06 19:18:13 [Stefan Temmerman] [reply
De student heeft de analyse goed uitgevoerd om de tijdreeks stationair te maken. Geen enkele correlatie bevindt zich nog boven het betrouwheidsinterval, en dus voorspelt X(t) niet meer Y(t).
2008-12-08 20:06:15 [An Knapen] [reply
Bij deze vraag heeft de student duidelijk vermeld welke waarden de parameters hebben. lambda =1 d=1 en D=1
We kunnen duidelijk zien dat de correlatie positief als negatief kan zijn. De staafjes liggen nu echter wel binnen het betrouwbaarheidsinterval. Dit resultaat heeft men bekomen door seizoenaal en niet-seizoenaal te differentiëren. De lange termijn trend en de seizoenaliteit zijn volledig verdwenen

Post a new message
Dataseries X:
87.0
96.3
107.1
115.2
106.1
89.5
91.3
97.6
100.7
104.6
94.7
101.8
102.5
105.3
110.3
109.8
117.3
118.8
131.3
125.9
133.1
147.0
145.8
164.4
149.8
137.7
151.7
156.8
180.0
180.4
170.4
191.6
199.5
218.2
217.5
205.0
194.0
199.3
219.3
211.1
215.2
240.2
242.2
240.7
255.4
253.0
218.2
203.7
205.6
215.6
188.5
202.9
214.0
230.3
230.0
241.0
259.6
247.8
270.3
289.7
Dataseries Y:
106.7
101.1
97.8
113.8
107.1
117.5
113.7
106.6
109.8
108.8
102.0
114.5
116.5
108.6
113.9
109.3
112.5
123.4
115.2
110.8
120.4
117.6
111.2
131.1
118.9
115.7
119.6
113.1
106.4
115.5
111.8
109.6
121.5
109.5
109.0
113.4
112.7
114.4
109.2
116.2
113.8
123.6
112.6
117.7
113.3
110.7
114.7
116.9
120.6
111.6
111.9
116.1
111.9
125.1
115.1
116.7
115.8
116.8
113.0
106.5


Summary of computational transaction
Raw Inputview raw input (R code)
Raw Outputview raw output of R engine
Computing time1 seconds
R Server'Gwilym Jenkins' @ 72.249.127.135

\begin{tabular}{lllllllll}
\hline
Summary of computational transaction \tabularnewline
Raw Input & view raw input (R code)  \tabularnewline
Raw Output & view raw output of R engine  \tabularnewline
Computing time & 1 seconds \tabularnewline
R Server & 'Gwilym Jenkins' @ 72.249.127.135 \tabularnewline
\hline
\end{tabular}
%Source: https://freestatistics.org/blog/index.php?pk=27603&T=0

[TABLE]
[ROW][C]Summary of computational transaction[/C][/ROW]
[ROW][C]Raw Input[/C][C]view raw input (R code) [/C][/ROW]
[ROW][C]Raw Output[/C][C]view raw output of R engine [/C][/ROW]
[ROW][C]Computing time[/C][C]1 seconds[/C][/ROW]
[ROW][C]R Server[/C][C]'Gwilym Jenkins' @ 72.249.127.135[/C][/ROW]
[/TABLE]
Source: https://freestatistics.org/blog/index.php?pk=27603&T=0

Globally Unique Identifier (entire table): ba.freestatistics.org/blog/index.php?pk=27603&T=0

As an alternative you can also use a QR Code:  

The GUIDs for individual cells are displayed in the table below:

Summary of computational transaction
Raw Inputview raw input (R code)
Raw Outputview raw output of R engine
Computing time1 seconds
R Server'Gwilym Jenkins' @ 72.249.127.135


Cross Correlation Function
ParameterValue
Box-Cox transformation parameter (lambda) of X series1
Degree of non-seasonal differencing (d) of X series1
Degree of seasonal differencing (D) of X series1
Seasonal Period (s)12
Box-Cox transformation parameter (lambda) of Y series1
Degree of non-seasonal differencing (d) of Y series1
Degree of seasonal differencing (D) of Y series1
krho(Y[t],X[t+k])
-130.0115773515609963
-120.0326307264809896
-11-0.103695699644002
-10-0.112176822713199
-90.238404019107931
-80.0689235520610102
-7-0.236212198281189
-6-0.0381334364921076
-50.0955768711877626
-4-0.05331431975496
-30.0718477408493209
-20.0111436222256402
-1-0.136974556861736
0-0.200434422235479
10.139252429951621
20.134330143265683
3-0.104629309979149
4-0.0963682278946863
50.0306331147543409
60.0956149545810556
7-0.21397512667486
80.15517978013441
9-0.141426359686365
10-0.0467547712714196
110.0354401789184439
120.212639226060947
13-0.059430285837986

\begin{tabular}{lllllllll}
\hline
Cross Correlation Function \tabularnewline
Parameter & Value \tabularnewline
Box-Cox transformation parameter (lambda) of X series & 1 \tabularnewline
Degree of non-seasonal differencing (d) of X series & 1 \tabularnewline
Degree of seasonal differencing (D) of X series & 1 \tabularnewline
Seasonal Period (s) & 12 \tabularnewline
Box-Cox transformation parameter (lambda) of Y series & 1 \tabularnewline
Degree of non-seasonal differencing (d) of Y series & 1 \tabularnewline
Degree of seasonal differencing (D) of Y series & 1 \tabularnewline
k & rho(Y[t],X[t+k]) \tabularnewline
-13 & 0.0115773515609963 \tabularnewline
-12 & 0.0326307264809896 \tabularnewline
-11 & -0.103695699644002 \tabularnewline
-10 & -0.112176822713199 \tabularnewline
-9 & 0.238404019107931 \tabularnewline
-8 & 0.0689235520610102 \tabularnewline
-7 & -0.236212198281189 \tabularnewline
-6 & -0.0381334364921076 \tabularnewline
-5 & 0.0955768711877626 \tabularnewline
-4 & -0.05331431975496 \tabularnewline
-3 & 0.0718477408493209 \tabularnewline
-2 & 0.0111436222256402 \tabularnewline
-1 & -0.136974556861736 \tabularnewline
0 & -0.200434422235479 \tabularnewline
1 & 0.139252429951621 \tabularnewline
2 & 0.134330143265683 \tabularnewline
3 & -0.104629309979149 \tabularnewline
4 & -0.0963682278946863 \tabularnewline
5 & 0.0306331147543409 \tabularnewline
6 & 0.0956149545810556 \tabularnewline
7 & -0.21397512667486 \tabularnewline
8 & 0.15517978013441 \tabularnewline
9 & -0.141426359686365 \tabularnewline
10 & -0.0467547712714196 \tabularnewline
11 & 0.0354401789184439 \tabularnewline
12 & 0.212639226060947 \tabularnewline
13 & -0.059430285837986 \tabularnewline
\hline
\end{tabular}
%Source: https://freestatistics.org/blog/index.php?pk=27603&T=1

[TABLE]
[ROW][C]Cross Correlation Function[/C][/ROW]
[ROW][C]Parameter[/C][C]Value[/C][/ROW]
[ROW][C]Box-Cox transformation parameter (lambda) of X series[/C][C]1[/C][/ROW]
[ROW][C]Degree of non-seasonal differencing (d) of X series[/C][C]1[/C][/ROW]
[ROW][C]Degree of seasonal differencing (D) of X series[/C][C]1[/C][/ROW]
[ROW][C]Seasonal Period (s)[/C][C]12[/C][/ROW]
[ROW][C]Box-Cox transformation parameter (lambda) of Y series[/C][C]1[/C][/ROW]
[ROW][C]Degree of non-seasonal differencing (d) of Y series[/C][C]1[/C][/ROW]
[ROW][C]Degree of seasonal differencing (D) of Y series[/C][C]1[/C][/ROW]
[ROW][C]k[/C][C]rho(Y[t],X[t+k])[/C][/ROW]
[ROW][C]-13[/C][C]0.0115773515609963[/C][/ROW]
[ROW][C]-12[/C][C]0.0326307264809896[/C][/ROW]
[ROW][C]-11[/C][C]-0.103695699644002[/C][/ROW]
[ROW][C]-10[/C][C]-0.112176822713199[/C][/ROW]
[ROW][C]-9[/C][C]0.238404019107931[/C][/ROW]
[ROW][C]-8[/C][C]0.0689235520610102[/C][/ROW]
[ROW][C]-7[/C][C]-0.236212198281189[/C][/ROW]
[ROW][C]-6[/C][C]-0.0381334364921076[/C][/ROW]
[ROW][C]-5[/C][C]0.0955768711877626[/C][/ROW]
[ROW][C]-4[/C][C]-0.05331431975496[/C][/ROW]
[ROW][C]-3[/C][C]0.0718477408493209[/C][/ROW]
[ROW][C]-2[/C][C]0.0111436222256402[/C][/ROW]
[ROW][C]-1[/C][C]-0.136974556861736[/C][/ROW]
[ROW][C]0[/C][C]-0.200434422235479[/C][/ROW]
[ROW][C]1[/C][C]0.139252429951621[/C][/ROW]
[ROW][C]2[/C][C]0.134330143265683[/C][/ROW]
[ROW][C]3[/C][C]-0.104629309979149[/C][/ROW]
[ROW][C]4[/C][C]-0.0963682278946863[/C][/ROW]
[ROW][C]5[/C][C]0.0306331147543409[/C][/ROW]
[ROW][C]6[/C][C]0.0956149545810556[/C][/ROW]
[ROW][C]7[/C][C]-0.21397512667486[/C][/ROW]
[ROW][C]8[/C][C]0.15517978013441[/C][/ROW]
[ROW][C]9[/C][C]-0.141426359686365[/C][/ROW]
[ROW][C]10[/C][C]-0.0467547712714196[/C][/ROW]
[ROW][C]11[/C][C]0.0354401789184439[/C][/ROW]
[ROW][C]12[/C][C]0.212639226060947[/C][/ROW]
[ROW][C]13[/C][C]-0.059430285837986[/C][/ROW]
[/TABLE]
Source: https://freestatistics.org/blog/index.php?pk=27603&T=1

Globally Unique Identifier (entire table): ba.freestatistics.org/blog/index.php?pk=27603&T=1

As an alternative you can also use a QR Code:  

The GUIDs for individual cells are displayed in the table below:

Cross Correlation Function
ParameterValue
Box-Cox transformation parameter (lambda) of X series1
Degree of non-seasonal differencing (d) of X series1
Degree of seasonal differencing (D) of X series1
Seasonal Period (s)12
Box-Cox transformation parameter (lambda) of Y series1
Degree of non-seasonal differencing (d) of Y series1
Degree of seasonal differencing (D) of Y series1
krho(Y[t],X[t+k])
-130.0115773515609963
-120.0326307264809896
-11-0.103695699644002
-10-0.112176822713199
-90.238404019107931
-80.0689235520610102
-7-0.236212198281189
-6-0.0381334364921076
-50.0955768711877626
-4-0.05331431975496
-30.0718477408493209
-20.0111436222256402
-1-0.136974556861736
0-0.200434422235479
10.139252429951621
20.134330143265683
3-0.104629309979149
4-0.0963682278946863
50.0306331147543409
60.0956149545810556
7-0.21397512667486
80.15517978013441
9-0.141426359686365
10-0.0467547712714196
110.0354401789184439
120.212639226060947
13-0.059430285837986


Parameters (Session):
par1 = 1 ; par2 = 1 ; par3 = 1 ; par4 = 12 ; par5 = 1 ; par6 = 1 ; par7 = 1 ;
Parameters (R input):
par1 = 1 ; par2 = 1 ; par3 = 1 ; par4 = 12 ; par5 = 1 ; par6 = 1 ; par7 = 1 ;
R code (references can be found in the software module):
par1 <- as.numeric(par1)
par2 <- as.numeric(par2)
par3 <- as.numeric(par3)
par4 <- as.numeric(par4)
par5 <- as.numeric(par5)
par6 <- as.numeric(par6)
par7 <- as.numeric(par7)
if (par1 == 0) {
x <- log(x)
} else {
x <- (x ^ par1 - 1) / par1
}
if (par5 == 0) {
y <- log(y)
} else {
y <- (y ^ par5 - 1) / par5
}
if (par2 > 0) x <- diff(x,lag=1,difference=par2)
if (par6 > 0) y <- diff(y,lag=1,difference=par6)
if (par3 > 0) x <- diff(x,lag=par4,difference=par3)
if (par7 > 0) y <- diff(y,lag=par4,difference=par7)
x
y
bitmap(file='test1.png')
(r <- ccf(x,y,main='Cross Correlation Function',ylab='CCF',xlab='Lag (k)'))
dev.off()
load(file='createtable')
a<-table.start()
a<-table.row.start(a)
a<-table.element(a,'Cross Correlation Function',2,TRUE)
a<-table.row.end(a)
a<-table.row.start(a)
a<-table.element(a,'Parameter',header=TRUE)
a<-table.element(a,'Value',header=TRUE)
a<-table.row.end(a)
a<-table.row.start(a)
a<-table.element(a,'Box-Cox transformation parameter (lambda) of X series',header=TRUE)
a<-table.element(a,par1)
a<-table.row.end(a)
a<-table.row.start(a)
a<-table.element(a,'Degree of non-seasonal differencing (d) of X series',header=TRUE)
a<-table.element(a,par2)
a<-table.row.end(a)
a<-table.row.start(a)
a<-table.element(a,'Degree of seasonal differencing (D) of X series',header=TRUE)
a<-table.element(a,par3)
a<-table.row.end(a)
a<-table.row.start(a)
a<-table.element(a,'Seasonal Period (s)',header=TRUE)
a<-table.element(a,par4)
a<-table.row.end(a)
a<-table.row.start(a)
a<-table.element(a,'Box-Cox transformation parameter (lambda) of Y series',header=TRUE)
a<-table.element(a,par5)
a<-table.row.end(a)
a<-table.row.start(a)
a<-table.element(a,'Degree of non-seasonal differencing (d) of Y series',header=TRUE)
a<-table.element(a,par6)
a<-table.row.end(a)
a<-table.row.start(a)
a<-table.element(a,'Degree of seasonal differencing (D) of Y series',header=TRUE)
a<-table.element(a,par7)
a<-table.row.end(a)
a<-table.row.start(a)
a<-table.element(a,'k',header=TRUE)
a<-table.element(a,'rho(Y[t],X[t+k])',header=TRUE)
a<-table.row.end(a)
mylength <- length(r$acf)
myhalf <- floor((mylength-1)/2)
for (i in 1:mylength) {
a<-table.row.start(a)
a<-table.element(a,i-myhalf-1,header=TRUE)
a<-table.element(a,r$acf[i])
a<-table.row.end(a)
}
a<-table.end(a)
table.save(a,file='mytable.tab')