Free Statistics
of Irreproducible Research!
Description of Statistical Computation | |
|---|---|
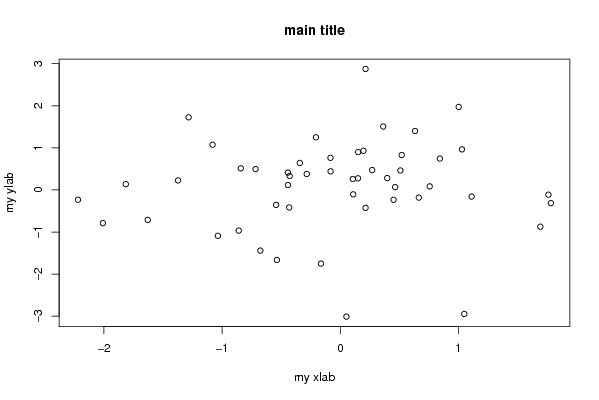
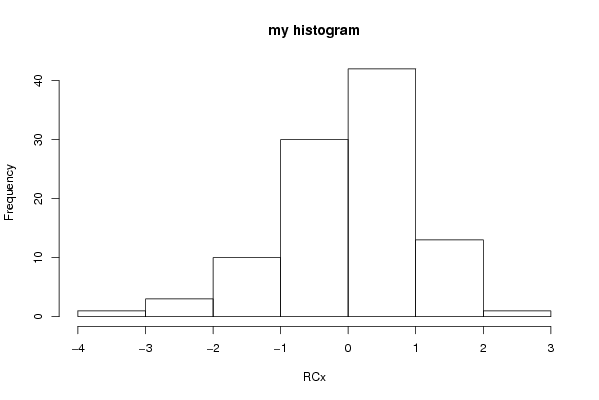
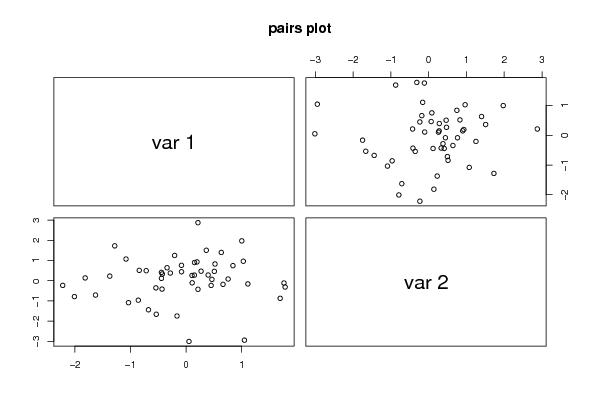
| Author's title | my R test (plot 11 - three different plots with parameters and double quote... |
| Author | *The author of this computation has been verified* |
| R Software Module | Rscript (source code is shown below) |
| Title produced by software | R console |
| Date of computation | Sun, 31 Aug 2008 12:12:21 -0600 |
| Cite this page as follows | Statistical Computations at FreeStatistics.org, Office for Research Development and Education, URL https://freestatistics.org/blog/index.php?v=date/2008/Aug/31/t12202063425cp21tnpe8t6l7e.htm/, Retrieved Sun, 06 Jul 2025 00:33:00 +0000 |
| Statistical Computations at FreeStatistics.org, Office for Research Development and Education, URL https://freestatistics.org/blog/index.php?pk=14302, Retrieved Sun, 06 Jul 2025 00:33:00 +0000 | |
| QR Codes: | |
|
| |
| Original text written by user: | no comments |
| IsPrivate? | No (this computation is public) |
| User-defined keywords | key1,key2 |
| Estimated Impact | 351 |
Tree of Dependent Computations | |
| Family? (F = Feedback message, R = changed R code, M = changed R Module, P = changed Parameters, D = changed Data) | |
| - [R console] [my R test (plot 1...] [2008-08-31 18:12:21] [d41d8cd98f00b204e9800998ecf8427e] [Current] | |
| Feedback Forum | |
Post a new message | |
Dataset | |
| Dataseries X: | |
0.755506700747719 0.0851082842655211 -0.443701304563204 0.412131801946146 1.02814979526386 0.965037053103135 -0.859868202279079 -0.965356941598173 0.105407579713154 0.260417565026123 -1.28348286848513 1.72669125512588 0.663234387450732 -0.180960663176317 -0.537147696599018 -1.66322864005866 -0.284407392295713 0.379610262451735 -1.81489864650011 0.138562925902487 1.11015251028106 -0.157742645977232 0.449809611605366 -0.232778730258889 -0.164096484229526 -1.74815923343626 1.04816788785818 -2.94510991971846 -2.00817422625650 -0.787682237987884 0.108612419516412 -0.104400858092734 -1.37287051724349 0.226893027431059 -0.842646790326904 0.513428961091227 0.195003096172567 0.93053707292884 0.148924123984243 0.27712282926655 1.69100837561122 -0.872617125624594 -0.717309411782577 0.49629976598919 -1.03623567130602 -1.08836056006975 -0.443349149519861 0.117218811115490 1.00069977958200 1.97360266249217 -1.08085808112898 1.07455632687906 0.396270593118794 0.282367023934156 0.212773533292306 -0.425048669838062 -2.21947359020641 -0.231987846278417 -0.343193791917147 0.642355268765414 0.841332537392 0.746463374455384 0.51879399538194 0.82892386949306 -0.206990846216180 1.25116518371023 -1.62920400266537 -0.71012677836016 -0.428791938818935 0.331988395132146 1.75912360921667 -0.112687596050873 -0.432928720448203 -0.415530451634218 0.268966389010268 0.472364345116046 0.212520462376322 2.87547989735923 -0.083712653320412 0.763810032322704 0.362546871568487 1.50787687819057 0.051102637910422 -3.00994872729811 0.463496469137284 0.0673572487499338 -0.543659932957087 -0.355132881704747 1.78004150977902 -0.312954054024261 0.507510706793902 0.463031767881967 -0.0826960154269678 0.443535663520492 0.632101969971764 1.40056374880210 -0.676829804259727 -1.44052137083098 0.150723433612993 0.90113429895861 | |
Tables (Output of Computation) | |
> first_number = 5

> second_number = 7

> strpar = 'hello'

> {
+     myfun <- function(x, y) {
+             x + y
+         }
+
+     print(myfun(first_number, second_number))
+     print(strpar)
+     print .... [TRUNCATED]
[1] 12
[1] 'hello'
             [,1]        [,2]
 [1,]  0.75550670  0.08510828
 [2,] -0.44370130  0.41213180
 [3,]  1.02814980  0.96503705
 [4,] -0.85986820 -0.96535694
 [5,]  0.10540758  0.26041757
 [6,] -1.28348287  1.72669126
 [7,]  0.66323439 -0.18096066
 [8,] -0.53714770 -1.66322864
 [9,] -0.28440739  0.37961026
[10,] -1.81489865  0.13856293
[11,]  1.11015251 -0.15774265
[12,]  0.44980961 -0.23277873
[13,] -0.16409648 -1.74815923
[14,]  1.04816789 -2.94510992
[15,] -2.00817423 -0.78768224
[16,]  0.10861242 -0.10440086
[17,] -1.37287052  0.22689303
[18,] -0.84264679  0.51342896
[19,]  0.19500310  0.93053707
[20,]  0.14892412  0.27712283
[21,]  1.69100838 -0.87261713
[22,] -0.71730941  0.49629977
[23,] -1.03623567 -1.08836056
[24,] -0.44334915  0.11721881
[25,]  1.00069978  1.97360266
[26,] -1.08085808  1.07455633
[27,]  0.39627059  0.28236702
[28,]  0.21277353 -0.42504867
[29,] -2.21947359 -0.23198785
[30,] -0.34319379  0.64235527
[31,]  0.84133254  0.74646337
[32,]  0.51879400  0.82892387
[33,] -0.20699085  1.25116518
[34,] -1.62920400 -0.71012678
[35,] -0.42879194  0.33198840
[36,]  1.75912361 -0.11268760
[37,] -0.43292872 -0.41553045
[38,]  0.26896639  0.47236435
[39,]  0.21252046  2.87547990
[40,] -0.08371265  0.76381003
[41,]  0.36254687  1.50787688
[42,]  0.05110264 -3.00994873
[43,]  0.46349647  0.06735725
[44,] -0.54365993 -0.35513288
[45,]  1.78004151 -0.31295405
[46,]  0.50751071  0.46303177
[47,] -0.08269602  0.44353566
[48,]  0.63210197  1.40056375
[49,] -0.67682980 -1.44052137
[50,]  0.15072343  0.90113430
| |
Figures (Output of Computation) | |
Input Parameters & R Code | |
| Parameters (Session): | |
| par1 = 5 ; par2 = 7 ; par3 = hello ; | |
| Parameters (R input): | |
| R code (body of R function): | |
{ | |