Free Statistics
of Irreproducible Research!
Description of Statistical Computation | |
|---|---|
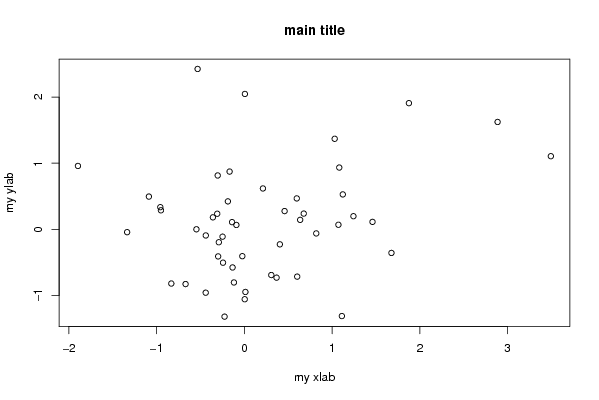
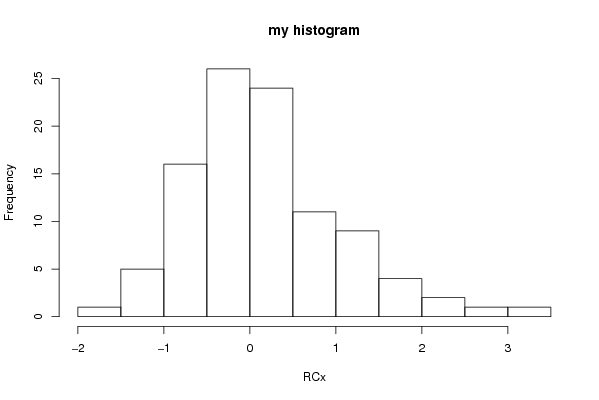
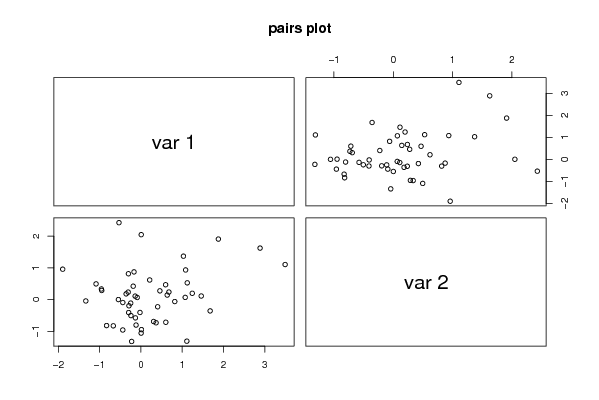
| Author's title | my R test (plot 10 - three different plots with parameters and single quote... |
| Author | *The author of this computation has been verified* |
| R Software Module | Rscript (source code is shown below) |
| Title produced by software | R console |
| Date of computation | Sun, 31 Aug 2008 12:09:12 -0600 |
| Cite this page as follows | Statistical Computations at FreeStatistics.org, Office for Research Development and Education, URL https://freestatistics.org/blog/index.php?v=date/2008/Aug/31/t12202061530qkexdj1vw7kuib.htm/, Retrieved Tue, 14 May 2024 14:14:15 +0000 |
| Statistical Computations at FreeStatistics.org, Office for Research Development and Education, URL https://freestatistics.org/blog/index.php?pk=14301, Retrieved Tue, 14 May 2024 14:14:15 +0000 | |
| QR Codes: | |
|
| |
| Original text written by user: | no comments |
| IsPrivate? | No (this computation is public) |
| User-defined keywords | key1,key2 |
| Estimated Impact | 292 |
Tree of Dependent Computations | |
| Family? (F = Feedback message, R = changed R code, M = changed R Module, P = changed Parameters, D = changed Data) | |
| - [R console] [my R test (plot 1...] [2008-08-31 18:09:12] [d41d8cd98f00b204e9800998ecf8427e] [Current] | |
| Feedback Forum | |
Post a new message | |
Dataset | |
| Dataseries X: | |
-0.30850063002946 0.235690519607183 1.02998633759889 1.36998791665622 0.307616211471887 -0.69191159630566 0.597880685842531 0.467786399905715 0.636642187716227 0.143180854108975 -0.949538895160241 0.287827771665905 -0.545462225836775 0.00061919739534872 0.212406106622606 0.618325956495591 1.07234957475204 0.0690185414160711 -1.33485033920062 -0.0432027868514195 0.405262691603608 -0.22704238896552 0.367679455464446 -0.731538683346782 -0.95700912707537 0.335014397169873 1.12226764813434 0.528273859788456 0.60269500711016 -0.715850160679145 -0.302778118640591 0.814957736122538 -1.08697021876775 0.495462392751932 -0.0226440092090542 -0.406574999456074 -0.118014552012578 -0.804246672991666 1.87577074174305 1.90922888861931 0.459149726405488 0.276076053329195 -0.133595194678429 -0.577097535386539 1.11180142747632 -1.31253924126054 -0.35774336242126 0.181230267908022 2.88600753038899 1.6246757894181 -0.290200681071401 -0.195438751018916 -0.669008309103209 -0.82828912563579 -0.247620616027447 -0.111404965351762 -0.224780664706128 -1.32155302689872 -1.89510427697632 0.958920622445493 -0.831533259045418 -0.820383417026583 -0.139396564467797 0.108895931812245 -0.531810678072031 2.42694330094828 -0.297755894090094 -0.4099278066237 1.4609533330827 0.112669490563462 -0.242394184147378 -0.505150155579756 -0.186932987841735 0.422787507653977 -0.0901753370224382 0.0661895138661982 0.0128251277262595 -0.947752099415719 1.67675197715263 -0.357337717895593 0.00507042385000422 -1.05808520472265 1.08203163385156 0.934815938778705 3.49276196922723 1.10641100606363 1.24349989059160 0.198445859558979 0.81987099887284 -0.062005031118909 0.00722088584946117 2.04850980368231 -0.438568685508049 -0.0928159294487011 -0.167264823018045 0.873851932842923 0.67731851931836 0.238054428444875 -0.439494928670261 -0.959141460722206 | |
Tables (Output of Computation) | |
> first_number = 5

> second_number = 7

> strpar = 'hello'

> {
+     myfun <- function(x, y) {
+             x + y
+         }
+
+     print(myfun(first_number, second_number))
+     print(strpar)
+     print .... [TRUNCATED]
[1] 12
[1] 'hello'
              [,1]          [,2]
 [1,] -0.308500630  0.2356905196
 [2,]  1.029986338  1.3699879167
 [3,]  0.307616211 -0.6919115963
 [4,]  0.597880686  0.4677863999
 [5,]  0.636642188  0.1431808541
 [6,] -0.949538895  0.2878277717
 [7,] -0.545462226  0.0006191974
 [8,]  0.212406107  0.6183259565
 [9,]  1.072349575  0.0690185414
[10,] -1.334850339 -0.0432027869
[11,]  0.405262692 -0.2270423890
[12,]  0.367679455 -0.7315386833
[13,] -0.957009127  0.3350143972
[14,]  1.122267648  0.5282738598
[15,]  0.602695007 -0.7158501607
[16,] -0.302778119  0.8149577361
[17,] -1.086970219  0.4954623928
[18,] -0.022644009 -0.4065749995
[19,] -0.118014552 -0.8042466730
[20,]  1.875770742  1.9092288886
[21,]  0.459149726  0.2760760533
[22,] -0.133595195 -0.5770975354
[23,]  1.111801427 -1.3125392413
[24,] -0.357743362  0.1812302679
[25,]  2.886007530  1.6246757894
[26,] -0.290200681 -0.1954387510
[27,] -0.669008309 -0.8282891256
[28,] -0.247620616 -0.1114049654
[29,] -0.224780665 -1.3215530269
[30,] -1.895104277  0.9589206224
[31,] -0.831533259 -0.8203834170
[32,] -0.139396564  0.1088959318
[33,] -0.531810678  2.4269433009
[34,] -0.297755894 -0.4099278066
[35,]  1.460953333  0.1126694906
[36,] -0.242394184 -0.5051501556
[37,] -0.186932988  0.4227875077
[38,] -0.090175337  0.0661895139
[39,]  0.012825128 -0.9477520994
[40,]  1.676751977 -0.3573377179
[41,]  0.005070424 -1.0580852047
[42,]  1.082031634  0.9348159388
[43,]  3.492761969  1.1064110061
[44,]  1.243499891  0.1984458596
[45,]  0.819870999 -0.0620050311
[46,]  0.007220886  2.0485098037
[47,] -0.438568686 -0.0928159294
[48,] -0.167264823  0.8738519328
[49,]  0.677318519  0.2380544284
[50,] -0.439494929 -0.9591414607
| |
Figures (Output of Computation) | |
Input Parameters & R Code | |
| Parameters (Session): | |
| par1 = 5 ; par2 = 7 ; par3 = hello ; | |
| Parameters (R input): | |
| R code (body of R function): | |
{ | |