Free Statistics
of Irreproducible Research!
Description of Statistical Computation | |||||||||||||||||||||||||||||||||||||||||
|---|---|---|---|---|---|---|---|---|---|---|---|---|---|---|---|---|---|---|---|---|---|---|---|---|---|---|---|---|---|---|---|---|---|---|---|---|---|---|---|---|---|
| Author's title | |||||||||||||||||||||||||||||||||||||||||
| Author | *Unverified author* | ||||||||||||||||||||||||||||||||||||||||
| R Software Module | rwasp_univariatedataseries.wasp | ||||||||||||||||||||||||||||||||||||||||
| Title produced by software | Univariate Data Series | ||||||||||||||||||||||||||||||||||||||||
| Date of computation | Thu, 14 Aug 2008 04:43:38 -0600 | ||||||||||||||||||||||||||||||||||||||||
| Cite this page as follows | Statistical Computations at FreeStatistics.org, Office for Research Development and Education, URL https://freestatistics.org/blog/index.php?v=date/2008/Aug/14/t1218710712rpbub5iwlphy3nq.htm/, Retrieved Tue, 14 May 2024 07:24:13 +0000 | ||||||||||||||||||||||||||||||||||||||||
| Statistical Computations at FreeStatistics.org, Office for Research Development and Education, URL https://freestatistics.org/blog/index.php?pk=14039, Retrieved Tue, 14 May 2024 07:24:13 +0000 | |||||||||||||||||||||||||||||||||||||||||
| QR Codes: | |||||||||||||||||||||||||||||||||||||||||
|
| |||||||||||||||||||||||||||||||||||||||||
| Original text written by user: | |||||||||||||||||||||||||||||||||||||||||
| IsPrivate? | No (this computation is public) | ||||||||||||||||||||||||||||||||||||||||
| User-defined keywords | |||||||||||||||||||||||||||||||||||||||||
| Estimated Impact | 283 | ||||||||||||||||||||||||||||||||||||||||
Tree of Dependent Computations | |||||||||||||||||||||||||||||||||||||||||
| Family? (F = Feedback message, R = changed R code, M = changed R Module, P = changed Parameters, D = changed Data) | |||||||||||||||||||||||||||||||||||||||||
| - [Univariate Data Series] [Grafische voorste...] [2008-08-14 10:43:38] [0d1085ed835696cdd537ad5fa07600ec] [Current] | |||||||||||||||||||||||||||||||||||||||||
| Feedback Forum | |||||||||||||||||||||||||||||||||||||||||
Post a new message | |||||||||||||||||||||||||||||||||||||||||
Dataset | |||||||||||||||||||||||||||||||||||||||||
| Dataseries X: | |||||||||||||||||||||||||||||||||||||||||
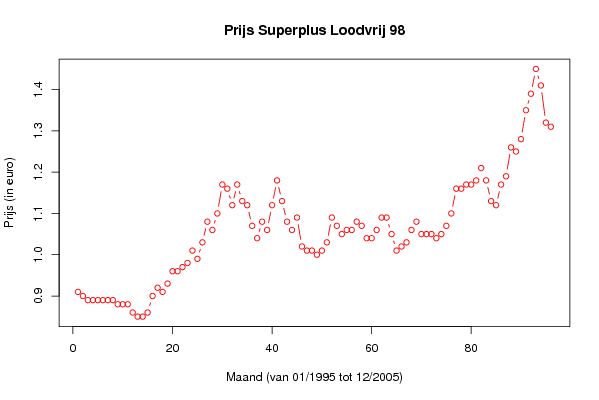
0,91 0,9 0,89 0,89 0,89 0,89 0,89 0,89 0,88 0,88 0,88 0,86 0,85 0,85 0,86 0,9 0,92 0,91 0,93 0,96 0,96 0,97 0,98 1,01 0,99 1,03 1,08 1,06 1,1 1,17 1,16 1,12 1,17 1,13 1,12 1,07 1,04 1,08 1,06 1,12 1,18 1,13 1,08 1,06 1,09 1,02 1,01 1,01 1 1,01 1,03 1,09 1,07 1,05 1,06 1,06 1,08 1,07 1,04 1,04 1,06 1,09 1,09 1,05 1,01 1,02 1,03 1,06 1,08 1,05 1,05 1,05 1,04 1,05 1,07 1,1 1,16 1,16 1,17 1,17 1,18 1,21 1,18 1,13 1,12 1,17 1,19 1,26 1,25 1,28 1,35 1,39 1,45 1,41 1,32 1,31 | |||||||||||||||||||||||||||||||||||||||||
Tables (Output of Computation) | |||||||||||||||||||||||||||||||||||||||||
| |||||||||||||||||||||||||||||||||||||||||
Figures (Output of Computation) | |||||||||||||||||||||||||||||||||||||||||
Input Parameters & R Code | |||||||||||||||||||||||||||||||||||||||||
| Parameters (Session): | |||||||||||||||||||||||||||||||||||||||||
| par1 = Prijs Superplus Loodvrij 98 ; par2 = Belgostat (NBB) ; par3 = Deze reeks geeft de gemiddelde maandelijkse prijs weer van superplus loodvrij 98 benzine. De reeks loopt van 01/1998 tot 12/2005. ; | |||||||||||||||||||||||||||||||||||||||||
| Parameters (R input): | |||||||||||||||||||||||||||||||||||||||||
| par1 = Prijs Superplus Loodvrij 98 ; par2 = Belgostat (NBB) ; par3 = Deze reeks geeft de gemiddelde maandelijkse prijs weer van superplus loodvrij 98 benzine. De reeks loopt van 01/1998 tot 12/2005. ; | |||||||||||||||||||||||||||||||||||||||||
| R code (references can be found in the software module): | |||||||||||||||||||||||||||||||||||||||||
bitmap(file='test1.png') | |||||||||||||||||||||||||||||||||||||||||