Free Statistics

of Irreproducible Research!

Author's title

Author*Unverified author*
R Software Modulerwasp_hierarchicalclustering.wasp
Title produced by softwareHierarchical Clustering
Date of computationFri, 26 Oct 2007 05:26:40 -0700
Cite this page as followsStatistical Computations at FreeStatistics.org, Office for Research Development and Education, URL https://freestatistics.org/blog/index.php?v=date/2007/Oct/26/1595hzrm4n2gf8m1193401286.htm/, Retrieved Sun, 28 Apr 2024 20:42:01 +0000
Statistical Computations at FreeStatistics.org, Office for Research Development and Education, URL https://freestatistics.org/blog/index.php?pk=1795, Retrieved Sun, 28 Apr 2024 20:42:01 +0000
QR Codes:

Original text written by user:Tobias, what do you think? Is this of any use?
IsPrivate?No (this computation is public)
User-defined keywordstobias, clustering, Verhaltensstudien
Estimated Impact221
Family? (F = Feedback message, R = changed R code, M = changed R Module, P = changed Parameters, D = changed Data)
-       [Hierarchical Clustering] [Clustering of Ver...] [2007-10-26 12:26:40] [d41d8cd98f00b204e9800998ecf8427e] [Current]
Feedback Forum

Post a new message
Dataseries X:
2	1	1	2	2	2	1	2
2	3	1	3	3	3	2	3
2	1	1	1	1	1	1	2
1	1	1	2	1	1	2	2
2	1	1	3	3	3	3	2
3	3	2	3	3	2	3	2
3	2	1	1	3	3	2	2
1	1	1	2	1	1	1	2
2	1	1	2	1	1	1	3
2	3	1	3	3	3	3	2
3	3	1	3	3	3	2	2
1	3	1	1	2	3	3	2
1	1	1	3	3	2	3	3
1	1	1	2	1	1	1	1
3	3	1	2	3	3	3	2
2	1	1	1	1	3	1	2
3	3	1	3	3	2	3	2
3	1	1	2	1	2	1	2
3	2	1	1	3	3	1	2
3	1	1	2	3	2	1	2
2	2	1	3	1	3	1	2
2	1	1	2	1	1	1	2
3	3	1	3	3	2	3	2
3	2	1	3	3	3	3	2
2	3	1	3	1	3	3	2
2	1	1	3	3	2	1	2
3	3	2	3	1	2	3	3
2	1	1	2	1	1	2	3
3	3	1	3	3	3	3	2
3	1	1	3	1	3	2	3
2	3	1	1	3	1	1	2
3	3	2	3	3	2	3	3
3	3	1	3	1	3	3	3
3	3	1	3	3	3	2	2
3	3	1	3	3	3	3	3
2	3	1	3	1	2	3	2
3	3	1	3	3	2	3	2
3	3	1	2	3	1	1	2
3	3	1	3	3	3	3	2
3	3	2	3	3	3	3	3
3	3	2	3	3	3	3	3
2	2	1	3	3	3	3	2
2	1	1	2	1	1	3	2
3	3	1	3	3	2	3	2
2	2	1	2	3	3	3	2
3	3	1	2	3	3	3	2
3	1	1	2	1	1	2	2
3	2	1	3	1	2	3	2
3	3	1	1	1	3	3	3
3	3	1	1	1	3	3	2
3	1	1	3	3	2	3	2
1	1	1	3	1	1	1	2


Summary of compuational transaction
Raw Inputview raw input (R code)
Raw Outputview raw output of R engine
Computing time1 seconds
R Server'Gwilym Jenkins' @ 72.249.127.135

\begin{tabular}{lllllllll}
\hline
Summary of compuational transaction \tabularnewline
Raw Input & view raw input (R code)  \tabularnewline
Raw Output & view raw output of R engine  \tabularnewline
Computing time & 1 seconds \tabularnewline
R Server & 'Gwilym Jenkins' @ 72.249.127.135 \tabularnewline
\hline
\end{tabular}
%Source: https://freestatistics.org/blog/index.php?pk=1795&T=0

[TABLE]
[ROW][C]Summary of compuational transaction[/C][/ROW]
[ROW][C]Raw Input[/C][C]view raw input (R code) [/C][/ROW]
[ROW][C]Raw Output[/C][C]view raw output of R engine [/C][/ROW]
[ROW][C]Computing time[/C][C]1 seconds[/C][/ROW]
[ROW][C]R Server[/C][C]'Gwilym Jenkins' @ 72.249.127.135[/C][/ROW]
[/TABLE]
Source: https://freestatistics.org/blog/index.php?pk=1795&T=0

Globally Unique Identifier (entire table): ba.freestatistics.org/blog/index.php?pk=1795&T=0

As an alternative you can also use a QR Code:  

The GUIDs for individual cells are displayed in the table below:

Summary of compuational transaction
Raw Inputview raw input (R code)
Raw Outputview raw output of R engine
Computing time1 seconds
R Server'Gwilym Jenkins' @ 72.249.127.135


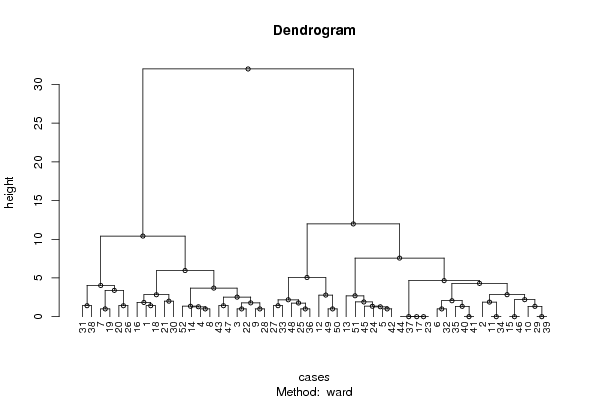
Summary of Dendrogram
LabelHeight
10
20
30
40
50
60
70
81
91
101
111
121
131
141
151
161.27614237491540
171.27614237491540
181.33333333333333
191.33333333333333
201.34517796864425
211.34517796864425
221.41421356237310
231.41421356237310
241.41421356237310
251.41421356237310
261.41421356237310
271.76417624662798
281.78023896615753
291.83799655596747
301.88561808316413
311.8999271042141
322
332.05654326454193
342.18276808098439
352.19803751656514
362.52340405545097
372.69643811658206
382.79037181352198
392.83163956520280
402.83812376724785
413.39600784050328
423.6903590799458
434.02646805990065
444.29512429653976
454.65578341382903
465.05698190251305
475.95718550507506
487.56751089419523
4910.4099568960333
5011.9819584409092
5132.0078963310825

\begin{tabular}{lllllllll}
\hline
Summary of Dendrogram \tabularnewline
Label & Height \tabularnewline
1 & 0 \tabularnewline
2 & 0 \tabularnewline
3 & 0 \tabularnewline
4 & 0 \tabularnewline
5 & 0 \tabularnewline
6 & 0 \tabularnewline
7 & 0 \tabularnewline
8 & 1 \tabularnewline
9 & 1 \tabularnewline
10 & 1 \tabularnewline
11 & 1 \tabularnewline
12 & 1 \tabularnewline
13 & 1 \tabularnewline
14 & 1 \tabularnewline
15 & 1 \tabularnewline
16 & 1.27614237491540 \tabularnewline
17 & 1.27614237491540 \tabularnewline
18 & 1.33333333333333 \tabularnewline
19 & 1.33333333333333 \tabularnewline
20 & 1.34517796864425 \tabularnewline
21 & 1.34517796864425 \tabularnewline
22 & 1.41421356237310 \tabularnewline
23 & 1.41421356237310 \tabularnewline
24 & 1.41421356237310 \tabularnewline
25 & 1.41421356237310 \tabularnewline
26 & 1.41421356237310 \tabularnewline
27 & 1.76417624662798 \tabularnewline
28 & 1.78023896615753 \tabularnewline
29 & 1.83799655596747 \tabularnewline
30 & 1.88561808316413 \tabularnewline
31 & 1.8999271042141 \tabularnewline
32 & 2 \tabularnewline
33 & 2.05654326454193 \tabularnewline
34 & 2.18276808098439 \tabularnewline
35 & 2.19803751656514 \tabularnewline
36 & 2.52340405545097 \tabularnewline
37 & 2.69643811658206 \tabularnewline
38 & 2.79037181352198 \tabularnewline
39 & 2.83163956520280 \tabularnewline
40 & 2.83812376724785 \tabularnewline
41 & 3.39600784050328 \tabularnewline
42 & 3.6903590799458 \tabularnewline
43 & 4.02646805990065 \tabularnewline
44 & 4.29512429653976 \tabularnewline
45 & 4.65578341382903 \tabularnewline
46 & 5.05698190251305 \tabularnewline
47 & 5.95718550507506 \tabularnewline
48 & 7.56751089419523 \tabularnewline
49 & 10.4099568960333 \tabularnewline
50 & 11.9819584409092 \tabularnewline
51 & 32.0078963310825 \tabularnewline
\hline
\end{tabular}
%Source: https://freestatistics.org/blog/index.php?pk=1795&T=1

[TABLE]
[ROW][C]Summary of Dendrogram[/C][/ROW]
[ROW][C]Label[/C][C]Height[/C][/ROW]
[ROW][C]1[/C][C]0[/C][/ROW]
[ROW][C]2[/C][C]0[/C][/ROW]
[ROW][C]3[/C][C]0[/C][/ROW]
[ROW][C]4[/C][C]0[/C][/ROW]
[ROW][C]5[/C][C]0[/C][/ROW]
[ROW][C]6[/C][C]0[/C][/ROW]
[ROW][C]7[/C][C]0[/C][/ROW]
[ROW][C]8[/C][C]1[/C][/ROW]
[ROW][C]9[/C][C]1[/C][/ROW]
[ROW][C]10[/C][C]1[/C][/ROW]
[ROW][C]11[/C][C]1[/C][/ROW]
[ROW][C]12[/C][C]1[/C][/ROW]
[ROW][C]13[/C][C]1[/C][/ROW]
[ROW][C]14[/C][C]1[/C][/ROW]
[ROW][C]15[/C][C]1[/C][/ROW]
[ROW][C]16[/C][C]1.27614237491540[/C][/ROW]
[ROW][C]17[/C][C]1.27614237491540[/C][/ROW]
[ROW][C]18[/C][C]1.33333333333333[/C][/ROW]
[ROW][C]19[/C][C]1.33333333333333[/C][/ROW]
[ROW][C]20[/C][C]1.34517796864425[/C][/ROW]
[ROW][C]21[/C][C]1.34517796864425[/C][/ROW]
[ROW][C]22[/C][C]1.41421356237310[/C][/ROW]
[ROW][C]23[/C][C]1.41421356237310[/C][/ROW]
[ROW][C]24[/C][C]1.41421356237310[/C][/ROW]
[ROW][C]25[/C][C]1.41421356237310[/C][/ROW]
[ROW][C]26[/C][C]1.41421356237310[/C][/ROW]
[ROW][C]27[/C][C]1.76417624662798[/C][/ROW]
[ROW][C]28[/C][C]1.78023896615753[/C][/ROW]
[ROW][C]29[/C][C]1.83799655596747[/C][/ROW]
[ROW][C]30[/C][C]1.88561808316413[/C][/ROW]
[ROW][C]31[/C][C]1.8999271042141[/C][/ROW]
[ROW][C]32[/C][C]2[/C][/ROW]
[ROW][C]33[/C][C]2.05654326454193[/C][/ROW]
[ROW][C]34[/C][C]2.18276808098439[/C][/ROW]
[ROW][C]35[/C][C]2.19803751656514[/C][/ROW]
[ROW][C]36[/C][C]2.52340405545097[/C][/ROW]
[ROW][C]37[/C][C]2.69643811658206[/C][/ROW]
[ROW][C]38[/C][C]2.79037181352198[/C][/ROW]
[ROW][C]39[/C][C]2.83163956520280[/C][/ROW]
[ROW][C]40[/C][C]2.83812376724785[/C][/ROW]
[ROW][C]41[/C][C]3.39600784050328[/C][/ROW]
[ROW][C]42[/C][C]3.6903590799458[/C][/ROW]
[ROW][C]43[/C][C]4.02646805990065[/C][/ROW]
[ROW][C]44[/C][C]4.29512429653976[/C][/ROW]
[ROW][C]45[/C][C]4.65578341382903[/C][/ROW]
[ROW][C]46[/C][C]5.05698190251305[/C][/ROW]
[ROW][C]47[/C][C]5.95718550507506[/C][/ROW]
[ROW][C]48[/C][C]7.56751089419523[/C][/ROW]
[ROW][C]49[/C][C]10.4099568960333[/C][/ROW]
[ROW][C]50[/C][C]11.9819584409092[/C][/ROW]
[ROW][C]51[/C][C]32.0078963310825[/C][/ROW]
[/TABLE]
Source: https://freestatistics.org/blog/index.php?pk=1795&T=1

Globally Unique Identifier (entire table): ba.freestatistics.org/blog/index.php?pk=1795&T=1

As an alternative you can also use a QR Code:  

The GUIDs for individual cells are displayed in the table below:

Summary of Dendrogram
LabelHeight
10
20
30
40
50
60
70
81
91
101
111
121
131
141
151
161.27614237491540
171.27614237491540
181.33333333333333
191.33333333333333
201.34517796864425
211.34517796864425
221.41421356237310
231.41421356237310
241.41421356237310
251.41421356237310
261.41421356237310
271.76417624662798
281.78023896615753
291.83799655596747
301.88561808316413
311.8999271042141
322
332.05654326454193
342.18276808098439
352.19803751656514
362.52340405545097
372.69643811658206
382.79037181352198
392.83163956520280
402.83812376724785
413.39600784050328
423.6903590799458
434.02646805990065
444.29512429653976
454.65578341382903
465.05698190251305
475.95718550507506
487.56751089419523
4910.4099568960333
5011.9819584409092
5132.0078963310825


Parameters (Session):
par1 = ward ; par2 = ALL ; par3 = FALSE ; par4 = FALSE ;
Parameters (R input):
par1 = ward ; par2 = ALL ; par3 = FALSE ; par4 = FALSE ;
R code (references can be found in the software module):
par3 <- as.logical(par3)
par4 <- as.logical(par4)
if (par3 == 'TRUE'){
dum = xlab
xlab = ylab
ylab = dum
}
x <- t(y)
hc <- hclust(dist(x),method=par1)
d <- as.dendrogram(hc)
str(d)
mysub <- paste('Method: ',par1)
bitmap(file='test1.png')
if (par4 == 'TRUE'){
plot(d,main=main,ylab=ylab,xlab=xlab,horiz=par3, nodePar=list(pch = c(1,NA), cex=0.8, lab.cex = 0.8),type='t',center=T, sub=mysub)
} else {
plot(d,main=main,ylab=ylab,xlab=xlab,horiz=par3, nodePar=list(pch = c(1,NA), cex=0.8, lab.cex = 0.8), sub=mysub)
}
dev.off()
if (par2 != 'ALL'){
if (par3 == 'TRUE'){
ylab = 'cluster'
} else {
xlab = 'cluster'
}
par2 <- as.numeric(par2)
memb <- cutree(hc, k = par2)
cent <- NULL
for(k in 1:par2){
cent <- rbind(cent, colMeans(x[memb == k, , drop = FALSE]))
}
hc1 <- hclust(dist(cent),method=par1, members = table(memb))
de <- as.dendrogram(hc1)
bitmap(file='test2.png')
if (par4 == 'TRUE'){
plot(de,main=main,ylab=ylab,xlab=xlab,horiz=par3, nodePar=list(pch = c(1,NA), cex=0.8, lab.cex = 0.8),type='t',center=T, sub=mysub)
} else {
plot(de,main=main,ylab=ylab,xlab=xlab,horiz=par3, nodePar=list(pch = c(1,NA), cex=0.8, lab.cex = 0.8), sub=mysub)
}
dev.off()
str(de)
}
load(file='createtable')
a<-table.start()
a<-table.row.start(a)
a<-table.element(a,'Summary of Dendrogram',2,TRUE)
a<-table.row.end(a)
a<-table.row.start(a)
a<-table.element(a,'Label',header=TRUE)
a<-table.element(a,'Height',header=TRUE)
a<-table.row.end(a)
num <- length(x[,1])-1
for (i in 1:num)
{
a<-table.row.start(a)
a<-table.element(a,hc$labels[i])
a<-table.element(a,hc$height[i])
a<-table.row.end(a)
}
a<-table.end(a)
table.save(a,file='mytable1.tab')
if (par2 != 'ALL'){
a<-table.start()
a<-table.row.start(a)
a<-table.element(a,'Summary of Cut Dendrogram',2,TRUE)
a<-table.row.end(a)
a<-table.row.start(a)
a<-table.element(a,'Label',header=TRUE)
a<-table.element(a,'Height',header=TRUE)
a<-table.row.end(a)
num <- par2-1
for (i in 1:num)
{
a<-table.row.start(a)
a<-table.element(a,i)
a<-table.element(a,hc1$height[i])
a<-table.row.end(a)
}
a<-table.end(a)
table.save(a,file='mytable2.tab')
}