Free Statistics

of Irreproducible Research!

Author's title

Author*Unverified author*
R Software Modulerwasp_autocorrelation.wasp
Title produced by software(Partial) Autocorrelation Function
Date of computationFri, 30 Nov 2007 09:10:02 -0700
Cite this page as followsStatistical Computations at FreeStatistics.org, Office for Research Development and Education, URL https://freestatistics.org/blog/index.php?v=date/2007/Nov/30/t1196438372tfus1mdiokqx1u6.htm/, Retrieved Sun, 28 Apr 2024 09:53:32 +0000
Statistical Computations at FreeStatistics.org, Office for Research Development and Education, URL https://freestatistics.org/blog/index.php?pk=7751, Retrieved Sun, 28 Apr 2024 09:53:32 +0000
QR Codes:

Original text written by user:
IsPrivate?No (this computation is public)
User-defined keywordswim, dhondt, paper
Estimated Impact186
Family? (F = Feedback message, R = changed R code, M = changed R Module, P = changed Parameters, D = changed Data)
-       [(Partial) Autocorrelation Function] [Autocorrelatie - ...] [2007-11-30 16:10:02] [014bfc073eb4f6c1ae65a07cc44c50c0] [Current]
Feedback Forum

Post a new message
Dataseries X:
108,4
117
103,8
100,8
110,6
104
112,6
107,3
98,9
109,8
104,9
102,2
123,9
124,9
112,7
121,9
100,6
104,3
120,4
107,5
102,9
125,6
107,5
108,8
128,4
121,1
119,5
128,7
108,7
105,5
119,8
111,3
110,6
120,1
97,5
107,7
127,3
117,2
119,8
116,2
111
112,4
130,6
109,1
118,8
123,9
101,6
112,8
128
129,6
125,8
119,5
115,7
113,6
129,7
112
116,8
126,3
112,9
115,9


Summary of compuational transaction
Raw Inputview raw input (R code)
Raw Outputview raw output of R engine
Computing time2 seconds
R Server'Gwilym Jenkins' @ 72.249.127.135

\begin{tabular}{lllllllll}
\hline
Summary of compuational transaction \tabularnewline
Raw Input & view raw input (R code)  \tabularnewline
Raw Output & view raw output of R engine  \tabularnewline
Computing time & 2 seconds \tabularnewline
R Server & 'Gwilym Jenkins' @ 72.249.127.135 \tabularnewline
\hline
\end{tabular}
%Source: https://freestatistics.org/blog/index.php?pk=7751&T=0

[TABLE]
[ROW][C]Summary of compuational transaction[/C][/ROW]
[ROW][C]Raw Input[/C][C]view raw input (R code) [/C][/ROW]
[ROW][C]Raw Output[/C][C]view raw output of R engine [/C][/ROW]
[ROW][C]Computing time[/C][C]2 seconds[/C][/ROW]
[ROW][C]R Server[/C][C]'Gwilym Jenkins' @ 72.249.127.135[/C][/ROW]
[/TABLE]
Source: https://freestatistics.org/blog/index.php?pk=7751&T=0

Globally Unique Identifier (entire table): ba.freestatistics.org/blog/index.php?pk=7751&T=0

As an alternative you can also use a QR Code:  

The GUIDs for individual cells are displayed in the table below:

Summary of compuational transaction
Raw Inputview raw input (R code)
Raw Outputview raw output of R engine
Computing time2 seconds
R Server'Gwilym Jenkins' @ 72.249.127.135


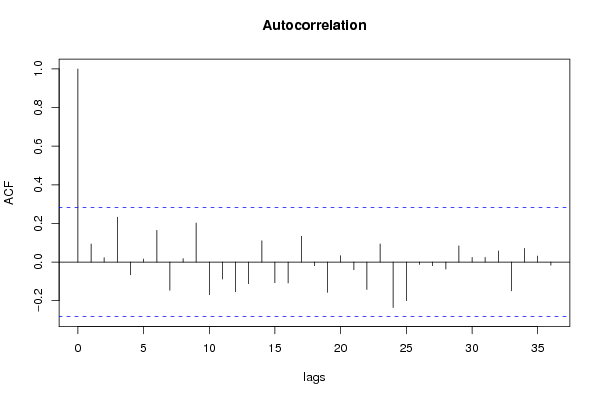
Autocorrelation Function
Time lag kACF(k)T-STATP-value
016.92820
10.0934380.64740.260243
20.0222060.15380.439188
30.2321541.60840.057152
4-0.066386-0.45990.67618
50.0153080.10610.457991
60.1639791.13610.130782
7-0.146226-1.01310.84195
80.0176610.12240.451563
90.2015731.39650.084489
10-0.168936-1.17040.876195
11-0.088285-0.61170.728175
12-0.154023-1.06710.854369
13-0.111887-0.77520.77898
140.1100640.76250.224733
15-0.107331-0.74360.769632
16-0.108046-0.74860.771114
170.1331410.92240.18046
18-0.018754-0.12990.551417
19-0.156786-1.08620.858602
200.0326120.22590.411104
21-0.039623-0.27450.607566
22-0.142001-0.98380.83493
230.0939390.65080.25913
24-0.236131-1.6360.945806
25-0.199915-1.3850.91378
26-0.012536-0.08690.534424
27-0.018633-0.12910.551088
28-0.036706-0.25430.599827
290.0832060.57650.283496
300.0236430.16380.435286
310.0238230.16510.434798
320.0573190.39710.34652
33-0.149223-1.03380.846806
340.0705440.48870.313625
350.031020.21490.415373

\begin{tabular}{lllllllll}
\hline
Autocorrelation Function \tabularnewline
Time lag k & ACF(k) & T-STAT & P-value \tabularnewline
0 & 1 & 6.9282 & 0 \tabularnewline
1 & 0.093438 & 0.6474 & 0.260243 \tabularnewline
2 & 0.022206 & 0.1538 & 0.439188 \tabularnewline
3 & 0.232154 & 1.6084 & 0.057152 \tabularnewline
4 & -0.066386 & -0.4599 & 0.67618 \tabularnewline
5 & 0.015308 & 0.1061 & 0.457991 \tabularnewline
6 & 0.163979 & 1.1361 & 0.130782 \tabularnewline
7 & -0.146226 & -1.0131 & 0.84195 \tabularnewline
8 & 0.017661 & 0.1224 & 0.451563 \tabularnewline
9 & 0.201573 & 1.3965 & 0.084489 \tabularnewline
10 & -0.168936 & -1.1704 & 0.876195 \tabularnewline
11 & -0.088285 & -0.6117 & 0.728175 \tabularnewline
12 & -0.154023 & -1.0671 & 0.854369 \tabularnewline
13 & -0.111887 & -0.7752 & 0.77898 \tabularnewline
14 & 0.110064 & 0.7625 & 0.224733 \tabularnewline
15 & -0.107331 & -0.7436 & 0.769632 \tabularnewline
16 & -0.108046 & -0.7486 & 0.771114 \tabularnewline
17 & 0.133141 & 0.9224 & 0.18046 \tabularnewline
18 & -0.018754 & -0.1299 & 0.551417 \tabularnewline
19 & -0.156786 & -1.0862 & 0.858602 \tabularnewline
20 & 0.032612 & 0.2259 & 0.411104 \tabularnewline
21 & -0.039623 & -0.2745 & 0.607566 \tabularnewline
22 & -0.142001 & -0.9838 & 0.83493 \tabularnewline
23 & 0.093939 & 0.6508 & 0.25913 \tabularnewline
24 & -0.236131 & -1.636 & 0.945806 \tabularnewline
25 & -0.199915 & -1.385 & 0.91378 \tabularnewline
26 & -0.012536 & -0.0869 & 0.534424 \tabularnewline
27 & -0.018633 & -0.1291 & 0.551088 \tabularnewline
28 & -0.036706 & -0.2543 & 0.599827 \tabularnewline
29 & 0.083206 & 0.5765 & 0.283496 \tabularnewline
30 & 0.023643 & 0.1638 & 0.435286 \tabularnewline
31 & 0.023823 & 0.1651 & 0.434798 \tabularnewline
32 & 0.057319 & 0.3971 & 0.34652 \tabularnewline
33 & -0.149223 & -1.0338 & 0.846806 \tabularnewline
34 & 0.070544 & 0.4887 & 0.313625 \tabularnewline
35 & 0.03102 & 0.2149 & 0.415373 \tabularnewline
\hline
\end{tabular}
%Source: https://freestatistics.org/blog/index.php?pk=7751&T=1

[TABLE]
[ROW][C]Autocorrelation Function[/C][/ROW]
[ROW][C]Time lag k[/C][C]ACF(k)[/C][C]T-STAT[/C][C]P-value[/C][/ROW]
[ROW][C]0[/C][C]1[/C][C]6.9282[/C][C]0[/C][/ROW]
[ROW][C]1[/C][C]0.093438[/C][C]0.6474[/C][C]0.260243[/C][/ROW]
[ROW][C]2[/C][C]0.022206[/C][C]0.1538[/C][C]0.439188[/C][/ROW]
[ROW][C]3[/C][C]0.232154[/C][C]1.6084[/C][C]0.057152[/C][/ROW]
[ROW][C]4[/C][C]-0.066386[/C][C]-0.4599[/C][C]0.67618[/C][/ROW]
[ROW][C]5[/C][C]0.015308[/C][C]0.1061[/C][C]0.457991[/C][/ROW]
[ROW][C]6[/C][C]0.163979[/C][C]1.1361[/C][C]0.130782[/C][/ROW]
[ROW][C]7[/C][C]-0.146226[/C][C]-1.0131[/C][C]0.84195[/C][/ROW]
[ROW][C]8[/C][C]0.017661[/C][C]0.1224[/C][C]0.451563[/C][/ROW]
[ROW][C]9[/C][C]0.201573[/C][C]1.3965[/C][C]0.084489[/C][/ROW]
[ROW][C]10[/C][C]-0.168936[/C][C]-1.1704[/C][C]0.876195[/C][/ROW]
[ROW][C]11[/C][C]-0.088285[/C][C]-0.6117[/C][C]0.728175[/C][/ROW]
[ROW][C]12[/C][C]-0.154023[/C][C]-1.0671[/C][C]0.854369[/C][/ROW]
[ROW][C]13[/C][C]-0.111887[/C][C]-0.7752[/C][C]0.77898[/C][/ROW]
[ROW][C]14[/C][C]0.110064[/C][C]0.7625[/C][C]0.224733[/C][/ROW]
[ROW][C]15[/C][C]-0.107331[/C][C]-0.7436[/C][C]0.769632[/C][/ROW]
[ROW][C]16[/C][C]-0.108046[/C][C]-0.7486[/C][C]0.771114[/C][/ROW]
[ROW][C]17[/C][C]0.133141[/C][C]0.9224[/C][C]0.18046[/C][/ROW]
[ROW][C]18[/C][C]-0.018754[/C][C]-0.1299[/C][C]0.551417[/C][/ROW]
[ROW][C]19[/C][C]-0.156786[/C][C]-1.0862[/C][C]0.858602[/C][/ROW]
[ROW][C]20[/C][C]0.032612[/C][C]0.2259[/C][C]0.411104[/C][/ROW]
[ROW][C]21[/C][C]-0.039623[/C][C]-0.2745[/C][C]0.607566[/C][/ROW]
[ROW][C]22[/C][C]-0.142001[/C][C]-0.9838[/C][C]0.83493[/C][/ROW]
[ROW][C]23[/C][C]0.093939[/C][C]0.6508[/C][C]0.25913[/C][/ROW]
[ROW][C]24[/C][C]-0.236131[/C][C]-1.636[/C][C]0.945806[/C][/ROW]
[ROW][C]25[/C][C]-0.199915[/C][C]-1.385[/C][C]0.91378[/C][/ROW]
[ROW][C]26[/C][C]-0.012536[/C][C]-0.0869[/C][C]0.534424[/C][/ROW]
[ROW][C]27[/C][C]-0.018633[/C][C]-0.1291[/C][C]0.551088[/C][/ROW]
[ROW][C]28[/C][C]-0.036706[/C][C]-0.2543[/C][C]0.599827[/C][/ROW]
[ROW][C]29[/C][C]0.083206[/C][C]0.5765[/C][C]0.283496[/C][/ROW]
[ROW][C]30[/C][C]0.023643[/C][C]0.1638[/C][C]0.435286[/C][/ROW]
[ROW][C]31[/C][C]0.023823[/C][C]0.1651[/C][C]0.434798[/C][/ROW]
[ROW][C]32[/C][C]0.057319[/C][C]0.3971[/C][C]0.34652[/C][/ROW]
[ROW][C]33[/C][C]-0.149223[/C][C]-1.0338[/C][C]0.846806[/C][/ROW]
[ROW][C]34[/C][C]0.070544[/C][C]0.4887[/C][C]0.313625[/C][/ROW]
[ROW][C]35[/C][C]0.03102[/C][C]0.2149[/C][C]0.415373[/C][/ROW]
[/TABLE]
Source: https://freestatistics.org/blog/index.php?pk=7751&T=1

Globally Unique Identifier (entire table): ba.freestatistics.org/blog/index.php?pk=7751&T=1

As an alternative you can also use a QR Code:  

The GUIDs for individual cells are displayed in the table below:

Autocorrelation Function
Time lag kACF(k)T-STATP-value
016.92820
10.0934380.64740.260243
20.0222060.15380.439188
30.2321541.60840.057152
4-0.066386-0.45990.67618
50.0153080.10610.457991
60.1639791.13610.130782
7-0.146226-1.01310.84195
80.0176610.12240.451563
90.2015731.39650.084489
10-0.168936-1.17040.876195
11-0.088285-0.61170.728175
12-0.154023-1.06710.854369
13-0.111887-0.77520.77898
140.1100640.76250.224733
15-0.107331-0.74360.769632
16-0.108046-0.74860.771114
170.1331410.92240.18046
18-0.018754-0.12990.551417
19-0.156786-1.08620.858602
200.0326120.22590.411104
21-0.039623-0.27450.607566
22-0.142001-0.98380.83493
230.0939390.65080.25913
24-0.236131-1.6360.945806
25-0.199915-1.3850.91378
26-0.012536-0.08690.534424
27-0.018633-0.12910.551088
28-0.036706-0.25430.599827
290.0832060.57650.283496
300.0236430.16380.435286
310.0238230.16510.434798
320.0573190.39710.34652
33-0.149223-1.03380.846806
340.0705440.48870.313625
350.031020.21490.415373


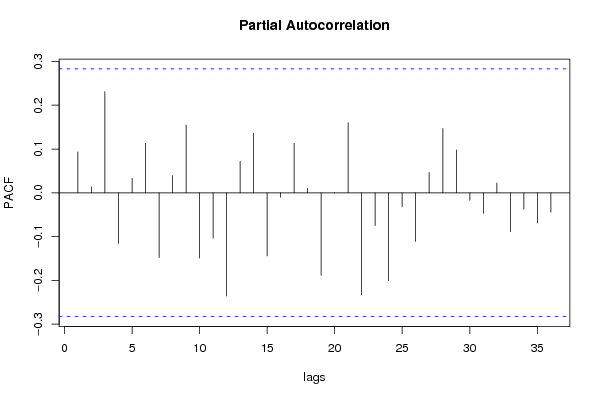
Partial Autocorrelation Function
Time lag kPACF(k)T-STATP-value
00.0934380.64740.260243
10.0135940.09420.462679
20.2308961.59970.058115
3-0.115596-0.80090.786424
40.0328680.22770.410418
50.1130910.78350.218587
6-0.147513-1.0220.844049
70.0390160.27030.39404
80.1544831.07030.14492
9-0.148964-1.03210.84639
10-0.103445-0.71670.761481
11-0.235508-1.63170.945351
120.0722960.50090.309373
130.136040.94250.175325
14-0.14434-10.838842
15-0.010442-0.07230.528685
160.113430.78590.217905
170.0099820.06920.472577
18-0.188565-1.30640.901182
19-0.000479-0.00330.501318
200.1602321.11010.13624
21-0.232813-1.6130.943347
22-0.07496-0.51930.697043
23-0.20067-1.39030.914572
24-0.031371-0.21730.58557
25-0.11098-0.76890.777138
260.0463020.32080.374881
270.1469891.01840.156805
280.0978020.67760.250641
29-0.01707-0.11830.546825
30-0.04682-0.32440.626469
310.0225640.15630.438216
32-0.088704-0.61460.729127
33-0.037315-0.25850.601448
34-0.069114-0.47880.682884
35-0.044317-0.3070.619928

\begin{tabular}{lllllllll}
\hline
Partial Autocorrelation Function \tabularnewline
Time lag k & PACF(k) & T-STAT & P-value \tabularnewline
0 & 0.093438 & 0.6474 & 0.260243 \tabularnewline
1 & 0.013594 & 0.0942 & 0.462679 \tabularnewline
2 & 0.230896 & 1.5997 & 0.058115 \tabularnewline
3 & -0.115596 & -0.8009 & 0.786424 \tabularnewline
4 & 0.032868 & 0.2277 & 0.410418 \tabularnewline
5 & 0.113091 & 0.7835 & 0.218587 \tabularnewline
6 & -0.147513 & -1.022 & 0.844049 \tabularnewline
7 & 0.039016 & 0.2703 & 0.39404 \tabularnewline
8 & 0.154483 & 1.0703 & 0.14492 \tabularnewline
9 & -0.148964 & -1.0321 & 0.84639 \tabularnewline
10 & -0.103445 & -0.7167 & 0.761481 \tabularnewline
11 & -0.235508 & -1.6317 & 0.945351 \tabularnewline
12 & 0.072296 & 0.5009 & 0.309373 \tabularnewline
13 & 0.13604 & 0.9425 & 0.175325 \tabularnewline
14 & -0.14434 & -1 & 0.838842 \tabularnewline
15 & -0.010442 & -0.0723 & 0.528685 \tabularnewline
16 & 0.11343 & 0.7859 & 0.217905 \tabularnewline
17 & 0.009982 & 0.0692 & 0.472577 \tabularnewline
18 & -0.188565 & -1.3064 & 0.901182 \tabularnewline
19 & -0.000479 & -0.0033 & 0.501318 \tabularnewline
20 & 0.160232 & 1.1101 & 0.13624 \tabularnewline
21 & -0.232813 & -1.613 & 0.943347 \tabularnewline
22 & -0.07496 & -0.5193 & 0.697043 \tabularnewline
23 & -0.20067 & -1.3903 & 0.914572 \tabularnewline
24 & -0.031371 & -0.2173 & 0.58557 \tabularnewline
25 & -0.11098 & -0.7689 & 0.777138 \tabularnewline
26 & 0.046302 & 0.3208 & 0.374881 \tabularnewline
27 & 0.146989 & 1.0184 & 0.156805 \tabularnewline
28 & 0.097802 & 0.6776 & 0.250641 \tabularnewline
29 & -0.01707 & -0.1183 & 0.546825 \tabularnewline
30 & -0.04682 & -0.3244 & 0.626469 \tabularnewline
31 & 0.022564 & 0.1563 & 0.438216 \tabularnewline
32 & -0.088704 & -0.6146 & 0.729127 \tabularnewline
33 & -0.037315 & -0.2585 & 0.601448 \tabularnewline
34 & -0.069114 & -0.4788 & 0.682884 \tabularnewline
35 & -0.044317 & -0.307 & 0.619928 \tabularnewline
\hline
\end{tabular}
%Source: https://freestatistics.org/blog/index.php?pk=7751&T=2

[TABLE]
[ROW][C]Partial Autocorrelation Function[/C][/ROW]
[ROW][C]Time lag k[/C][C]PACF(k)[/C][C]T-STAT[/C][C]P-value[/C][/ROW]
[ROW][C]0[/C][C]0.093438[/C][C]0.6474[/C][C]0.260243[/C][/ROW]
[ROW][C]1[/C][C]0.013594[/C][C]0.0942[/C][C]0.462679[/C][/ROW]
[ROW][C]2[/C][C]0.230896[/C][C]1.5997[/C][C]0.058115[/C][/ROW]
[ROW][C]3[/C][C]-0.115596[/C][C]-0.8009[/C][C]0.786424[/C][/ROW]
[ROW][C]4[/C][C]0.032868[/C][C]0.2277[/C][C]0.410418[/C][/ROW]
[ROW][C]5[/C][C]0.113091[/C][C]0.7835[/C][C]0.218587[/C][/ROW]
[ROW][C]6[/C][C]-0.147513[/C][C]-1.022[/C][C]0.844049[/C][/ROW]
[ROW][C]7[/C][C]0.039016[/C][C]0.2703[/C][C]0.39404[/C][/ROW]
[ROW][C]8[/C][C]0.154483[/C][C]1.0703[/C][C]0.14492[/C][/ROW]
[ROW][C]9[/C][C]-0.148964[/C][C]-1.0321[/C][C]0.84639[/C][/ROW]
[ROW][C]10[/C][C]-0.103445[/C][C]-0.7167[/C][C]0.761481[/C][/ROW]
[ROW][C]11[/C][C]-0.235508[/C][C]-1.6317[/C][C]0.945351[/C][/ROW]
[ROW][C]12[/C][C]0.072296[/C][C]0.5009[/C][C]0.309373[/C][/ROW]
[ROW][C]13[/C][C]0.13604[/C][C]0.9425[/C][C]0.175325[/C][/ROW]
[ROW][C]14[/C][C]-0.14434[/C][C]-1[/C][C]0.838842[/C][/ROW]
[ROW][C]15[/C][C]-0.010442[/C][C]-0.0723[/C][C]0.528685[/C][/ROW]
[ROW][C]16[/C][C]0.11343[/C][C]0.7859[/C][C]0.217905[/C][/ROW]
[ROW][C]17[/C][C]0.009982[/C][C]0.0692[/C][C]0.472577[/C][/ROW]
[ROW][C]18[/C][C]-0.188565[/C][C]-1.3064[/C][C]0.901182[/C][/ROW]
[ROW][C]19[/C][C]-0.000479[/C][C]-0.0033[/C][C]0.501318[/C][/ROW]
[ROW][C]20[/C][C]0.160232[/C][C]1.1101[/C][C]0.13624[/C][/ROW]
[ROW][C]21[/C][C]-0.232813[/C][C]-1.613[/C][C]0.943347[/C][/ROW]
[ROW][C]22[/C][C]-0.07496[/C][C]-0.5193[/C][C]0.697043[/C][/ROW]
[ROW][C]23[/C][C]-0.20067[/C][C]-1.3903[/C][C]0.914572[/C][/ROW]
[ROW][C]24[/C][C]-0.031371[/C][C]-0.2173[/C][C]0.58557[/C][/ROW]
[ROW][C]25[/C][C]-0.11098[/C][C]-0.7689[/C][C]0.777138[/C][/ROW]
[ROW][C]26[/C][C]0.046302[/C][C]0.3208[/C][C]0.374881[/C][/ROW]
[ROW][C]27[/C][C]0.146989[/C][C]1.0184[/C][C]0.156805[/C][/ROW]
[ROW][C]28[/C][C]0.097802[/C][C]0.6776[/C][C]0.250641[/C][/ROW]
[ROW][C]29[/C][C]-0.01707[/C][C]-0.1183[/C][C]0.546825[/C][/ROW]
[ROW][C]30[/C][C]-0.04682[/C][C]-0.3244[/C][C]0.626469[/C][/ROW]
[ROW][C]31[/C][C]0.022564[/C][C]0.1563[/C][C]0.438216[/C][/ROW]
[ROW][C]32[/C][C]-0.088704[/C][C]-0.6146[/C][C]0.729127[/C][/ROW]
[ROW][C]33[/C][C]-0.037315[/C][C]-0.2585[/C][C]0.601448[/C][/ROW]
[ROW][C]34[/C][C]-0.069114[/C][C]-0.4788[/C][C]0.682884[/C][/ROW]
[ROW][C]35[/C][C]-0.044317[/C][C]-0.307[/C][C]0.619928[/C][/ROW]
[/TABLE]
Source: https://freestatistics.org/blog/index.php?pk=7751&T=2

Globally Unique Identifier (entire table): ba.freestatistics.org/blog/index.php?pk=7751&T=2

As an alternative you can also use a QR Code:  

The GUIDs for individual cells are displayed in the table below:

Partial Autocorrelation Function
Time lag kPACF(k)T-STATP-value
00.0934380.64740.260243
10.0135940.09420.462679
20.2308961.59970.058115
3-0.115596-0.80090.786424
40.0328680.22770.410418
50.1130910.78350.218587
6-0.147513-1.0220.844049
70.0390160.27030.39404
80.1544831.07030.14492
9-0.148964-1.03210.84639
10-0.103445-0.71670.761481
11-0.235508-1.63170.945351
120.0722960.50090.309373
130.136040.94250.175325
14-0.14434-10.838842
15-0.010442-0.07230.528685
160.113430.78590.217905
170.0099820.06920.472577
18-0.188565-1.30640.901182
19-0.000479-0.00330.501318
200.1602321.11010.13624
21-0.232813-1.6130.943347
22-0.07496-0.51930.697043
23-0.20067-1.39030.914572
24-0.031371-0.21730.58557
25-0.11098-0.76890.777138
260.0463020.32080.374881
270.1469891.01840.156805
280.0978020.67760.250641
29-0.01707-0.11830.546825
30-0.04682-0.32440.626469
310.0225640.15630.438216
32-0.088704-0.61460.729127
33-0.037315-0.25850.601448
34-0.069114-0.47880.682884
35-0.044317-0.3070.619928


Parameters (Session):
par1 = FALSE ; par2 = 1 ; par3 = 0 ; par4 = 1 ; par5 = 12 ; par6 = 3 ; par7 = 1 ; par8 = 2 ; par9 = 1 ;
Parameters (R input):
par1 = 36 ; par2 = 1 ; par3 = 0 ; par4 = 1 ; par5 = 12 ;
R code (references can be found in the software module):
if (par1 == 'Default') {
par1 = 10*log10(length(x))
} else {
par1 <- as.numeric(par1)
}
par2 <- as.numeric(par2)
par3 <- as.numeric(par3)
par4 <- as.numeric(par4)
par5 <- as.numeric(par5)
if (par2 == 0) {
x <- log(x)
} else {
x <- (x ^ par2 - 1) / par2
}
if (par3 > 0) x <- diff(x,lag=1,difference=par3)
if (par4 > 0) x <- diff(x,lag=par5,difference=par4)
bitmap(file='pic1.png')
racf <- acf(x,par1,main='Autocorrelation',xlab='lags',ylab='ACF')
dev.off()
bitmap(file='pic2.png')
rpacf <- pacf(x,par1,main='Partial Autocorrelation',xlab='lags',ylab='PACF')
dev.off()
(myacf <- c(racf$acf))
(mypacf <- c(rpacf$acf))
lengthx <- length(x)
sqrtn <- sqrt(lengthx)
load(file='createtable')
a<-table.start()
a<-table.row.start(a)
a<-table.element(a,'Autocorrelation Function',4,TRUE)
a<-table.row.end(a)
a<-table.row.start(a)
a<-table.element(a,'Time lag k',header=TRUE)
a<-table.element(a,hyperlink('basics.htm','ACF(k)','click here for more information about the Autocorrelation Function'),header=TRUE)
a<-table.element(a,'T-STAT',header=TRUE)
a<-table.element(a,'P-value',header=TRUE)
a<-table.row.end(a)
for (i in 1:par1) {
a<-table.row.start(a)
a<-table.element(a,i-1,header=TRUE)
a<-table.element(a,round(myacf[i],6))
mytstat <- myacf[i]*sqrtn
a<-table.element(a,round(mytstat,4))
a<-table.element(a,round(1-pt(mytstat,lengthx),6))
a<-table.row.end(a)
}
a<-table.end(a)
table.save(a,file='mytable.tab')
a<-table.start()
a<-table.row.start(a)
a<-table.element(a,'Partial Autocorrelation Function',4,TRUE)
a<-table.row.end(a)
a<-table.row.start(a)
a<-table.element(a,'Time lag k',header=TRUE)
a<-table.element(a,hyperlink('basics.htm','PACF(k)','click here for more information about the Partial Autocorrelation Function'),header=TRUE)
a<-table.element(a,'T-STAT',header=TRUE)
a<-table.element(a,'P-value',header=TRUE)
a<-table.row.end(a)
for (i in 1:par1) {
a<-table.row.start(a)
a<-table.element(a,i-1,header=TRUE)
a<-table.element(a,round(mypacf[i],6))
mytstat <- mypacf[i]*sqrtn
a<-table.element(a,round(mytstat,4))
a<-table.element(a,round(1-pt(mytstat,lengthx),6))
a<-table.row.end(a)
}
a<-table.end(a)
table.save(a,file='mytable1.tab')