Free Statistics

of Irreproducible Research!

Author's title

Author*Unverified author*
R Software Modulerwasp_autocorrelation.wasp
Title produced by software(Partial) Autocorrelation Function
Date of computationFri, 30 Nov 2007 07:47:04 -0700
Cite this page as followsStatistical Computations at FreeStatistics.org, Office for Research Development and Education, URL https://freestatistics.org/blog/index.php?v=date/2007/Nov/30/t1196433446wqcm3w8synsr0tr.htm/, Retrieved Sat, 27 Apr 2024 21:28:03 +0000
Statistical Computations at FreeStatistics.org, Office for Research Development and Education, URL https://freestatistics.org/blog/index.php?pk=7717, Retrieved Sat, 27 Apr 2024 21:28:03 +0000
QR Codes:

Original text written by user:
IsPrivate?No (this computation is public)
User-defined keywords
Estimated Impact160
Family? (F = Feedback message, R = changed R code, M = changed R Module, P = changed Parameters, D = changed Data)
-       [(Partial) Autocorrelation Function] [Workshop8_q1b] [2007-11-30 14:47:04] [1ea0754dc57274996703e6220e342fe8] [Current]
Feedback Forum

Post a new message
Dataseries X:
48527
44446
46380
48950
38883
42928
37107
30186
32602
39892
32194
21629
59968
45694
55756
48554
41052
49822
39191
31994
35735
38930
33658
23849
58972
59249
63955
53785
52760
44795
37348
32370
32717
40974
33591
21124
58608
46865
51378
46235
47206
45382
41227
33795
31295
42625
33625
21538
56421
53152
53536
52408
41454
38271
35306
26414
31917
38030
27534
18387
50556
43901
48572
43899
37532
40357
35489
29027
34485
42598
30306
26451
47460
50104
61465
53726
39477
43895
31481
29896
33842
39120
33702
25094
51442
45594
52518
48564
41745
49585
32747
33379
35645
37034
35681
20972


Summary of compuational transaction
Raw Inputview raw input (R code)
Raw Outputview raw output of R engine
Computing time2 seconds
R Server'Herman Ole Andreas Wold' @ 193.190.124.10:1001

\begin{tabular}{lllllllll}
\hline
Summary of compuational transaction \tabularnewline
Raw Input & view raw input (R code)  \tabularnewline
Raw Output & view raw output of R engine  \tabularnewline
Computing time & 2 seconds \tabularnewline
R Server & 'Herman Ole Andreas Wold' @ 193.190.124.10:1001 \tabularnewline
\hline
\end{tabular}
%Source: https://freestatistics.org/blog/index.php?pk=7717&T=0

[TABLE]
[ROW][C]Summary of compuational transaction[/C][/ROW]
[ROW][C]Raw Input[/C][C]view raw input (R code) [/C][/ROW]
[ROW][C]Raw Output[/C][C]view raw output of R engine [/C][/ROW]
[ROW][C]Computing time[/C][C]2 seconds[/C][/ROW]
[ROW][C]R Server[/C][C]'Herman Ole Andreas Wold' @ 193.190.124.10:1001[/C][/ROW]
[/TABLE]
Source: https://freestatistics.org/blog/index.php?pk=7717&T=0

Globally Unique Identifier (entire table): ba.freestatistics.org/blog/index.php?pk=7717&T=0

As an alternative you can also use a QR Code:  

The GUIDs for individual cells are displayed in the table below:

Summary of compuational transaction
Raw Inputview raw input (R code)
Raw Outputview raw output of R engine
Computing time2 seconds
R Server'Herman Ole Andreas Wold' @ 193.190.124.10:1001


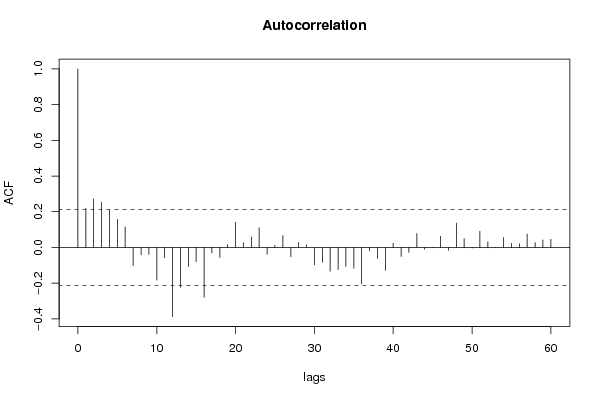
Autocorrelation Function
Time lag kACF(k)T-STATP-value
019.16520
10.2183162.00090.024316
20.2711622.48520.007465
30.2534822.32320.011293
40.208131.90750.029934
50.157161.44040.076737
60.1137641.04270.150047
7-0.101923-0.93410.823544
8-0.041187-0.37750.646617
9-0.039409-0.36120.640568
10-0.182959-1.67680.951355
11-0.058004-0.53160.701803
12-0.387893-3.55510.999688
13-0.224421-2.05690.978598
14-0.107517-0.98540.836375
15-0.079921-0.73250.767044
16-0.279516-2.56180.993901
17-0.030679-0.28120.610368
18-0.055931-0.51260.695218
190.0156810.14370.443032
200.1406361.2890.100477
210.0257310.23580.40707
220.0583740.5350.297028
230.1098711.0070.158417
24-0.037852-0.34690.63524
250.0108560.09950.460491
260.0661960.60670.272846
27-0.052029-0.47690.682647
280.0278630.25540.39953
290.0148460.13610.446048
30-0.097164-0.89050.812137
31-0.08266-0.75760.774593
32-0.132893-1.2180.88668
33-0.123592-1.13270.869726
34-0.107542-0.98560.836429
35-0.116239-1.06540.855115
36-0.204401-1.87340.967752
37-0.019231-0.17630.569741
38-0.062752-0.57510.716629
39-0.127323-1.16690.87673
400.0237170.21740.414222
41-0.050167-0.45980.676573
42-0.027328-0.25050.598581
430.0779280.71420.238535
44-0.009605-0.0880.534969
45-0.002002-0.01830.507298
460.0624180.57210.284402
47-0.016402-0.15030.559565
480.1366571.25250.106936
490.0489980.44910.327268
50-0.003837-0.03520.513984
510.0900170.8250.20585
520.0305360.27990.390133
53-0.002007-0.01840.507315
540.0555120.50880.30612
550.0233360.21390.415579
560.0201750.18490.426875
570.0752250.68950.246219
580.0269260.24680.40284
590.0422860.38760.349663

\begin{tabular}{lllllllll}
\hline
Autocorrelation Function \tabularnewline
Time lag k & ACF(k) & T-STAT & P-value \tabularnewline
0 & 1 & 9.1652 & 0 \tabularnewline
1 & 0.218316 & 2.0009 & 0.024316 \tabularnewline
2 & 0.271162 & 2.4852 & 0.007465 \tabularnewline
3 & 0.253482 & 2.3232 & 0.011293 \tabularnewline
4 & 0.20813 & 1.9075 & 0.029934 \tabularnewline
5 & 0.15716 & 1.4404 & 0.076737 \tabularnewline
6 & 0.113764 & 1.0427 & 0.150047 \tabularnewline
7 & -0.101923 & -0.9341 & 0.823544 \tabularnewline
8 & -0.041187 & -0.3775 & 0.646617 \tabularnewline
9 & -0.039409 & -0.3612 & 0.640568 \tabularnewline
10 & -0.182959 & -1.6768 & 0.951355 \tabularnewline
11 & -0.058004 & -0.5316 & 0.701803 \tabularnewline
12 & -0.387893 & -3.5551 & 0.999688 \tabularnewline
13 & -0.224421 & -2.0569 & 0.978598 \tabularnewline
14 & -0.107517 & -0.9854 & 0.836375 \tabularnewline
15 & -0.079921 & -0.7325 & 0.767044 \tabularnewline
16 & -0.279516 & -2.5618 & 0.993901 \tabularnewline
17 & -0.030679 & -0.2812 & 0.610368 \tabularnewline
18 & -0.055931 & -0.5126 & 0.695218 \tabularnewline
19 & 0.015681 & 0.1437 & 0.443032 \tabularnewline
20 & 0.140636 & 1.289 & 0.100477 \tabularnewline
21 & 0.025731 & 0.2358 & 0.40707 \tabularnewline
22 & 0.058374 & 0.535 & 0.297028 \tabularnewline
23 & 0.109871 & 1.007 & 0.158417 \tabularnewline
24 & -0.037852 & -0.3469 & 0.63524 \tabularnewline
25 & 0.010856 & 0.0995 & 0.460491 \tabularnewline
26 & 0.066196 & 0.6067 & 0.272846 \tabularnewline
27 & -0.052029 & -0.4769 & 0.682647 \tabularnewline
28 & 0.027863 & 0.2554 & 0.39953 \tabularnewline
29 & 0.014846 & 0.1361 & 0.446048 \tabularnewline
30 & -0.097164 & -0.8905 & 0.812137 \tabularnewline
31 & -0.08266 & -0.7576 & 0.774593 \tabularnewline
32 & -0.132893 & -1.218 & 0.88668 \tabularnewline
33 & -0.123592 & -1.1327 & 0.869726 \tabularnewline
34 & -0.107542 & -0.9856 & 0.836429 \tabularnewline
35 & -0.116239 & -1.0654 & 0.855115 \tabularnewline
36 & -0.204401 & -1.8734 & 0.967752 \tabularnewline
37 & -0.019231 & -0.1763 & 0.569741 \tabularnewline
38 & -0.062752 & -0.5751 & 0.716629 \tabularnewline
39 & -0.127323 & -1.1669 & 0.87673 \tabularnewline
40 & 0.023717 & 0.2174 & 0.414222 \tabularnewline
41 & -0.050167 & -0.4598 & 0.676573 \tabularnewline
42 & -0.027328 & -0.2505 & 0.598581 \tabularnewline
43 & 0.077928 & 0.7142 & 0.238535 \tabularnewline
44 & -0.009605 & -0.088 & 0.534969 \tabularnewline
45 & -0.002002 & -0.0183 & 0.507298 \tabularnewline
46 & 0.062418 & 0.5721 & 0.284402 \tabularnewline
47 & -0.016402 & -0.1503 & 0.559565 \tabularnewline
48 & 0.136657 & 1.2525 & 0.106936 \tabularnewline
49 & 0.048998 & 0.4491 & 0.327268 \tabularnewline
50 & -0.003837 & -0.0352 & 0.513984 \tabularnewline
51 & 0.090017 & 0.825 & 0.20585 \tabularnewline
52 & 0.030536 & 0.2799 & 0.390133 \tabularnewline
53 & -0.002007 & -0.0184 & 0.507315 \tabularnewline
54 & 0.055512 & 0.5088 & 0.30612 \tabularnewline
55 & 0.023336 & 0.2139 & 0.415579 \tabularnewline
56 & 0.020175 & 0.1849 & 0.426875 \tabularnewline
57 & 0.075225 & 0.6895 & 0.246219 \tabularnewline
58 & 0.026926 & 0.2468 & 0.40284 \tabularnewline
59 & 0.042286 & 0.3876 & 0.349663 \tabularnewline
\hline
\end{tabular}
%Source: https://freestatistics.org/blog/index.php?pk=7717&T=1

[TABLE]
[ROW][C]Autocorrelation Function[/C][/ROW]
[ROW][C]Time lag k[/C][C]ACF(k)[/C][C]T-STAT[/C][C]P-value[/C][/ROW]
[ROW][C]0[/C][C]1[/C][C]9.1652[/C][C]0[/C][/ROW]
[ROW][C]1[/C][C]0.218316[/C][C]2.0009[/C][C]0.024316[/C][/ROW]
[ROW][C]2[/C][C]0.271162[/C][C]2.4852[/C][C]0.007465[/C][/ROW]
[ROW][C]3[/C][C]0.253482[/C][C]2.3232[/C][C]0.011293[/C][/ROW]
[ROW][C]4[/C][C]0.20813[/C][C]1.9075[/C][C]0.029934[/C][/ROW]
[ROW][C]5[/C][C]0.15716[/C][C]1.4404[/C][C]0.076737[/C][/ROW]
[ROW][C]6[/C][C]0.113764[/C][C]1.0427[/C][C]0.150047[/C][/ROW]
[ROW][C]7[/C][C]-0.101923[/C][C]-0.9341[/C][C]0.823544[/C][/ROW]
[ROW][C]8[/C][C]-0.041187[/C][C]-0.3775[/C][C]0.646617[/C][/ROW]
[ROW][C]9[/C][C]-0.039409[/C][C]-0.3612[/C][C]0.640568[/C][/ROW]
[ROW][C]10[/C][C]-0.182959[/C][C]-1.6768[/C][C]0.951355[/C][/ROW]
[ROW][C]11[/C][C]-0.058004[/C][C]-0.5316[/C][C]0.701803[/C][/ROW]
[ROW][C]12[/C][C]-0.387893[/C][C]-3.5551[/C][C]0.999688[/C][/ROW]
[ROW][C]13[/C][C]-0.224421[/C][C]-2.0569[/C][C]0.978598[/C][/ROW]
[ROW][C]14[/C][C]-0.107517[/C][C]-0.9854[/C][C]0.836375[/C][/ROW]
[ROW][C]15[/C][C]-0.079921[/C][C]-0.7325[/C][C]0.767044[/C][/ROW]
[ROW][C]16[/C][C]-0.279516[/C][C]-2.5618[/C][C]0.993901[/C][/ROW]
[ROW][C]17[/C][C]-0.030679[/C][C]-0.2812[/C][C]0.610368[/C][/ROW]
[ROW][C]18[/C][C]-0.055931[/C][C]-0.5126[/C][C]0.695218[/C][/ROW]
[ROW][C]19[/C][C]0.015681[/C][C]0.1437[/C][C]0.443032[/C][/ROW]
[ROW][C]20[/C][C]0.140636[/C][C]1.289[/C][C]0.100477[/C][/ROW]
[ROW][C]21[/C][C]0.025731[/C][C]0.2358[/C][C]0.40707[/C][/ROW]
[ROW][C]22[/C][C]0.058374[/C][C]0.535[/C][C]0.297028[/C][/ROW]
[ROW][C]23[/C][C]0.109871[/C][C]1.007[/C][C]0.158417[/C][/ROW]
[ROW][C]24[/C][C]-0.037852[/C][C]-0.3469[/C][C]0.63524[/C][/ROW]
[ROW][C]25[/C][C]0.010856[/C][C]0.0995[/C][C]0.460491[/C][/ROW]
[ROW][C]26[/C][C]0.066196[/C][C]0.6067[/C][C]0.272846[/C][/ROW]
[ROW][C]27[/C][C]-0.052029[/C][C]-0.4769[/C][C]0.682647[/C][/ROW]
[ROW][C]28[/C][C]0.027863[/C][C]0.2554[/C][C]0.39953[/C][/ROW]
[ROW][C]29[/C][C]0.014846[/C][C]0.1361[/C][C]0.446048[/C][/ROW]
[ROW][C]30[/C][C]-0.097164[/C][C]-0.8905[/C][C]0.812137[/C][/ROW]
[ROW][C]31[/C][C]-0.08266[/C][C]-0.7576[/C][C]0.774593[/C][/ROW]
[ROW][C]32[/C][C]-0.132893[/C][C]-1.218[/C][C]0.88668[/C][/ROW]
[ROW][C]33[/C][C]-0.123592[/C][C]-1.1327[/C][C]0.869726[/C][/ROW]
[ROW][C]34[/C][C]-0.107542[/C][C]-0.9856[/C][C]0.836429[/C][/ROW]
[ROW][C]35[/C][C]-0.116239[/C][C]-1.0654[/C][C]0.855115[/C][/ROW]
[ROW][C]36[/C][C]-0.204401[/C][C]-1.8734[/C][C]0.967752[/C][/ROW]
[ROW][C]37[/C][C]-0.019231[/C][C]-0.1763[/C][C]0.569741[/C][/ROW]
[ROW][C]38[/C][C]-0.062752[/C][C]-0.5751[/C][C]0.716629[/C][/ROW]
[ROW][C]39[/C][C]-0.127323[/C][C]-1.1669[/C][C]0.87673[/C][/ROW]
[ROW][C]40[/C][C]0.023717[/C][C]0.2174[/C][C]0.414222[/C][/ROW]
[ROW][C]41[/C][C]-0.050167[/C][C]-0.4598[/C][C]0.676573[/C][/ROW]
[ROW][C]42[/C][C]-0.027328[/C][C]-0.2505[/C][C]0.598581[/C][/ROW]
[ROW][C]43[/C][C]0.077928[/C][C]0.7142[/C][C]0.238535[/C][/ROW]
[ROW][C]44[/C][C]-0.009605[/C][C]-0.088[/C][C]0.534969[/C][/ROW]
[ROW][C]45[/C][C]-0.002002[/C][C]-0.0183[/C][C]0.507298[/C][/ROW]
[ROW][C]46[/C][C]0.062418[/C][C]0.5721[/C][C]0.284402[/C][/ROW]
[ROW][C]47[/C][C]-0.016402[/C][C]-0.1503[/C][C]0.559565[/C][/ROW]
[ROW][C]48[/C][C]0.136657[/C][C]1.2525[/C][C]0.106936[/C][/ROW]
[ROW][C]49[/C][C]0.048998[/C][C]0.4491[/C][C]0.327268[/C][/ROW]
[ROW][C]50[/C][C]-0.003837[/C][C]-0.0352[/C][C]0.513984[/C][/ROW]
[ROW][C]51[/C][C]0.090017[/C][C]0.825[/C][C]0.20585[/C][/ROW]
[ROW][C]52[/C][C]0.030536[/C][C]0.2799[/C][C]0.390133[/C][/ROW]
[ROW][C]53[/C][C]-0.002007[/C][C]-0.0184[/C][C]0.507315[/C][/ROW]
[ROW][C]54[/C][C]0.055512[/C][C]0.5088[/C][C]0.30612[/C][/ROW]
[ROW][C]55[/C][C]0.023336[/C][C]0.2139[/C][C]0.415579[/C][/ROW]
[ROW][C]56[/C][C]0.020175[/C][C]0.1849[/C][C]0.426875[/C][/ROW]
[ROW][C]57[/C][C]0.075225[/C][C]0.6895[/C][C]0.246219[/C][/ROW]
[ROW][C]58[/C][C]0.026926[/C][C]0.2468[/C][C]0.40284[/C][/ROW]
[ROW][C]59[/C][C]0.042286[/C][C]0.3876[/C][C]0.349663[/C][/ROW]
[/TABLE]
Source: https://freestatistics.org/blog/index.php?pk=7717&T=1

Globally Unique Identifier (entire table): ba.freestatistics.org/blog/index.php?pk=7717&T=1

As an alternative you can also use a QR Code:  

The GUIDs for individual cells are displayed in the table below:

Autocorrelation Function
Time lag kACF(k)T-STATP-value
019.16520
10.2183162.00090.024316
20.2711622.48520.007465
30.2534822.32320.011293
40.208131.90750.029934
50.157161.44040.076737
60.1137641.04270.150047
7-0.101923-0.93410.823544
8-0.041187-0.37750.646617
9-0.039409-0.36120.640568
10-0.182959-1.67680.951355
11-0.058004-0.53160.701803
12-0.387893-3.55510.999688
13-0.224421-2.05690.978598
14-0.107517-0.98540.836375
15-0.079921-0.73250.767044
16-0.279516-2.56180.993901
17-0.030679-0.28120.610368
18-0.055931-0.51260.695218
190.0156810.14370.443032
200.1406361.2890.100477
210.0257310.23580.40707
220.0583740.5350.297028
230.1098711.0070.158417
24-0.037852-0.34690.63524
250.0108560.09950.460491
260.0661960.60670.272846
27-0.052029-0.47690.682647
280.0278630.25540.39953
290.0148460.13610.446048
30-0.097164-0.89050.812137
31-0.08266-0.75760.774593
32-0.132893-1.2180.88668
33-0.123592-1.13270.869726
34-0.107542-0.98560.836429
35-0.116239-1.06540.855115
36-0.204401-1.87340.967752
37-0.019231-0.17630.569741
38-0.062752-0.57510.716629
39-0.127323-1.16690.87673
400.0237170.21740.414222
41-0.050167-0.45980.676573
42-0.027328-0.25050.598581
430.0779280.71420.238535
44-0.009605-0.0880.534969
45-0.002002-0.01830.507298
460.0624180.57210.284402
47-0.016402-0.15030.559565
480.1366571.25250.106936
490.0489980.44910.327268
50-0.003837-0.03520.513984
510.0900170.8250.20585
520.0305360.27990.390133
53-0.002007-0.01840.507315
540.0555120.50880.30612
550.0233360.21390.415579
560.0201750.18490.426875
570.0752250.68950.246219
580.0269260.24680.40284
590.0422860.38760.349663


Partial Autocorrelation Function
Time lag kPACF(k)T-STATP-value
00.2183162.00090.024316
10.2346862.15090.017177
20.17441.59840.056854
30.0943730.86490.194767
40.0259940.23820.406138
5-0.013202-0.1210.548009
6-0.236742-2.16980.983576
7-0.095281-0.87330.807496
8-0.005524-0.05060.520129
9-0.130578-1.19680.882617
100.0665590.610.271747
11-0.326593-2.99330.998188
12-0.072857-0.66770.746936
130.0983250.90120.185039
140.1467911.34540.091065
15-0.156366-1.43310.922233
160.0852710.78150.218347
170.0932190.85440.197666
18-0.021496-0.1970.577852
190.1350011.23730.109711
200.0128460.11770.453281
21-0.08697-0.79710.786178
22-0.026087-0.23910.594192
23-0.303265-2.77950.996641
24-0.147592-1.35270.91011
250.0587270.53820.295918
260.1325921.21520.113843
27-0.082295-0.75420.773594
280.0526020.48210.315494
290.0144360.13230.447528
30-0.113776-1.04280.849978
31-0.068948-0.63190.735423
320.0632380.57960.281873
33-0.075459-0.69160.75445
34-0.001051-0.00960.503832
35-0.246424-2.25850.986747
36-0.053152-0.48710.686289
370.0834860.76520.223159
38-0.015625-0.14320.556766
39-0.067274-0.61660.730409
40-0.03189-0.29230.614601
41-0.005993-0.05490.521837
420.0111530.10220.459414
43-0.047582-0.43610.668056
440.0660050.60490.273424
45-0.064667-0.59270.722507
46-0.080094-0.73410.767526
47-0.123696-1.13370.869926
48-0.075521-0.69220.754629
490.0750840.68820.246626
500.1028840.94290.174206
51-0.122755-1.12510.868117
52-0.017477-0.16020.563436
530.0558170.51160.305147
540.0158060.14490.442581
550.0193450.17730.429849
560.0754940.69190.245448
57-0.051246-0.46970.6801
58-0.037132-0.34030.632768
59-0.126569-1.160.875337

\begin{tabular}{lllllllll}
\hline
Partial Autocorrelation Function \tabularnewline
Time lag k & PACF(k) & T-STAT & P-value \tabularnewline
0 & 0.218316 & 2.0009 & 0.024316 \tabularnewline
1 & 0.234686 & 2.1509 & 0.017177 \tabularnewline
2 & 0.1744 & 1.5984 & 0.056854 \tabularnewline
3 & 0.094373 & 0.8649 & 0.194767 \tabularnewline
4 & 0.025994 & 0.2382 & 0.406138 \tabularnewline
5 & -0.013202 & -0.121 & 0.548009 \tabularnewline
6 & -0.236742 & -2.1698 & 0.983576 \tabularnewline
7 & -0.095281 & -0.8733 & 0.807496 \tabularnewline
8 & -0.005524 & -0.0506 & 0.520129 \tabularnewline
9 & -0.130578 & -1.1968 & 0.882617 \tabularnewline
10 & 0.066559 & 0.61 & 0.271747 \tabularnewline
11 & -0.326593 & -2.9933 & 0.998188 \tabularnewline
12 & -0.072857 & -0.6677 & 0.746936 \tabularnewline
13 & 0.098325 & 0.9012 & 0.185039 \tabularnewline
14 & 0.146791 & 1.3454 & 0.091065 \tabularnewline
15 & -0.156366 & -1.4331 & 0.922233 \tabularnewline
16 & 0.085271 & 0.7815 & 0.218347 \tabularnewline
17 & 0.093219 & 0.8544 & 0.197666 \tabularnewline
18 & -0.021496 & -0.197 & 0.577852 \tabularnewline
19 & 0.135001 & 1.2373 & 0.109711 \tabularnewline
20 & 0.012846 & 0.1177 & 0.453281 \tabularnewline
21 & -0.08697 & -0.7971 & 0.786178 \tabularnewline
22 & -0.026087 & -0.2391 & 0.594192 \tabularnewline
23 & -0.303265 & -2.7795 & 0.996641 \tabularnewline
24 & -0.147592 & -1.3527 & 0.91011 \tabularnewline
25 & 0.058727 & 0.5382 & 0.295918 \tabularnewline
26 & 0.132592 & 1.2152 & 0.113843 \tabularnewline
27 & -0.082295 & -0.7542 & 0.773594 \tabularnewline
28 & 0.052602 & 0.4821 & 0.315494 \tabularnewline
29 & 0.014436 & 0.1323 & 0.447528 \tabularnewline
30 & -0.113776 & -1.0428 & 0.849978 \tabularnewline
31 & -0.068948 & -0.6319 & 0.735423 \tabularnewline
32 & 0.063238 & 0.5796 & 0.281873 \tabularnewline
33 & -0.075459 & -0.6916 & 0.75445 \tabularnewline
34 & -0.001051 & -0.0096 & 0.503832 \tabularnewline
35 & -0.246424 & -2.2585 & 0.986747 \tabularnewline
36 & -0.053152 & -0.4871 & 0.686289 \tabularnewline
37 & 0.083486 & 0.7652 & 0.223159 \tabularnewline
38 & -0.015625 & -0.1432 & 0.556766 \tabularnewline
39 & -0.067274 & -0.6166 & 0.730409 \tabularnewline
40 & -0.03189 & -0.2923 & 0.614601 \tabularnewline
41 & -0.005993 & -0.0549 & 0.521837 \tabularnewline
42 & 0.011153 & 0.1022 & 0.459414 \tabularnewline
43 & -0.047582 & -0.4361 & 0.668056 \tabularnewline
44 & 0.066005 & 0.6049 & 0.273424 \tabularnewline
45 & -0.064667 & -0.5927 & 0.722507 \tabularnewline
46 & -0.080094 & -0.7341 & 0.767526 \tabularnewline
47 & -0.123696 & -1.1337 & 0.869926 \tabularnewline
48 & -0.075521 & -0.6922 & 0.754629 \tabularnewline
49 & 0.075084 & 0.6882 & 0.246626 \tabularnewline
50 & 0.102884 & 0.9429 & 0.174206 \tabularnewline
51 & -0.122755 & -1.1251 & 0.868117 \tabularnewline
52 & -0.017477 & -0.1602 & 0.563436 \tabularnewline
53 & 0.055817 & 0.5116 & 0.305147 \tabularnewline
54 & 0.015806 & 0.1449 & 0.442581 \tabularnewline
55 & 0.019345 & 0.1773 & 0.429849 \tabularnewline
56 & 0.075494 & 0.6919 & 0.245448 \tabularnewline
57 & -0.051246 & -0.4697 & 0.6801 \tabularnewline
58 & -0.037132 & -0.3403 & 0.632768 \tabularnewline
59 & -0.126569 & -1.16 & 0.875337 \tabularnewline
\hline
\end{tabular}
%Source: https://freestatistics.org/blog/index.php?pk=7717&T=2

[TABLE]
[ROW][C]Partial Autocorrelation Function[/C][/ROW]
[ROW][C]Time lag k[/C][C]PACF(k)[/C][C]T-STAT[/C][C]P-value[/C][/ROW]
[ROW][C]0[/C][C]0.218316[/C][C]2.0009[/C][C]0.024316[/C][/ROW]
[ROW][C]1[/C][C]0.234686[/C][C]2.1509[/C][C]0.017177[/C][/ROW]
[ROW][C]2[/C][C]0.1744[/C][C]1.5984[/C][C]0.056854[/C][/ROW]
[ROW][C]3[/C][C]0.094373[/C][C]0.8649[/C][C]0.194767[/C][/ROW]
[ROW][C]4[/C][C]0.025994[/C][C]0.2382[/C][C]0.406138[/C][/ROW]
[ROW][C]5[/C][C]-0.013202[/C][C]-0.121[/C][C]0.548009[/C][/ROW]
[ROW][C]6[/C][C]-0.236742[/C][C]-2.1698[/C][C]0.983576[/C][/ROW]
[ROW][C]7[/C][C]-0.095281[/C][C]-0.8733[/C][C]0.807496[/C][/ROW]
[ROW][C]8[/C][C]-0.005524[/C][C]-0.0506[/C][C]0.520129[/C][/ROW]
[ROW][C]9[/C][C]-0.130578[/C][C]-1.1968[/C][C]0.882617[/C][/ROW]
[ROW][C]10[/C][C]0.066559[/C][C]0.61[/C][C]0.271747[/C][/ROW]
[ROW][C]11[/C][C]-0.326593[/C][C]-2.9933[/C][C]0.998188[/C][/ROW]
[ROW][C]12[/C][C]-0.072857[/C][C]-0.6677[/C][C]0.746936[/C][/ROW]
[ROW][C]13[/C][C]0.098325[/C][C]0.9012[/C][C]0.185039[/C][/ROW]
[ROW][C]14[/C][C]0.146791[/C][C]1.3454[/C][C]0.091065[/C][/ROW]
[ROW][C]15[/C][C]-0.156366[/C][C]-1.4331[/C][C]0.922233[/C][/ROW]
[ROW][C]16[/C][C]0.085271[/C][C]0.7815[/C][C]0.218347[/C][/ROW]
[ROW][C]17[/C][C]0.093219[/C][C]0.8544[/C][C]0.197666[/C][/ROW]
[ROW][C]18[/C][C]-0.021496[/C][C]-0.197[/C][C]0.577852[/C][/ROW]
[ROW][C]19[/C][C]0.135001[/C][C]1.2373[/C][C]0.109711[/C][/ROW]
[ROW][C]20[/C][C]0.012846[/C][C]0.1177[/C][C]0.453281[/C][/ROW]
[ROW][C]21[/C][C]-0.08697[/C][C]-0.7971[/C][C]0.786178[/C][/ROW]
[ROW][C]22[/C][C]-0.026087[/C][C]-0.2391[/C][C]0.594192[/C][/ROW]
[ROW][C]23[/C][C]-0.303265[/C][C]-2.7795[/C][C]0.996641[/C][/ROW]
[ROW][C]24[/C][C]-0.147592[/C][C]-1.3527[/C][C]0.91011[/C][/ROW]
[ROW][C]25[/C][C]0.058727[/C][C]0.5382[/C][C]0.295918[/C][/ROW]
[ROW][C]26[/C][C]0.132592[/C][C]1.2152[/C][C]0.113843[/C][/ROW]
[ROW][C]27[/C][C]-0.082295[/C][C]-0.7542[/C][C]0.773594[/C][/ROW]
[ROW][C]28[/C][C]0.052602[/C][C]0.4821[/C][C]0.315494[/C][/ROW]
[ROW][C]29[/C][C]0.014436[/C][C]0.1323[/C][C]0.447528[/C][/ROW]
[ROW][C]30[/C][C]-0.113776[/C][C]-1.0428[/C][C]0.849978[/C][/ROW]
[ROW][C]31[/C][C]-0.068948[/C][C]-0.6319[/C][C]0.735423[/C][/ROW]
[ROW][C]32[/C][C]0.063238[/C][C]0.5796[/C][C]0.281873[/C][/ROW]
[ROW][C]33[/C][C]-0.075459[/C][C]-0.6916[/C][C]0.75445[/C][/ROW]
[ROW][C]34[/C][C]-0.001051[/C][C]-0.0096[/C][C]0.503832[/C][/ROW]
[ROW][C]35[/C][C]-0.246424[/C][C]-2.2585[/C][C]0.986747[/C][/ROW]
[ROW][C]36[/C][C]-0.053152[/C][C]-0.4871[/C][C]0.686289[/C][/ROW]
[ROW][C]37[/C][C]0.083486[/C][C]0.7652[/C][C]0.223159[/C][/ROW]
[ROW][C]38[/C][C]-0.015625[/C][C]-0.1432[/C][C]0.556766[/C][/ROW]
[ROW][C]39[/C][C]-0.067274[/C][C]-0.6166[/C][C]0.730409[/C][/ROW]
[ROW][C]40[/C][C]-0.03189[/C][C]-0.2923[/C][C]0.614601[/C][/ROW]
[ROW][C]41[/C][C]-0.005993[/C][C]-0.0549[/C][C]0.521837[/C][/ROW]
[ROW][C]42[/C][C]0.011153[/C][C]0.1022[/C][C]0.459414[/C][/ROW]
[ROW][C]43[/C][C]-0.047582[/C][C]-0.4361[/C][C]0.668056[/C][/ROW]
[ROW][C]44[/C][C]0.066005[/C][C]0.6049[/C][C]0.273424[/C][/ROW]
[ROW][C]45[/C][C]-0.064667[/C][C]-0.5927[/C][C]0.722507[/C][/ROW]
[ROW][C]46[/C][C]-0.080094[/C][C]-0.7341[/C][C]0.767526[/C][/ROW]
[ROW][C]47[/C][C]-0.123696[/C][C]-1.1337[/C][C]0.869926[/C][/ROW]
[ROW][C]48[/C][C]-0.075521[/C][C]-0.6922[/C][C]0.754629[/C][/ROW]
[ROW][C]49[/C][C]0.075084[/C][C]0.6882[/C][C]0.246626[/C][/ROW]
[ROW][C]50[/C][C]0.102884[/C][C]0.9429[/C][C]0.174206[/C][/ROW]
[ROW][C]51[/C][C]-0.122755[/C][C]-1.1251[/C][C]0.868117[/C][/ROW]
[ROW][C]52[/C][C]-0.017477[/C][C]-0.1602[/C][C]0.563436[/C][/ROW]
[ROW][C]53[/C][C]0.055817[/C][C]0.5116[/C][C]0.305147[/C][/ROW]
[ROW][C]54[/C][C]0.015806[/C][C]0.1449[/C][C]0.442581[/C][/ROW]
[ROW][C]55[/C][C]0.019345[/C][C]0.1773[/C][C]0.429849[/C][/ROW]
[ROW][C]56[/C][C]0.075494[/C][C]0.6919[/C][C]0.245448[/C][/ROW]
[ROW][C]57[/C][C]-0.051246[/C][C]-0.4697[/C][C]0.6801[/C][/ROW]
[ROW][C]58[/C][C]-0.037132[/C][C]-0.3403[/C][C]0.632768[/C][/ROW]
[ROW][C]59[/C][C]-0.126569[/C][C]-1.16[/C][C]0.875337[/C][/ROW]
[/TABLE]
Source: https://freestatistics.org/blog/index.php?pk=7717&T=2

Globally Unique Identifier (entire table): ba.freestatistics.org/blog/index.php?pk=7717&T=2

As an alternative you can also use a QR Code:  

The GUIDs for individual cells are displayed in the table below:

Partial Autocorrelation Function
Time lag kPACF(k)T-STATP-value
00.2183162.00090.024316
10.2346862.15090.017177
20.17441.59840.056854
30.0943730.86490.194767
40.0259940.23820.406138
5-0.013202-0.1210.548009
6-0.236742-2.16980.983576
7-0.095281-0.87330.807496
8-0.005524-0.05060.520129
9-0.130578-1.19680.882617
100.0665590.610.271747
11-0.326593-2.99330.998188
12-0.072857-0.66770.746936
130.0983250.90120.185039
140.1467911.34540.091065
15-0.156366-1.43310.922233
160.0852710.78150.218347
170.0932190.85440.197666
18-0.021496-0.1970.577852
190.1350011.23730.109711
200.0128460.11770.453281
21-0.08697-0.79710.786178
22-0.026087-0.23910.594192
23-0.303265-2.77950.996641
24-0.147592-1.35270.91011
250.0587270.53820.295918
260.1325921.21520.113843
27-0.082295-0.75420.773594
280.0526020.48210.315494
290.0144360.13230.447528
30-0.113776-1.04280.849978
31-0.068948-0.63190.735423
320.0632380.57960.281873
33-0.075459-0.69160.75445
34-0.001051-0.00960.503832
35-0.246424-2.25850.986747
36-0.053152-0.48710.686289
370.0834860.76520.223159
38-0.015625-0.14320.556766
39-0.067274-0.61660.730409
40-0.03189-0.29230.614601
41-0.005993-0.05490.521837
420.0111530.10220.459414
43-0.047582-0.43610.668056
440.0660050.60490.273424
45-0.064667-0.59270.722507
46-0.080094-0.73410.767526
47-0.123696-1.13370.869926
48-0.075521-0.69220.754629
490.0750840.68820.246626
500.1028840.94290.174206
51-0.122755-1.12510.868117
52-0.017477-0.16020.563436
530.0558170.51160.305147
540.0158060.14490.442581
550.0193450.17730.429849
560.0754940.69190.245448
57-0.051246-0.46970.6801
58-0.037132-0.34030.632768
59-0.126569-1.160.875337


Parameters (Session):
par1 = 60 ; par2 = -1.8 ; par3 = 0 ; par4 = 1 ; par5 = 12 ;
Parameters (R input):
par1 = 60 ; par2 = -1.8 ; par3 = 0 ; par4 = 1 ; par5 = 12 ;
R code (references can be found in the software module):
if (par1 == 'Default') {
par1 = 10*log10(length(x))
} else {
par1 <- as.numeric(par1)
}
par2 <- as.numeric(par2)
par3 <- as.numeric(par3)
par4 <- as.numeric(par4)
par5 <- as.numeric(par5)
if (par2 == 0) {
x <- log(x)
} else {
x <- (x ^ par2 - 1) / par2
}
if (par3 > 0) x <- diff(x,lag=1,difference=par3)
if (par4 > 0) x <- diff(x,lag=par5,difference=par4)
bitmap(file='pic1.png')
racf <- acf(x,par1,main='Autocorrelation',xlab='lags',ylab='ACF')
dev.off()
bitmap(file='pic2.png')
rpacf <- pacf(x,par1,main='Partial Autocorrelation',xlab='lags',ylab='PACF')
dev.off()
(myacf <- c(racf$acf))
(mypacf <- c(rpacf$acf))
lengthx <- length(x)
sqrtn <- sqrt(lengthx)
load(file='createtable')
a<-table.start()
a<-table.row.start(a)
a<-table.element(a,'Autocorrelation Function',4,TRUE)
a<-table.row.end(a)
a<-table.row.start(a)
a<-table.element(a,'Time lag k',header=TRUE)
a<-table.element(a,hyperlink('basics.htm','ACF(k)','click here for more information about the Autocorrelation Function'),header=TRUE)
a<-table.element(a,'T-STAT',header=TRUE)
a<-table.element(a,'P-value',header=TRUE)
a<-table.row.end(a)
for (i in 1:par1) {
a<-table.row.start(a)
a<-table.element(a,i-1,header=TRUE)
a<-table.element(a,round(myacf[i],6))
mytstat <- myacf[i]*sqrtn
a<-table.element(a,round(mytstat,4))
a<-table.element(a,round(1-pt(mytstat,lengthx),6))
a<-table.row.end(a)
}
a<-table.end(a)
table.save(a,file='mytable.tab')
a<-table.start()
a<-table.row.start(a)
a<-table.element(a,'Partial Autocorrelation Function',4,TRUE)
a<-table.row.end(a)
a<-table.row.start(a)
a<-table.element(a,'Time lag k',header=TRUE)
a<-table.element(a,hyperlink('basics.htm','PACF(k)','click here for more information about the Partial Autocorrelation Function'),header=TRUE)
a<-table.element(a,'T-STAT',header=TRUE)
a<-table.element(a,'P-value',header=TRUE)
a<-table.row.end(a)
for (i in 1:par1) {
a<-table.row.start(a)
a<-table.element(a,i-1,header=TRUE)
a<-table.element(a,round(mypacf[i],6))
mytstat <- mypacf[i]*sqrtn
a<-table.element(a,round(mytstat,4))
a<-table.element(a,round(1-pt(mytstat,lengthx),6))
a<-table.row.end(a)
}
a<-table.end(a)
table.save(a,file='mytable1.tab')