Free Statistics

of Irreproducible Research!

Author's title

Author*Unverified author*
R Software Modulerwasp_autocorrelation.wasp
Title produced by software(Partial) Autocorrelation Function
Date of computationFri, 30 Nov 2007 07:41:33 -0700
Cite this page as followsStatistical Computations at FreeStatistics.org, Office for Research Development and Education, URL https://freestatistics.org/blog/index.php?v=date/2007/Nov/30/t1196433070gu59ls5j77dju1v.htm/, Retrieved Sun, 28 Apr 2024 17:38:09 +0000
Statistical Computations at FreeStatistics.org, Office for Research Development and Education, URL https://freestatistics.org/blog/index.php?pk=7713, Retrieved Sun, 28 Apr 2024 17:38:09 +0000
QR Codes:

Original text written by user:
IsPrivate?No (this computation is public)
User-defined keywords
Estimated Impact158
Family? (F = Feedback message, R = changed R code, M = changed R Module, P = changed Parameters, D = changed Data)
-       [(Partial) Autocorrelation Function] [] [2007-11-30 14:41:33] [48e0b7671e607713e2c1c3706de6df4e] [Current]
Feedback Forum

Post a new message
Dataseries X:
106,8
113,7
102,5
96,6
92,1
95,6
102,3
98,6
98,2
104,5
84
73,8
103,9
106
97,2
102,6
89
93,8
116,7
106,8
98,5
118,7
90
91,9
113,3
113,1
104,1
108,7
96,7
101
116,9
105,8
99
129,4
83
88,9
115,9
104,2
113,4
112,2
100,8
107,3
126,6
102,9
117,9
128,8
87,5
93,8
122,7
126,2
124,6
116,7
115,2
111,1
129,9
113,3
118,5
133,5
102,1
102,4


Summary of compuational transaction
Raw Inputview raw input (R code)
Raw Outputview raw output of R engine
Computing time2 seconds
R Server'Gwilym Jenkins' @ 72.249.127.135

\begin{tabular}{lllllllll}
\hline
Summary of compuational transaction \tabularnewline
Raw Input & view raw input (R code)  \tabularnewline
Raw Output & view raw output of R engine  \tabularnewline
Computing time & 2 seconds \tabularnewline
R Server & 'Gwilym Jenkins' @ 72.249.127.135 \tabularnewline
\hline
\end{tabular}
%Source: https://freestatistics.org/blog/index.php?pk=7713&T=0

[TABLE]
[ROW][C]Summary of compuational transaction[/C][/ROW]
[ROW][C]Raw Input[/C][C]view raw input (R code) [/C][/ROW]
[ROW][C]Raw Output[/C][C]view raw output of R engine [/C][/ROW]
[ROW][C]Computing time[/C][C]2 seconds[/C][/ROW]
[ROW][C]R Server[/C][C]'Gwilym Jenkins' @ 72.249.127.135[/C][/ROW]
[/TABLE]
Source: https://freestatistics.org/blog/index.php?pk=7713&T=0

Globally Unique Identifier (entire table): ba.freestatistics.org/blog/index.php?pk=7713&T=0

As an alternative you can also use a QR Code:  

The GUIDs for individual cells are displayed in the table below:

Summary of compuational transaction
Raw Inputview raw input (R code)
Raw Outputview raw output of R engine
Computing time2 seconds
R Server'Gwilym Jenkins' @ 72.249.127.135


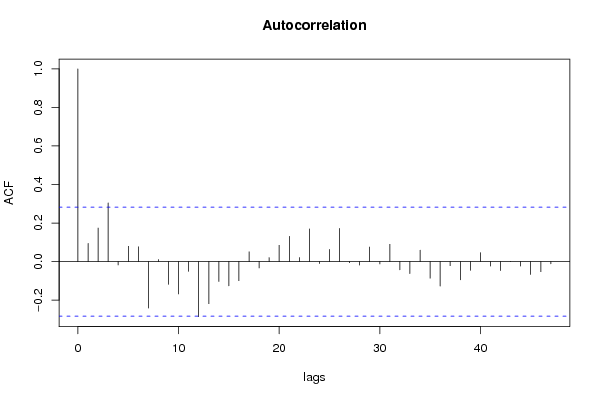
Autocorrelation Function
Time lag kACF(k)T-STATP-value
016.92820
10.0938190.650.259397
20.1740141.20560.11694
30.3042522.10790.020142
4-0.017648-0.12230.548402
50.078810.5460.293793
60.0762140.5280.299958
7-0.241365-1.67220.949506
80.0105120.07280.471123
9-0.118087-0.81810.791338
10-0.16855-1.16770.875661
11-0.050764-0.35170.636699
12-0.28617-1.98260.973427
13-0.218581-1.51440.931755
14-0.103457-0.71680.761505
15-0.126216-0.87450.806887
16-0.099569-0.68980.753191
170.0503230.34860.36444
18-0.03327-0.23050.590658
190.0203560.1410.444218
200.084240.58360.2811
210.1307090.90560.184841
220.0206110.14280.443524
230.1691431.17190.12352
24-0.010816-0.07490.529712
250.0629260.4360.332409
260.1721271.19250.119458
27-0.006016-0.04170.516536
28-0.018372-0.12730.550377
290.0749030.51890.303093
30-0.012222-0.08470.533565
310.0893520.61910.269405
32-0.042947-0.29750.616334
33-0.062255-0.43130.665914
340.0590040.40880.342254
35-0.086231-0.59740.723484
36-0.127175-0.88110.808671
37-0.021624-0.14980.559232
38-0.094996-0.65810.743207
39-0.045759-0.3170.623702
400.0460370.3190.375573
41-0.023583-0.16340.56455
42-0.046806-0.32430.626433
430.0002790.00190.499234
44-0.023274-0.16120.563711
45-0.067172-0.46540.67812
46-0.052584-0.36430.641389
47-0.012122-0.0840.533289

\begin{tabular}{lllllllll}
\hline
Autocorrelation Function \tabularnewline
Time lag k & ACF(k) & T-STAT & P-value \tabularnewline
0 & 1 & 6.9282 & 0 \tabularnewline
1 & 0.093819 & 0.65 & 0.259397 \tabularnewline
2 & 0.174014 & 1.2056 & 0.11694 \tabularnewline
3 & 0.304252 & 2.1079 & 0.020142 \tabularnewline
4 & -0.017648 & -0.1223 & 0.548402 \tabularnewline
5 & 0.07881 & 0.546 & 0.293793 \tabularnewline
6 & 0.076214 & 0.528 & 0.299958 \tabularnewline
7 & -0.241365 & -1.6722 & 0.949506 \tabularnewline
8 & 0.010512 & 0.0728 & 0.471123 \tabularnewline
9 & -0.118087 & -0.8181 & 0.791338 \tabularnewline
10 & -0.16855 & -1.1677 & 0.875661 \tabularnewline
11 & -0.050764 & -0.3517 & 0.636699 \tabularnewline
12 & -0.28617 & -1.9826 & 0.973427 \tabularnewline
13 & -0.218581 & -1.5144 & 0.931755 \tabularnewline
14 & -0.103457 & -0.7168 & 0.761505 \tabularnewline
15 & -0.126216 & -0.8745 & 0.806887 \tabularnewline
16 & -0.099569 & -0.6898 & 0.753191 \tabularnewline
17 & 0.050323 & 0.3486 & 0.36444 \tabularnewline
18 & -0.03327 & -0.2305 & 0.590658 \tabularnewline
19 & 0.020356 & 0.141 & 0.444218 \tabularnewline
20 & 0.08424 & 0.5836 & 0.2811 \tabularnewline
21 & 0.130709 & 0.9056 & 0.184841 \tabularnewline
22 & 0.020611 & 0.1428 & 0.443524 \tabularnewline
23 & 0.169143 & 1.1719 & 0.12352 \tabularnewline
24 & -0.010816 & -0.0749 & 0.529712 \tabularnewline
25 & 0.062926 & 0.436 & 0.332409 \tabularnewline
26 & 0.172127 & 1.1925 & 0.119458 \tabularnewline
27 & -0.006016 & -0.0417 & 0.516536 \tabularnewline
28 & -0.018372 & -0.1273 & 0.550377 \tabularnewline
29 & 0.074903 & 0.5189 & 0.303093 \tabularnewline
30 & -0.012222 & -0.0847 & 0.533565 \tabularnewline
31 & 0.089352 & 0.6191 & 0.269405 \tabularnewline
32 & -0.042947 & -0.2975 & 0.616334 \tabularnewline
33 & -0.062255 & -0.4313 & 0.665914 \tabularnewline
34 & 0.059004 & 0.4088 & 0.342254 \tabularnewline
35 & -0.086231 & -0.5974 & 0.723484 \tabularnewline
36 & -0.127175 & -0.8811 & 0.808671 \tabularnewline
37 & -0.021624 & -0.1498 & 0.559232 \tabularnewline
38 & -0.094996 & -0.6581 & 0.743207 \tabularnewline
39 & -0.045759 & -0.317 & 0.623702 \tabularnewline
40 & 0.046037 & 0.319 & 0.375573 \tabularnewline
41 & -0.023583 & -0.1634 & 0.56455 \tabularnewline
42 & -0.046806 & -0.3243 & 0.626433 \tabularnewline
43 & 0.000279 & 0.0019 & 0.499234 \tabularnewline
44 & -0.023274 & -0.1612 & 0.563711 \tabularnewline
45 & -0.067172 & -0.4654 & 0.67812 \tabularnewline
46 & -0.052584 & -0.3643 & 0.641389 \tabularnewline
47 & -0.012122 & -0.084 & 0.533289 \tabularnewline
\hline
\end{tabular}
%Source: https://freestatistics.org/blog/index.php?pk=7713&T=1

[TABLE]
[ROW][C]Autocorrelation Function[/C][/ROW]
[ROW][C]Time lag k[/C][C]ACF(k)[/C][C]T-STAT[/C][C]P-value[/C][/ROW]
[ROW][C]0[/C][C]1[/C][C]6.9282[/C][C]0[/C][/ROW]
[ROW][C]1[/C][C]0.093819[/C][C]0.65[/C][C]0.259397[/C][/ROW]
[ROW][C]2[/C][C]0.174014[/C][C]1.2056[/C][C]0.11694[/C][/ROW]
[ROW][C]3[/C][C]0.304252[/C][C]2.1079[/C][C]0.020142[/C][/ROW]
[ROW][C]4[/C][C]-0.017648[/C][C]-0.1223[/C][C]0.548402[/C][/ROW]
[ROW][C]5[/C][C]0.07881[/C][C]0.546[/C][C]0.293793[/C][/ROW]
[ROW][C]6[/C][C]0.076214[/C][C]0.528[/C][C]0.299958[/C][/ROW]
[ROW][C]7[/C][C]-0.241365[/C][C]-1.6722[/C][C]0.949506[/C][/ROW]
[ROW][C]8[/C][C]0.010512[/C][C]0.0728[/C][C]0.471123[/C][/ROW]
[ROW][C]9[/C][C]-0.118087[/C][C]-0.8181[/C][C]0.791338[/C][/ROW]
[ROW][C]10[/C][C]-0.16855[/C][C]-1.1677[/C][C]0.875661[/C][/ROW]
[ROW][C]11[/C][C]-0.050764[/C][C]-0.3517[/C][C]0.636699[/C][/ROW]
[ROW][C]12[/C][C]-0.28617[/C][C]-1.9826[/C][C]0.973427[/C][/ROW]
[ROW][C]13[/C][C]-0.218581[/C][C]-1.5144[/C][C]0.931755[/C][/ROW]
[ROW][C]14[/C][C]-0.103457[/C][C]-0.7168[/C][C]0.761505[/C][/ROW]
[ROW][C]15[/C][C]-0.126216[/C][C]-0.8745[/C][C]0.806887[/C][/ROW]
[ROW][C]16[/C][C]-0.099569[/C][C]-0.6898[/C][C]0.753191[/C][/ROW]
[ROW][C]17[/C][C]0.050323[/C][C]0.3486[/C][C]0.36444[/C][/ROW]
[ROW][C]18[/C][C]-0.03327[/C][C]-0.2305[/C][C]0.590658[/C][/ROW]
[ROW][C]19[/C][C]0.020356[/C][C]0.141[/C][C]0.444218[/C][/ROW]
[ROW][C]20[/C][C]0.08424[/C][C]0.5836[/C][C]0.2811[/C][/ROW]
[ROW][C]21[/C][C]0.130709[/C][C]0.9056[/C][C]0.184841[/C][/ROW]
[ROW][C]22[/C][C]0.020611[/C][C]0.1428[/C][C]0.443524[/C][/ROW]
[ROW][C]23[/C][C]0.169143[/C][C]1.1719[/C][C]0.12352[/C][/ROW]
[ROW][C]24[/C][C]-0.010816[/C][C]-0.0749[/C][C]0.529712[/C][/ROW]
[ROW][C]25[/C][C]0.062926[/C][C]0.436[/C][C]0.332409[/C][/ROW]
[ROW][C]26[/C][C]0.172127[/C][C]1.1925[/C][C]0.119458[/C][/ROW]
[ROW][C]27[/C][C]-0.006016[/C][C]-0.0417[/C][C]0.516536[/C][/ROW]
[ROW][C]28[/C][C]-0.018372[/C][C]-0.1273[/C][C]0.550377[/C][/ROW]
[ROW][C]29[/C][C]0.074903[/C][C]0.5189[/C][C]0.303093[/C][/ROW]
[ROW][C]30[/C][C]-0.012222[/C][C]-0.0847[/C][C]0.533565[/C][/ROW]
[ROW][C]31[/C][C]0.089352[/C][C]0.6191[/C][C]0.269405[/C][/ROW]
[ROW][C]32[/C][C]-0.042947[/C][C]-0.2975[/C][C]0.616334[/C][/ROW]
[ROW][C]33[/C][C]-0.062255[/C][C]-0.4313[/C][C]0.665914[/C][/ROW]
[ROW][C]34[/C][C]0.059004[/C][C]0.4088[/C][C]0.342254[/C][/ROW]
[ROW][C]35[/C][C]-0.086231[/C][C]-0.5974[/C][C]0.723484[/C][/ROW]
[ROW][C]36[/C][C]-0.127175[/C][C]-0.8811[/C][C]0.808671[/C][/ROW]
[ROW][C]37[/C][C]-0.021624[/C][C]-0.1498[/C][C]0.559232[/C][/ROW]
[ROW][C]38[/C][C]-0.094996[/C][C]-0.6581[/C][C]0.743207[/C][/ROW]
[ROW][C]39[/C][C]-0.045759[/C][C]-0.317[/C][C]0.623702[/C][/ROW]
[ROW][C]40[/C][C]0.046037[/C][C]0.319[/C][C]0.375573[/C][/ROW]
[ROW][C]41[/C][C]-0.023583[/C][C]-0.1634[/C][C]0.56455[/C][/ROW]
[ROW][C]42[/C][C]-0.046806[/C][C]-0.3243[/C][C]0.626433[/C][/ROW]
[ROW][C]43[/C][C]0.000279[/C][C]0.0019[/C][C]0.499234[/C][/ROW]
[ROW][C]44[/C][C]-0.023274[/C][C]-0.1612[/C][C]0.563711[/C][/ROW]
[ROW][C]45[/C][C]-0.067172[/C][C]-0.4654[/C][C]0.67812[/C][/ROW]
[ROW][C]46[/C][C]-0.052584[/C][C]-0.3643[/C][C]0.641389[/C][/ROW]
[ROW][C]47[/C][C]-0.012122[/C][C]-0.084[/C][C]0.533289[/C][/ROW]
[/TABLE]
Source: https://freestatistics.org/blog/index.php?pk=7713&T=1

Globally Unique Identifier (entire table): ba.freestatistics.org/blog/index.php?pk=7713&T=1

As an alternative you can also use a QR Code:  

The GUIDs for individual cells are displayed in the table below:

Autocorrelation Function
Time lag kACF(k)T-STATP-value
016.92820
10.0938190.650.259397
20.1740141.20560.11694
30.3042522.10790.020142
4-0.017648-0.12230.548402
50.078810.5460.293793
60.0762140.5280.299958
7-0.241365-1.67220.949506
80.0105120.07280.471123
9-0.118087-0.81810.791338
10-0.16855-1.16770.875661
11-0.050764-0.35170.636699
12-0.28617-1.98260.973427
13-0.218581-1.51440.931755
14-0.103457-0.71680.761505
15-0.126216-0.87450.806887
16-0.099569-0.68980.753191
170.0503230.34860.36444
18-0.03327-0.23050.590658
190.0203560.1410.444218
200.084240.58360.2811
210.1307090.90560.184841
220.0206110.14280.443524
230.1691431.17190.12352
24-0.010816-0.07490.529712
250.0629260.4360.332409
260.1721271.19250.119458
27-0.006016-0.04170.516536
28-0.018372-0.12730.550377
290.0749030.51890.303093
30-0.012222-0.08470.533565
310.0893520.61910.269405
32-0.042947-0.29750.616334
33-0.062255-0.43130.665914
340.0590040.40880.342254
35-0.086231-0.59740.723484
36-0.127175-0.88110.808671
37-0.021624-0.14980.559232
38-0.094996-0.65810.743207
39-0.045759-0.3170.623702
400.0460370.3190.375573
41-0.023583-0.16340.56455
42-0.046806-0.32430.626433
430.0002790.00190.499234
44-0.023274-0.16120.563711
45-0.067172-0.46540.67812
46-0.052584-0.36430.641389
47-0.012122-0.0840.533289


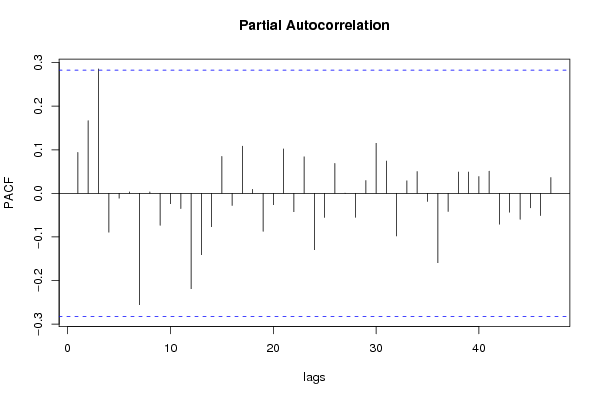
Partial Autocorrelation Function
Time lag kPACF(k)T-STATP-value
00.0938190.650.259397
10.1666791.15480.126947
20.2853811.97720.02689
3-0.089088-0.61720.729996
4-0.011177-0.07740.530701
50.0033680.02330.49074
6-0.255563-1.77060.95851
70.0032170.02230.491155
8-0.073265-0.50760.692969
9-0.023811-0.1650.565168
10-0.034816-0.24120.59479
11-0.218808-1.51590.931954
12-0.140783-0.97540.832868
13-0.076484-0.52990.700688
140.0845910.58610.280289
15-0.027794-0.19260.575943
160.1081770.74950.228615
170.009120.06320.474941
18-0.087202-0.60420.725706
19-0.026024-0.18030.571162
200.1019070.7060.241791
21-0.042217-0.29250.614413
220.0837620.58030.282208
23-0.12931-0.89590.812608
24-0.055327-0.38330.648411
250.0687070.4760.318111
260.0004990.00350.498629
27-0.054889-0.38030.647294
280.0294630.20410.419559
290.114820.79550.215121
300.0741350.51360.304936
31-0.097602-0.67620.748922
320.0287690.19930.421427
330.0500370.34670.36518
34-0.018644-0.12920.551118
35-0.158957-1.10130.861868
36-0.041598-0.28820.612783
370.0488830.33870.368167
380.0489060.33880.368107
390.0383940.2660.395688
400.0508850.35250.362987
41-0.070803-0.49050.687006
42-0.043126-0.29880.616805
43-0.059503-0.41220.659003
44-0.033228-0.23020.590546
45-0.051117-0.35420.637612
460.0362710.25130.401329
47NANANA

\begin{tabular}{lllllllll}
\hline
Partial Autocorrelation Function \tabularnewline
Time lag k & PACF(k) & T-STAT & P-value \tabularnewline
0 & 0.093819 & 0.65 & 0.259397 \tabularnewline
1 & 0.166679 & 1.1548 & 0.126947 \tabularnewline
2 & 0.285381 & 1.9772 & 0.02689 \tabularnewline
3 & -0.089088 & -0.6172 & 0.729996 \tabularnewline
4 & -0.011177 & -0.0774 & 0.530701 \tabularnewline
5 & 0.003368 & 0.0233 & 0.49074 \tabularnewline
6 & -0.255563 & -1.7706 & 0.95851 \tabularnewline
7 & 0.003217 & 0.0223 & 0.491155 \tabularnewline
8 & -0.073265 & -0.5076 & 0.692969 \tabularnewline
9 & -0.023811 & -0.165 & 0.565168 \tabularnewline
10 & -0.034816 & -0.2412 & 0.59479 \tabularnewline
11 & -0.218808 & -1.5159 & 0.931954 \tabularnewline
12 & -0.140783 & -0.9754 & 0.832868 \tabularnewline
13 & -0.076484 & -0.5299 & 0.700688 \tabularnewline
14 & 0.084591 & 0.5861 & 0.280289 \tabularnewline
15 & -0.027794 & -0.1926 & 0.575943 \tabularnewline
16 & 0.108177 & 0.7495 & 0.228615 \tabularnewline
17 & 0.00912 & 0.0632 & 0.474941 \tabularnewline
18 & -0.087202 & -0.6042 & 0.725706 \tabularnewline
19 & -0.026024 & -0.1803 & 0.571162 \tabularnewline
20 & 0.101907 & 0.706 & 0.241791 \tabularnewline
21 & -0.042217 & -0.2925 & 0.614413 \tabularnewline
22 & 0.083762 & 0.5803 & 0.282208 \tabularnewline
23 & -0.12931 & -0.8959 & 0.812608 \tabularnewline
24 & -0.055327 & -0.3833 & 0.648411 \tabularnewline
25 & 0.068707 & 0.476 & 0.318111 \tabularnewline
26 & 0.000499 & 0.0035 & 0.498629 \tabularnewline
27 & -0.054889 & -0.3803 & 0.647294 \tabularnewline
28 & 0.029463 & 0.2041 & 0.419559 \tabularnewline
29 & 0.11482 & 0.7955 & 0.215121 \tabularnewline
30 & 0.074135 & 0.5136 & 0.304936 \tabularnewline
31 & -0.097602 & -0.6762 & 0.748922 \tabularnewline
32 & 0.028769 & 0.1993 & 0.421427 \tabularnewline
33 & 0.050037 & 0.3467 & 0.36518 \tabularnewline
34 & -0.018644 & -0.1292 & 0.551118 \tabularnewline
35 & -0.158957 & -1.1013 & 0.861868 \tabularnewline
36 & -0.041598 & -0.2882 & 0.612783 \tabularnewline
37 & 0.048883 & 0.3387 & 0.368167 \tabularnewline
38 & 0.048906 & 0.3388 & 0.368107 \tabularnewline
39 & 0.038394 & 0.266 & 0.395688 \tabularnewline
40 & 0.050885 & 0.3525 & 0.362987 \tabularnewline
41 & -0.070803 & -0.4905 & 0.687006 \tabularnewline
42 & -0.043126 & -0.2988 & 0.616805 \tabularnewline
43 & -0.059503 & -0.4122 & 0.659003 \tabularnewline
44 & -0.033228 & -0.2302 & 0.590546 \tabularnewline
45 & -0.051117 & -0.3542 & 0.637612 \tabularnewline
46 & 0.036271 & 0.2513 & 0.401329 \tabularnewline
47 & NA & NA & NA \tabularnewline
\hline
\end{tabular}
%Source: https://freestatistics.org/blog/index.php?pk=7713&T=2

[TABLE]
[ROW][C]Partial Autocorrelation Function[/C][/ROW]
[ROW][C]Time lag k[/C][C]PACF(k)[/C][C]T-STAT[/C][C]P-value[/C][/ROW]
[ROW][C]0[/C][C]0.093819[/C][C]0.65[/C][C]0.259397[/C][/ROW]
[ROW][C]1[/C][C]0.166679[/C][C]1.1548[/C][C]0.126947[/C][/ROW]
[ROW][C]2[/C][C]0.285381[/C][C]1.9772[/C][C]0.02689[/C][/ROW]
[ROW][C]3[/C][C]-0.089088[/C][C]-0.6172[/C][C]0.729996[/C][/ROW]
[ROW][C]4[/C][C]-0.011177[/C][C]-0.0774[/C][C]0.530701[/C][/ROW]
[ROW][C]5[/C][C]0.003368[/C][C]0.0233[/C][C]0.49074[/C][/ROW]
[ROW][C]6[/C][C]-0.255563[/C][C]-1.7706[/C][C]0.95851[/C][/ROW]
[ROW][C]7[/C][C]0.003217[/C][C]0.0223[/C][C]0.491155[/C][/ROW]
[ROW][C]8[/C][C]-0.073265[/C][C]-0.5076[/C][C]0.692969[/C][/ROW]
[ROW][C]9[/C][C]-0.023811[/C][C]-0.165[/C][C]0.565168[/C][/ROW]
[ROW][C]10[/C][C]-0.034816[/C][C]-0.2412[/C][C]0.59479[/C][/ROW]
[ROW][C]11[/C][C]-0.218808[/C][C]-1.5159[/C][C]0.931954[/C][/ROW]
[ROW][C]12[/C][C]-0.140783[/C][C]-0.9754[/C][C]0.832868[/C][/ROW]
[ROW][C]13[/C][C]-0.076484[/C][C]-0.5299[/C][C]0.700688[/C][/ROW]
[ROW][C]14[/C][C]0.084591[/C][C]0.5861[/C][C]0.280289[/C][/ROW]
[ROW][C]15[/C][C]-0.027794[/C][C]-0.1926[/C][C]0.575943[/C][/ROW]
[ROW][C]16[/C][C]0.108177[/C][C]0.7495[/C][C]0.228615[/C][/ROW]
[ROW][C]17[/C][C]0.00912[/C][C]0.0632[/C][C]0.474941[/C][/ROW]
[ROW][C]18[/C][C]-0.087202[/C][C]-0.6042[/C][C]0.725706[/C][/ROW]
[ROW][C]19[/C][C]-0.026024[/C][C]-0.1803[/C][C]0.571162[/C][/ROW]
[ROW][C]20[/C][C]0.101907[/C][C]0.706[/C][C]0.241791[/C][/ROW]
[ROW][C]21[/C][C]-0.042217[/C][C]-0.2925[/C][C]0.614413[/C][/ROW]
[ROW][C]22[/C][C]0.083762[/C][C]0.5803[/C][C]0.282208[/C][/ROW]
[ROW][C]23[/C][C]-0.12931[/C][C]-0.8959[/C][C]0.812608[/C][/ROW]
[ROW][C]24[/C][C]-0.055327[/C][C]-0.3833[/C][C]0.648411[/C][/ROW]
[ROW][C]25[/C][C]0.068707[/C][C]0.476[/C][C]0.318111[/C][/ROW]
[ROW][C]26[/C][C]0.000499[/C][C]0.0035[/C][C]0.498629[/C][/ROW]
[ROW][C]27[/C][C]-0.054889[/C][C]-0.3803[/C][C]0.647294[/C][/ROW]
[ROW][C]28[/C][C]0.029463[/C][C]0.2041[/C][C]0.419559[/C][/ROW]
[ROW][C]29[/C][C]0.11482[/C][C]0.7955[/C][C]0.215121[/C][/ROW]
[ROW][C]30[/C][C]0.074135[/C][C]0.5136[/C][C]0.304936[/C][/ROW]
[ROW][C]31[/C][C]-0.097602[/C][C]-0.6762[/C][C]0.748922[/C][/ROW]
[ROW][C]32[/C][C]0.028769[/C][C]0.1993[/C][C]0.421427[/C][/ROW]
[ROW][C]33[/C][C]0.050037[/C][C]0.3467[/C][C]0.36518[/C][/ROW]
[ROW][C]34[/C][C]-0.018644[/C][C]-0.1292[/C][C]0.551118[/C][/ROW]
[ROW][C]35[/C][C]-0.158957[/C][C]-1.1013[/C][C]0.861868[/C][/ROW]
[ROW][C]36[/C][C]-0.041598[/C][C]-0.2882[/C][C]0.612783[/C][/ROW]
[ROW][C]37[/C][C]0.048883[/C][C]0.3387[/C][C]0.368167[/C][/ROW]
[ROW][C]38[/C][C]0.048906[/C][C]0.3388[/C][C]0.368107[/C][/ROW]
[ROW][C]39[/C][C]0.038394[/C][C]0.266[/C][C]0.395688[/C][/ROW]
[ROW][C]40[/C][C]0.050885[/C][C]0.3525[/C][C]0.362987[/C][/ROW]
[ROW][C]41[/C][C]-0.070803[/C][C]-0.4905[/C][C]0.687006[/C][/ROW]
[ROW][C]42[/C][C]-0.043126[/C][C]-0.2988[/C][C]0.616805[/C][/ROW]
[ROW][C]43[/C][C]-0.059503[/C][C]-0.4122[/C][C]0.659003[/C][/ROW]
[ROW][C]44[/C][C]-0.033228[/C][C]-0.2302[/C][C]0.590546[/C][/ROW]
[ROW][C]45[/C][C]-0.051117[/C][C]-0.3542[/C][C]0.637612[/C][/ROW]
[ROW][C]46[/C][C]0.036271[/C][C]0.2513[/C][C]0.401329[/C][/ROW]
[ROW][C]47[/C][C]NA[/C][C]NA[/C][C]NA[/C][/ROW]
[/TABLE]
Source: https://freestatistics.org/blog/index.php?pk=7713&T=2

Globally Unique Identifier (entire table): ba.freestatistics.org/blog/index.php?pk=7713&T=2

As an alternative you can also use a QR Code:  

The GUIDs for individual cells are displayed in the table below:

Partial Autocorrelation Function
Time lag kPACF(k)T-STATP-value
00.0938190.650.259397
10.1666791.15480.126947
20.2853811.97720.02689
3-0.089088-0.61720.729996
4-0.011177-0.07740.530701
50.0033680.02330.49074
6-0.255563-1.77060.95851
70.0032170.02230.491155
8-0.073265-0.50760.692969
9-0.023811-0.1650.565168
10-0.034816-0.24120.59479
11-0.218808-1.51590.931954
12-0.140783-0.97540.832868
13-0.076484-0.52990.700688
140.0845910.58610.280289
15-0.027794-0.19260.575943
160.1081770.74950.228615
170.009120.06320.474941
18-0.087202-0.60420.725706
19-0.026024-0.18030.571162
200.1019070.7060.241791
21-0.042217-0.29250.614413
220.0837620.58030.282208
23-0.12931-0.89590.812608
24-0.055327-0.38330.648411
250.0687070.4760.318111
260.0004990.00350.498629
27-0.054889-0.38030.647294
280.0294630.20410.419559
290.114820.79550.215121
300.0741350.51360.304936
31-0.097602-0.67620.748922
320.0287690.19930.421427
330.0500370.34670.36518
34-0.018644-0.12920.551118
35-0.158957-1.10130.861868
36-0.041598-0.28820.612783
370.0488830.33870.368167
380.0489060.33880.368107
390.0383940.2660.395688
400.0508850.35250.362987
41-0.070803-0.49050.687006
42-0.043126-0.29880.616805
43-0.059503-0.41220.659003
44-0.033228-0.23020.590546
45-0.051117-0.35420.637612
460.0362710.25130.401329
47NANANA


Parameters (Session):
par1 = 48 ; par2 = 1 ; par3 = 0 ; par4 = 1 ; par5 = 12 ;
Parameters (R input):
par1 = 48 ; par2 = 1 ; par3 = 0 ; par4 = 1 ; par5 = 12 ;
R code (references can be found in the software module):
if (par1 == 'Default') {
par1 = 10*log10(length(x))
} else {
par1 <- as.numeric(par1)
}
par2 <- as.numeric(par2)
par3 <- as.numeric(par3)
par4 <- as.numeric(par4)
par5 <- as.numeric(par5)
if (par2 == 0) {
x <- log(x)
} else {
x <- (x ^ par2 - 1) / par2
}
if (par3 > 0) x <- diff(x,lag=1,difference=par3)
if (par4 > 0) x <- diff(x,lag=par5,difference=par4)
bitmap(file='pic1.png')
racf <- acf(x,par1,main='Autocorrelation',xlab='lags',ylab='ACF')
dev.off()
bitmap(file='pic2.png')
rpacf <- pacf(x,par1,main='Partial Autocorrelation',xlab='lags',ylab='PACF')
dev.off()
(myacf <- c(racf$acf))
(mypacf <- c(rpacf$acf))
lengthx <- length(x)
sqrtn <- sqrt(lengthx)
load(file='createtable')
a<-table.start()
a<-table.row.start(a)
a<-table.element(a,'Autocorrelation Function',4,TRUE)
a<-table.row.end(a)
a<-table.row.start(a)
a<-table.element(a,'Time lag k',header=TRUE)
a<-table.element(a,hyperlink('basics.htm','ACF(k)','click here for more information about the Autocorrelation Function'),header=TRUE)
a<-table.element(a,'T-STAT',header=TRUE)
a<-table.element(a,'P-value',header=TRUE)
a<-table.row.end(a)
for (i in 1:par1) {
a<-table.row.start(a)
a<-table.element(a,i-1,header=TRUE)
a<-table.element(a,round(myacf[i],6))
mytstat <- myacf[i]*sqrtn
a<-table.element(a,round(mytstat,4))
a<-table.element(a,round(1-pt(mytstat,lengthx),6))
a<-table.row.end(a)
}
a<-table.end(a)
table.save(a,file='mytable.tab')
a<-table.start()
a<-table.row.start(a)
a<-table.element(a,'Partial Autocorrelation Function',4,TRUE)
a<-table.row.end(a)
a<-table.row.start(a)
a<-table.element(a,'Time lag k',header=TRUE)
a<-table.element(a,hyperlink('basics.htm','PACF(k)','click here for more information about the Partial Autocorrelation Function'),header=TRUE)
a<-table.element(a,'T-STAT',header=TRUE)
a<-table.element(a,'P-value',header=TRUE)
a<-table.row.end(a)
for (i in 1:par1) {
a<-table.row.start(a)
a<-table.element(a,i-1,header=TRUE)
a<-table.element(a,round(mypacf[i],6))
mytstat <- mypacf[i]*sqrtn
a<-table.element(a,round(mytstat,4))
a<-table.element(a,round(1-pt(mytstat,lengthx),6))
a<-table.row.end(a)
}
a<-table.end(a)
table.save(a,file='mytable1.tab')