Free Statistics

of Irreproducible Research!

Author's title

Author*Unverified author*
R Software Modulerwasp_autocorrelation.wasp
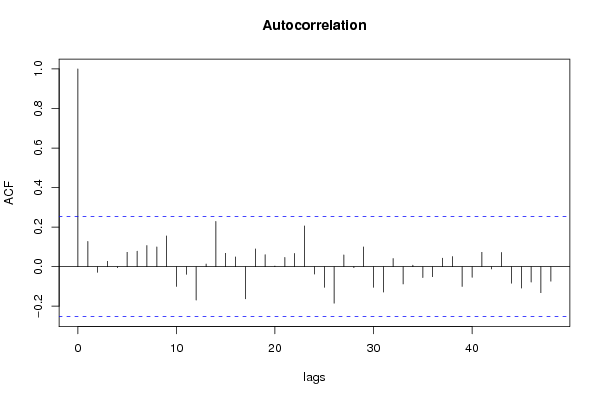
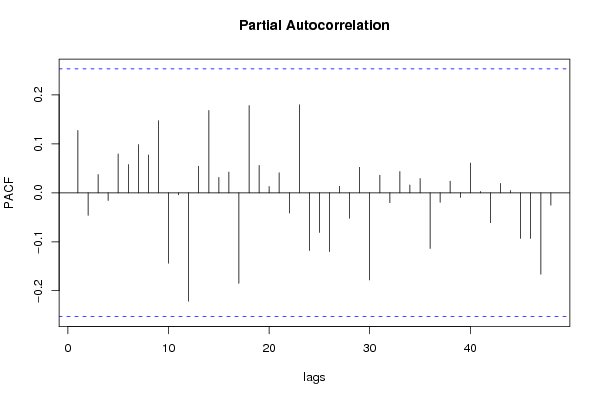
Title produced by software(Partial) Autocorrelation Function
Date of computationFri, 30 Nov 2007 07:34:20 -0700
Cite this page as followsStatistical Computations at FreeStatistics.org, Office for Research Development and Education, URL https://freestatistics.org/blog/index.php?v=date/2007/Nov/30/t11964326454fq1rqwon560e9x.htm/, Retrieved Sun, 28 Apr 2024 09:31:19 +0000
Statistical Computations at FreeStatistics.org, Office for Research Development and Education, URL https://freestatistics.org/blog/index.php?pk=7706, Retrieved Sun, 28 Apr 2024 09:31:19 +0000
QR Codes:

Original text written by user:
IsPrivate?No (this computation is public)
User-defined keywordsworkshop 11, Rik, Tim, Giel, ARIMA
Estimated Impact186
Family? (F = Feedback message, R = changed R code, M = changed R Module, P = changed Parameters, D = changed Data)
-       [(Partial) Autocorrelation Function] [WS11_Q1_Webstek] [2007-11-30 14:34:20] [0ea70c1b491052c6d2a865ea09f80161] [Current]
Feedback Forum

Post a new message
Dataseries X:
513
503
471
471
476
475
470
461
455
456
517
525
523
519
509
512
519
517
510
509
501
507
569
580
578
565
547
555
562
561
555
544
537
543
594
611
613
611
594
595
591
589
584
573
567
569
621
629
628
612
595
597
593
590
580
574
573
573
620
626
620
588
566
557
561
549
532
526
511
499
555
565
542


Summary of compuational transaction
Raw Inputview raw input (R code)
Raw Outputview raw output of R engine
Computing time2 seconds
R Server'Gwilym Jenkins' @ 72.249.127.135

\begin{tabular}{lllllllll}
\hline
Summary of compuational transaction \tabularnewline
Raw Input & view raw input (R code)  \tabularnewline
Raw Output & view raw output of R engine  \tabularnewline
Computing time & 2 seconds \tabularnewline
R Server & 'Gwilym Jenkins' @ 72.249.127.135 \tabularnewline
\hline
\end{tabular}
%Source: https://freestatistics.org/blog/index.php?pk=7706&T=0

[TABLE]
[ROW][C]Summary of compuational transaction[/C][/ROW]
[ROW][C]Raw Input[/C][C]view raw input (R code) [/C][/ROW]
[ROW][C]Raw Output[/C][C]view raw output of R engine [/C][/ROW]
[ROW][C]Computing time[/C][C]2 seconds[/C][/ROW]
[ROW][C]R Server[/C][C]'Gwilym Jenkins' @ 72.249.127.135[/C][/ROW]
[/TABLE]
Source: https://freestatistics.org/blog/index.php?pk=7706&T=0

Globally Unique Identifier (entire table): ba.freestatistics.org/blog/index.php?pk=7706&T=0

As an alternative you can also use a QR Code:  

The GUIDs for individual cells are displayed in the table below:

Summary of compuational transaction
Raw Inputview raw input (R code)
Raw Outputview raw output of R engine
Computing time2 seconds
R Server'Gwilym Jenkins' @ 72.249.127.135


Autocorrelation Function
Time lag kACF(k)T-STATP-value
017.7460
10.1274230.9870.163801
2-0.028998-0.22460.58848
30.0268440.20790.417992
4-0.005511-0.04270.516954
50.0724360.56110.288414
60.0783380.60680.273136
70.1066760.82630.205951
80.0997010.77230.221491
90.1550561.20110.117224
10-0.100006-0.77460.779203
11-0.038676-0.29960.617235
12-0.169341-1.31170.902693
130.0133320.10330.459046
140.2285761.77050.040858
150.0672210.52070.302248
160.0488940.37870.353111
17-0.162511-1.25880.893512
180.0897510.69520.244805
190.0604930.46860.320534
200.0026920.02090.491716
210.0467850.36240.359165
220.066870.5180.30319
230.2059541.59530.057949
24-0.037824-0.2930.614726
25-0.104498-0.80940.789268
26-0.184957-1.43270.921429
270.0592070.45860.324084
28-0.005564-0.04310.517117
290.0995990.77150.221723
30-0.104394-0.80860.78904
31-0.128496-0.99530.838213
320.0410560.3180.375789
33-0.087441-0.67730.749595
340.0073670.05710.477342
35-0.05517-0.42730.66467
36-0.050816-0.39360.652373
370.0429510.33270.370261
380.0512650.39710.346353
39-0.099911-0.77390.778989
40-0.053827-0.41690.660896
410.0722460.55960.288914
42-0.011776-0.09120.536187
430.071880.55680.289875
44-0.083766-0.64890.740545
45-0.108399-0.83970.797783
46-0.077914-0.60350.725782
47-0.131512-1.01870.843778

\begin{tabular}{lllllllll}
\hline
Autocorrelation Function \tabularnewline
Time lag k & ACF(k) & T-STAT & P-value \tabularnewline
0 & 1 & 7.746 & 0 \tabularnewline
1 & 0.127423 & 0.987 & 0.163801 \tabularnewline
2 & -0.028998 & -0.2246 & 0.58848 \tabularnewline
3 & 0.026844 & 0.2079 & 0.417992 \tabularnewline
4 & -0.005511 & -0.0427 & 0.516954 \tabularnewline
5 & 0.072436 & 0.5611 & 0.288414 \tabularnewline
6 & 0.078338 & 0.6068 & 0.273136 \tabularnewline
7 & 0.106676 & 0.8263 & 0.205951 \tabularnewline
8 & 0.099701 & 0.7723 & 0.221491 \tabularnewline
9 & 0.155056 & 1.2011 & 0.117224 \tabularnewline
10 & -0.100006 & -0.7746 & 0.779203 \tabularnewline
11 & -0.038676 & -0.2996 & 0.617235 \tabularnewline
12 & -0.169341 & -1.3117 & 0.902693 \tabularnewline
13 & 0.013332 & 0.1033 & 0.459046 \tabularnewline
14 & 0.228576 & 1.7705 & 0.040858 \tabularnewline
15 & 0.067221 & 0.5207 & 0.302248 \tabularnewline
16 & 0.048894 & 0.3787 & 0.353111 \tabularnewline
17 & -0.162511 & -1.2588 & 0.893512 \tabularnewline
18 & 0.089751 & 0.6952 & 0.244805 \tabularnewline
19 & 0.060493 & 0.4686 & 0.320534 \tabularnewline
20 & 0.002692 & 0.0209 & 0.491716 \tabularnewline
21 & 0.046785 & 0.3624 & 0.359165 \tabularnewline
22 & 0.06687 & 0.518 & 0.30319 \tabularnewline
23 & 0.205954 & 1.5953 & 0.057949 \tabularnewline
24 & -0.037824 & -0.293 & 0.614726 \tabularnewline
25 & -0.104498 & -0.8094 & 0.789268 \tabularnewline
26 & -0.184957 & -1.4327 & 0.921429 \tabularnewline
27 & 0.059207 & 0.4586 & 0.324084 \tabularnewline
28 & -0.005564 & -0.0431 & 0.517117 \tabularnewline
29 & 0.099599 & 0.7715 & 0.221723 \tabularnewline
30 & -0.104394 & -0.8086 & 0.78904 \tabularnewline
31 & -0.128496 & -0.9953 & 0.838213 \tabularnewline
32 & 0.041056 & 0.318 & 0.375789 \tabularnewline
33 & -0.087441 & -0.6773 & 0.749595 \tabularnewline
34 & 0.007367 & 0.0571 & 0.477342 \tabularnewline
35 & -0.05517 & -0.4273 & 0.66467 \tabularnewline
36 & -0.050816 & -0.3936 & 0.652373 \tabularnewline
37 & 0.042951 & 0.3327 & 0.370261 \tabularnewline
38 & 0.051265 & 0.3971 & 0.346353 \tabularnewline
39 & -0.099911 & -0.7739 & 0.778989 \tabularnewline
40 & -0.053827 & -0.4169 & 0.660896 \tabularnewline
41 & 0.072246 & 0.5596 & 0.288914 \tabularnewline
42 & -0.011776 & -0.0912 & 0.536187 \tabularnewline
43 & 0.07188 & 0.5568 & 0.289875 \tabularnewline
44 & -0.083766 & -0.6489 & 0.740545 \tabularnewline
45 & -0.108399 & -0.8397 & 0.797783 \tabularnewline
46 & -0.077914 & -0.6035 & 0.725782 \tabularnewline
47 & -0.131512 & -1.0187 & 0.843778 \tabularnewline
\hline
\end{tabular}
%Source: https://freestatistics.org/blog/index.php?pk=7706&T=1

[TABLE]
[ROW][C]Autocorrelation Function[/C][/ROW]
[ROW][C]Time lag k[/C][C]ACF(k)[/C][C]T-STAT[/C][C]P-value[/C][/ROW]
[ROW][C]0[/C][C]1[/C][C]7.746[/C][C]0[/C][/ROW]
[ROW][C]1[/C][C]0.127423[/C][C]0.987[/C][C]0.163801[/C][/ROW]
[ROW][C]2[/C][C]-0.028998[/C][C]-0.2246[/C][C]0.58848[/C][/ROW]
[ROW][C]3[/C][C]0.026844[/C][C]0.2079[/C][C]0.417992[/C][/ROW]
[ROW][C]4[/C][C]-0.005511[/C][C]-0.0427[/C][C]0.516954[/C][/ROW]
[ROW][C]5[/C][C]0.072436[/C][C]0.5611[/C][C]0.288414[/C][/ROW]
[ROW][C]6[/C][C]0.078338[/C][C]0.6068[/C][C]0.273136[/C][/ROW]
[ROW][C]7[/C][C]0.106676[/C][C]0.8263[/C][C]0.205951[/C][/ROW]
[ROW][C]8[/C][C]0.099701[/C][C]0.7723[/C][C]0.221491[/C][/ROW]
[ROW][C]9[/C][C]0.155056[/C][C]1.2011[/C][C]0.117224[/C][/ROW]
[ROW][C]10[/C][C]-0.100006[/C][C]-0.7746[/C][C]0.779203[/C][/ROW]
[ROW][C]11[/C][C]-0.038676[/C][C]-0.2996[/C][C]0.617235[/C][/ROW]
[ROW][C]12[/C][C]-0.169341[/C][C]-1.3117[/C][C]0.902693[/C][/ROW]
[ROW][C]13[/C][C]0.013332[/C][C]0.1033[/C][C]0.459046[/C][/ROW]
[ROW][C]14[/C][C]0.228576[/C][C]1.7705[/C][C]0.040858[/C][/ROW]
[ROW][C]15[/C][C]0.067221[/C][C]0.5207[/C][C]0.302248[/C][/ROW]
[ROW][C]16[/C][C]0.048894[/C][C]0.3787[/C][C]0.353111[/C][/ROW]
[ROW][C]17[/C][C]-0.162511[/C][C]-1.2588[/C][C]0.893512[/C][/ROW]
[ROW][C]18[/C][C]0.089751[/C][C]0.6952[/C][C]0.244805[/C][/ROW]
[ROW][C]19[/C][C]0.060493[/C][C]0.4686[/C][C]0.320534[/C][/ROW]
[ROW][C]20[/C][C]0.002692[/C][C]0.0209[/C][C]0.491716[/C][/ROW]
[ROW][C]21[/C][C]0.046785[/C][C]0.3624[/C][C]0.359165[/C][/ROW]
[ROW][C]22[/C][C]0.06687[/C][C]0.518[/C][C]0.30319[/C][/ROW]
[ROW][C]23[/C][C]0.205954[/C][C]1.5953[/C][C]0.057949[/C][/ROW]
[ROW][C]24[/C][C]-0.037824[/C][C]-0.293[/C][C]0.614726[/C][/ROW]
[ROW][C]25[/C][C]-0.104498[/C][C]-0.8094[/C][C]0.789268[/C][/ROW]
[ROW][C]26[/C][C]-0.184957[/C][C]-1.4327[/C][C]0.921429[/C][/ROW]
[ROW][C]27[/C][C]0.059207[/C][C]0.4586[/C][C]0.324084[/C][/ROW]
[ROW][C]28[/C][C]-0.005564[/C][C]-0.0431[/C][C]0.517117[/C][/ROW]
[ROW][C]29[/C][C]0.099599[/C][C]0.7715[/C][C]0.221723[/C][/ROW]
[ROW][C]30[/C][C]-0.104394[/C][C]-0.8086[/C][C]0.78904[/C][/ROW]
[ROW][C]31[/C][C]-0.128496[/C][C]-0.9953[/C][C]0.838213[/C][/ROW]
[ROW][C]32[/C][C]0.041056[/C][C]0.318[/C][C]0.375789[/C][/ROW]
[ROW][C]33[/C][C]-0.087441[/C][C]-0.6773[/C][C]0.749595[/C][/ROW]
[ROW][C]34[/C][C]0.007367[/C][C]0.0571[/C][C]0.477342[/C][/ROW]
[ROW][C]35[/C][C]-0.05517[/C][C]-0.4273[/C][C]0.66467[/C][/ROW]
[ROW][C]36[/C][C]-0.050816[/C][C]-0.3936[/C][C]0.652373[/C][/ROW]
[ROW][C]37[/C][C]0.042951[/C][C]0.3327[/C][C]0.370261[/C][/ROW]
[ROW][C]38[/C][C]0.051265[/C][C]0.3971[/C][C]0.346353[/C][/ROW]
[ROW][C]39[/C][C]-0.099911[/C][C]-0.7739[/C][C]0.778989[/C][/ROW]
[ROW][C]40[/C][C]-0.053827[/C][C]-0.4169[/C][C]0.660896[/C][/ROW]
[ROW][C]41[/C][C]0.072246[/C][C]0.5596[/C][C]0.288914[/C][/ROW]
[ROW][C]42[/C][C]-0.011776[/C][C]-0.0912[/C][C]0.536187[/C][/ROW]
[ROW][C]43[/C][C]0.07188[/C][C]0.5568[/C][C]0.289875[/C][/ROW]
[ROW][C]44[/C][C]-0.083766[/C][C]-0.6489[/C][C]0.740545[/C][/ROW]
[ROW][C]45[/C][C]-0.108399[/C][C]-0.8397[/C][C]0.797783[/C][/ROW]
[ROW][C]46[/C][C]-0.077914[/C][C]-0.6035[/C][C]0.725782[/C][/ROW]
[ROW][C]47[/C][C]-0.131512[/C][C]-1.0187[/C][C]0.843778[/C][/ROW]
[/TABLE]
Source: https://freestatistics.org/blog/index.php?pk=7706&T=1

Globally Unique Identifier (entire table): ba.freestatistics.org/blog/index.php?pk=7706&T=1

As an alternative you can also use a QR Code:  

The GUIDs for individual cells are displayed in the table below:

Autocorrelation Function
Time lag kACF(k)T-STATP-value
017.7460
10.1274230.9870.163801
2-0.028998-0.22460.58848
30.0268440.20790.417992
4-0.005511-0.04270.516954
50.0724360.56110.288414
60.0783380.60680.273136
70.1066760.82630.205951
80.0997010.77230.221491
90.1550561.20110.117224
10-0.100006-0.77460.779203
11-0.038676-0.29960.617235
12-0.169341-1.31170.902693
130.0133320.10330.459046
140.2285761.77050.040858
150.0672210.52070.302248
160.0488940.37870.353111
17-0.162511-1.25880.893512
180.0897510.69520.244805
190.0604930.46860.320534
200.0026920.02090.491716
210.0467850.36240.359165
220.066870.5180.30319
230.2059541.59530.057949
24-0.037824-0.2930.614726
25-0.104498-0.80940.789268
26-0.184957-1.43270.921429
270.0592070.45860.324084
28-0.005564-0.04310.517117
290.0995990.77150.221723
30-0.104394-0.80860.78904
31-0.128496-0.99530.838213
320.0410560.3180.375789
33-0.087441-0.67730.749595
340.0073670.05710.477342
35-0.05517-0.42730.66467
36-0.050816-0.39360.652373
370.0429510.33270.370261
380.0512650.39710.346353
39-0.099911-0.77390.778989
40-0.053827-0.41690.660896
410.0722460.55960.288914
42-0.011776-0.09120.536187
430.071880.55680.289875
44-0.083766-0.64890.740545
45-0.108399-0.83970.797783
46-0.077914-0.60350.725782
47-0.131512-1.01870.843778


Partial Autocorrelation Function
Time lag kPACF(k)T-STATP-value
00.1274230.9870.163801
1-0.045981-0.35620.638518
20.037250.28850.386964
3-0.015667-0.12140.548093
40.0792890.61420.270712
50.0575910.44610.328567
60.0986540.76420.22388
70.0773040.59880.275782
80.147271.14070.129254
9-0.143793-1.11380.865101
10-0.004198-0.03250.512916
11-0.221445-1.71530.954275
120.054310.42070.337746
130.1682421.30320.098743
140.0314680.24370.404129
150.0424190.32860.371811
16-0.18484-1.43180.9213
170.1782631.38080.086228
180.055940.43330.333173
190.0128330.09940.460574
200.0407750.31580.376608
21-0.041449-0.32110.625362
220.1798331.3930.084383
23-0.118099-0.91480.818018
24-0.080923-0.62680.733425
25-0.120028-0.92970.821882
260.0132390.10250.459331
27-0.052004-0.40280.655743
280.0521610.4040.343811
29-0.178139-1.37990.913625
300.0358470.27770.391109
31-0.020266-0.1570.562106
320.043490.33690.368696
330.0160490.12430.450741
340.02920.22620.410914
35-0.113709-0.88080.809026
36-0.019505-0.15110.559791
370.0238060.18440.427159
38-0.009538-0.07390.529324
390.0608730.47150.319491
400.0027190.02110.491633
41-0.061178-0.47390.681348
420.0191970.14870.441146
430.0046450.0360.485709
44-0.093256-0.72240.76356
45-0.093115-0.72130.763226
46-0.166244-1.28770.898605
47-0.025302-0.1960.577359

\begin{tabular}{lllllllll}
\hline
Partial Autocorrelation Function \tabularnewline
Time lag k & PACF(k) & T-STAT & P-value \tabularnewline
0 & 0.127423 & 0.987 & 0.163801 \tabularnewline
1 & -0.045981 & -0.3562 & 0.638518 \tabularnewline
2 & 0.03725 & 0.2885 & 0.386964 \tabularnewline
3 & -0.015667 & -0.1214 & 0.548093 \tabularnewline
4 & 0.079289 & 0.6142 & 0.270712 \tabularnewline
5 & 0.057591 & 0.4461 & 0.328567 \tabularnewline
6 & 0.098654 & 0.7642 & 0.22388 \tabularnewline
7 & 0.077304 & 0.5988 & 0.275782 \tabularnewline
8 & 0.14727 & 1.1407 & 0.129254 \tabularnewline
9 & -0.143793 & -1.1138 & 0.865101 \tabularnewline
10 & -0.004198 & -0.0325 & 0.512916 \tabularnewline
11 & -0.221445 & -1.7153 & 0.954275 \tabularnewline
12 & 0.05431 & 0.4207 & 0.337746 \tabularnewline
13 & 0.168242 & 1.3032 & 0.098743 \tabularnewline
14 & 0.031468 & 0.2437 & 0.404129 \tabularnewline
15 & 0.042419 & 0.3286 & 0.371811 \tabularnewline
16 & -0.18484 & -1.4318 & 0.9213 \tabularnewline
17 & 0.178263 & 1.3808 & 0.086228 \tabularnewline
18 & 0.05594 & 0.4333 & 0.333173 \tabularnewline
19 & 0.012833 & 0.0994 & 0.460574 \tabularnewline
20 & 0.040775 & 0.3158 & 0.376608 \tabularnewline
21 & -0.041449 & -0.3211 & 0.625362 \tabularnewline
22 & 0.179833 & 1.393 & 0.084383 \tabularnewline
23 & -0.118099 & -0.9148 & 0.818018 \tabularnewline
24 & -0.080923 & -0.6268 & 0.733425 \tabularnewline
25 & -0.120028 & -0.9297 & 0.821882 \tabularnewline
26 & 0.013239 & 0.1025 & 0.459331 \tabularnewline
27 & -0.052004 & -0.4028 & 0.655743 \tabularnewline
28 & 0.052161 & 0.404 & 0.343811 \tabularnewline
29 & -0.178139 & -1.3799 & 0.913625 \tabularnewline
30 & 0.035847 & 0.2777 & 0.391109 \tabularnewline
31 & -0.020266 & -0.157 & 0.562106 \tabularnewline
32 & 0.04349 & 0.3369 & 0.368696 \tabularnewline
33 & 0.016049 & 0.1243 & 0.450741 \tabularnewline
34 & 0.0292 & 0.2262 & 0.410914 \tabularnewline
35 & -0.113709 & -0.8808 & 0.809026 \tabularnewline
36 & -0.019505 & -0.1511 & 0.559791 \tabularnewline
37 & 0.023806 & 0.1844 & 0.427159 \tabularnewline
38 & -0.009538 & -0.0739 & 0.529324 \tabularnewline
39 & 0.060873 & 0.4715 & 0.319491 \tabularnewline
40 & 0.002719 & 0.0211 & 0.491633 \tabularnewline
41 & -0.061178 & -0.4739 & 0.681348 \tabularnewline
42 & 0.019197 & 0.1487 & 0.441146 \tabularnewline
43 & 0.004645 & 0.036 & 0.485709 \tabularnewline
44 & -0.093256 & -0.7224 & 0.76356 \tabularnewline
45 & -0.093115 & -0.7213 & 0.763226 \tabularnewline
46 & -0.166244 & -1.2877 & 0.898605 \tabularnewline
47 & -0.025302 & -0.196 & 0.577359 \tabularnewline
\hline
\end{tabular}
%Source: https://freestatistics.org/blog/index.php?pk=7706&T=2

[TABLE]
[ROW][C]Partial Autocorrelation Function[/C][/ROW]
[ROW][C]Time lag k[/C][C]PACF(k)[/C][C]T-STAT[/C][C]P-value[/C][/ROW]
[ROW][C]0[/C][C]0.127423[/C][C]0.987[/C][C]0.163801[/C][/ROW]
[ROW][C]1[/C][C]-0.045981[/C][C]-0.3562[/C][C]0.638518[/C][/ROW]
[ROW][C]2[/C][C]0.03725[/C][C]0.2885[/C][C]0.386964[/C][/ROW]
[ROW][C]3[/C][C]-0.015667[/C][C]-0.1214[/C][C]0.548093[/C][/ROW]
[ROW][C]4[/C][C]0.079289[/C][C]0.6142[/C][C]0.270712[/C][/ROW]
[ROW][C]5[/C][C]0.057591[/C][C]0.4461[/C][C]0.328567[/C][/ROW]
[ROW][C]6[/C][C]0.098654[/C][C]0.7642[/C][C]0.22388[/C][/ROW]
[ROW][C]7[/C][C]0.077304[/C][C]0.5988[/C][C]0.275782[/C][/ROW]
[ROW][C]8[/C][C]0.14727[/C][C]1.1407[/C][C]0.129254[/C][/ROW]
[ROW][C]9[/C][C]-0.143793[/C][C]-1.1138[/C][C]0.865101[/C][/ROW]
[ROW][C]10[/C][C]-0.004198[/C][C]-0.0325[/C][C]0.512916[/C][/ROW]
[ROW][C]11[/C][C]-0.221445[/C][C]-1.7153[/C][C]0.954275[/C][/ROW]
[ROW][C]12[/C][C]0.05431[/C][C]0.4207[/C][C]0.337746[/C][/ROW]
[ROW][C]13[/C][C]0.168242[/C][C]1.3032[/C][C]0.098743[/C][/ROW]
[ROW][C]14[/C][C]0.031468[/C][C]0.2437[/C][C]0.404129[/C][/ROW]
[ROW][C]15[/C][C]0.042419[/C][C]0.3286[/C][C]0.371811[/C][/ROW]
[ROW][C]16[/C][C]-0.18484[/C][C]-1.4318[/C][C]0.9213[/C][/ROW]
[ROW][C]17[/C][C]0.178263[/C][C]1.3808[/C][C]0.086228[/C][/ROW]
[ROW][C]18[/C][C]0.05594[/C][C]0.4333[/C][C]0.333173[/C][/ROW]
[ROW][C]19[/C][C]0.012833[/C][C]0.0994[/C][C]0.460574[/C][/ROW]
[ROW][C]20[/C][C]0.040775[/C][C]0.3158[/C][C]0.376608[/C][/ROW]
[ROW][C]21[/C][C]-0.041449[/C][C]-0.3211[/C][C]0.625362[/C][/ROW]
[ROW][C]22[/C][C]0.179833[/C][C]1.393[/C][C]0.084383[/C][/ROW]
[ROW][C]23[/C][C]-0.118099[/C][C]-0.9148[/C][C]0.818018[/C][/ROW]
[ROW][C]24[/C][C]-0.080923[/C][C]-0.6268[/C][C]0.733425[/C][/ROW]
[ROW][C]25[/C][C]-0.120028[/C][C]-0.9297[/C][C]0.821882[/C][/ROW]
[ROW][C]26[/C][C]0.013239[/C][C]0.1025[/C][C]0.459331[/C][/ROW]
[ROW][C]27[/C][C]-0.052004[/C][C]-0.4028[/C][C]0.655743[/C][/ROW]
[ROW][C]28[/C][C]0.052161[/C][C]0.404[/C][C]0.343811[/C][/ROW]
[ROW][C]29[/C][C]-0.178139[/C][C]-1.3799[/C][C]0.913625[/C][/ROW]
[ROW][C]30[/C][C]0.035847[/C][C]0.2777[/C][C]0.391109[/C][/ROW]
[ROW][C]31[/C][C]-0.020266[/C][C]-0.157[/C][C]0.562106[/C][/ROW]
[ROW][C]32[/C][C]0.04349[/C][C]0.3369[/C][C]0.368696[/C][/ROW]
[ROW][C]33[/C][C]0.016049[/C][C]0.1243[/C][C]0.450741[/C][/ROW]
[ROW][C]34[/C][C]0.0292[/C][C]0.2262[/C][C]0.410914[/C][/ROW]
[ROW][C]35[/C][C]-0.113709[/C][C]-0.8808[/C][C]0.809026[/C][/ROW]
[ROW][C]36[/C][C]-0.019505[/C][C]-0.1511[/C][C]0.559791[/C][/ROW]
[ROW][C]37[/C][C]0.023806[/C][C]0.1844[/C][C]0.427159[/C][/ROW]
[ROW][C]38[/C][C]-0.009538[/C][C]-0.0739[/C][C]0.529324[/C][/ROW]
[ROW][C]39[/C][C]0.060873[/C][C]0.4715[/C][C]0.319491[/C][/ROW]
[ROW][C]40[/C][C]0.002719[/C][C]0.0211[/C][C]0.491633[/C][/ROW]
[ROW][C]41[/C][C]-0.061178[/C][C]-0.4739[/C][C]0.681348[/C][/ROW]
[ROW][C]42[/C][C]0.019197[/C][C]0.1487[/C][C]0.441146[/C][/ROW]
[ROW][C]43[/C][C]0.004645[/C][C]0.036[/C][C]0.485709[/C][/ROW]
[ROW][C]44[/C][C]-0.093256[/C][C]-0.7224[/C][C]0.76356[/C][/ROW]
[ROW][C]45[/C][C]-0.093115[/C][C]-0.7213[/C][C]0.763226[/C][/ROW]
[ROW][C]46[/C][C]-0.166244[/C][C]-1.2877[/C][C]0.898605[/C][/ROW]
[ROW][C]47[/C][C]-0.025302[/C][C]-0.196[/C][C]0.577359[/C][/ROW]
[/TABLE]
Source: https://freestatistics.org/blog/index.php?pk=7706&T=2

Globally Unique Identifier (entire table): ba.freestatistics.org/blog/index.php?pk=7706&T=2

As an alternative you can also use a QR Code:  

The GUIDs for individual cells are displayed in the table below:

Partial Autocorrelation Function
Time lag kPACF(k)T-STATP-value
00.1274230.9870.163801
1-0.045981-0.35620.638518
20.037250.28850.386964
3-0.015667-0.12140.548093
40.0792890.61420.270712
50.0575910.44610.328567
60.0986540.76420.22388
70.0773040.59880.275782
80.147271.14070.129254
9-0.143793-1.11380.865101
10-0.004198-0.03250.512916
11-0.221445-1.71530.954275
120.054310.42070.337746
130.1682421.30320.098743
140.0314680.24370.404129
150.0424190.32860.371811
16-0.18484-1.43180.9213
170.1782631.38080.086228
180.055940.43330.333173
190.0128330.09940.460574
200.0407750.31580.376608
21-0.041449-0.32110.625362
220.1798331.3930.084383
23-0.118099-0.91480.818018
24-0.080923-0.62680.733425
25-0.120028-0.92970.821882
260.0132390.10250.459331
27-0.052004-0.40280.655743
280.0521610.4040.343811
29-0.178139-1.37990.913625
300.0358470.27770.391109
31-0.020266-0.1570.562106
320.043490.33690.368696
330.0160490.12430.450741
340.02920.22620.410914
35-0.113709-0.88080.809026
36-0.019505-0.15110.559791
370.0238060.18440.427159
38-0.009538-0.07390.529324
390.0608730.47150.319491
400.0027190.02110.491633
41-0.061178-0.47390.681348
420.0191970.14870.441146
430.0046450.0360.485709
44-0.093256-0.72240.76356
45-0.093115-0.72130.763226
46-0.166244-1.28770.898605
47-0.025302-0.1960.577359


Parameters (Session):
par1 = 48 ; par2 = 1 ; par3 = 1 ; par4 = 1 ; par5 = 12 ;
Parameters (R input):
par1 = 48 ; par2 = 1 ; par3 = 1 ; par4 = 1 ; par5 = 12 ;
R code (references can be found in the software module):
if (par1 == 'Default') {
par1 = 10*log10(length(x))
} else {
par1 <- as.numeric(par1)
}
par2 <- as.numeric(par2)
par3 <- as.numeric(par3)
par4 <- as.numeric(par4)
par5 <- as.numeric(par5)
if (par2 == 0) {
x <- log(x)
} else {
x <- (x ^ par2 - 1) / par2
}
if (par3 > 0) x <- diff(x,lag=1,difference=par3)
if (par4 > 0) x <- diff(x,lag=par5,difference=par4)
bitmap(file='pic1.png')
racf <- acf(x,par1,main='Autocorrelation',xlab='lags',ylab='ACF')
dev.off()
bitmap(file='pic2.png')
rpacf <- pacf(x,par1,main='Partial Autocorrelation',xlab='lags',ylab='PACF')
dev.off()
(myacf <- c(racf$acf))
(mypacf <- c(rpacf$acf))
lengthx <- length(x)
sqrtn <- sqrt(lengthx)
load(file='createtable')
a<-table.start()
a<-table.row.start(a)
a<-table.element(a,'Autocorrelation Function',4,TRUE)
a<-table.row.end(a)
a<-table.row.start(a)
a<-table.element(a,'Time lag k',header=TRUE)
a<-table.element(a,hyperlink('basics.htm','ACF(k)','click here for more information about the Autocorrelation Function'),header=TRUE)
a<-table.element(a,'T-STAT',header=TRUE)
a<-table.element(a,'P-value',header=TRUE)
a<-table.row.end(a)
for (i in 1:par1) {
a<-table.row.start(a)
a<-table.element(a,i-1,header=TRUE)
a<-table.element(a,round(myacf[i],6))
mytstat <- myacf[i]*sqrtn
a<-table.element(a,round(mytstat,4))
a<-table.element(a,round(1-pt(mytstat,lengthx),6))
a<-table.row.end(a)
}
a<-table.end(a)
table.save(a,file='mytable.tab')
a<-table.start()
a<-table.row.start(a)
a<-table.element(a,'Partial Autocorrelation Function',4,TRUE)
a<-table.row.end(a)
a<-table.row.start(a)
a<-table.element(a,'Time lag k',header=TRUE)
a<-table.element(a,hyperlink('basics.htm','PACF(k)','click here for more information about the Partial Autocorrelation Function'),header=TRUE)
a<-table.element(a,'T-STAT',header=TRUE)
a<-table.element(a,'P-value',header=TRUE)
a<-table.row.end(a)
for (i in 1:par1) {
a<-table.row.start(a)
a<-table.element(a,i-1,header=TRUE)
a<-table.element(a,round(mypacf[i],6))
mytstat <- mypacf[i]*sqrtn
a<-table.element(a,round(mytstat,4))
a<-table.element(a,round(1-pt(mytstat,lengthx),6))
a<-table.row.end(a)
}
a<-table.end(a)
table.save(a,file='mytable1.tab')