Free Statistics

of Irreproducible Research!

Author's title

Author*Unverified author*
R Software Modulerwasp_autocorrelation.wasp
Title produced by software(Partial) Autocorrelation Function
Date of computationFri, 30 Nov 2007 07:23:39 -0700
Cite this page as followsStatistical Computations at FreeStatistics.org, Office for Research Development and Education, URL https://freestatistics.org/blog/index.php?v=date/2007/Nov/30/t11964320945yob6vrqmxihys5.htm/, Retrieved Sat, 27 Apr 2024 17:29:08 +0000
Statistical Computations at FreeStatistics.org, Office for Research Development and Education, URL https://freestatistics.org/blog/index.php?pk=7699, Retrieved Sat, 27 Apr 2024 17:29:08 +0000
QR Codes:

Original text written by user:
IsPrivate?No (this computation is public)
User-defined keywords
Estimated Impact194
Family? (F = Feedback message, R = changed R code, M = changed R Module, P = changed Parameters, D = changed Data)
-       [(Partial) Autocorrelation Function] [] [2007-11-30 14:23:39] [48e0b7671e607713e2c1c3706de6df4e] [Current]
Feedback Forum

Post a new message
Dataseries X:
112,6
113,8
107,8
103,2
103,3
101,2
107,7
110,4
101,9
115,9
89,9
88,6
117,2
123,9
100
103,6
94,1
98,7
119,5
112,7
104,4
124,7
89,1
97
121,6
118,8
114
111,5
97,2
102,5
113,4
109,8
104,9
126,1
80
96,8
117,2
112,3
117,3
111,1
102,2
104,3
122,9
107,6
121,3
131,5
89
104,4
128,9
135,9
133,3
121,3
120,5
120,4
137,9
126,1
133,2
146,6
103,4
117,2


Summary of compuational transaction
Raw Inputview raw input (R code)
Raw Outputview raw output of R engine
Computing time2 seconds
R Server'Gwilym Jenkins' @ 72.249.127.135

\begin{tabular}{lllllllll}
\hline
Summary of compuational transaction \tabularnewline
Raw Input & view raw input (R code)  \tabularnewline
Raw Output & view raw output of R engine  \tabularnewline
Computing time & 2 seconds \tabularnewline
R Server & 'Gwilym Jenkins' @ 72.249.127.135 \tabularnewline
\hline
\end{tabular}
%Source: https://freestatistics.org/blog/index.php?pk=7699&T=0

[TABLE]
[ROW][C]Summary of compuational transaction[/C][/ROW]
[ROW][C]Raw Input[/C][C]view raw input (R code) [/C][/ROW]
[ROW][C]Raw Output[/C][C]view raw output of R engine [/C][/ROW]
[ROW][C]Computing time[/C][C]2 seconds[/C][/ROW]
[ROW][C]R Server[/C][C]'Gwilym Jenkins' @ 72.249.127.135[/C][/ROW]
[/TABLE]
Source: https://freestatistics.org/blog/index.php?pk=7699&T=0

Globally Unique Identifier (entire table): ba.freestatistics.org/blog/index.php?pk=7699&T=0

As an alternative you can also use a QR Code:  

The GUIDs for individual cells are displayed in the table below:

Summary of compuational transaction
Raw Inputview raw input (R code)
Raw Outputview raw output of R engine
Computing time2 seconds
R Server'Gwilym Jenkins' @ 72.249.127.135


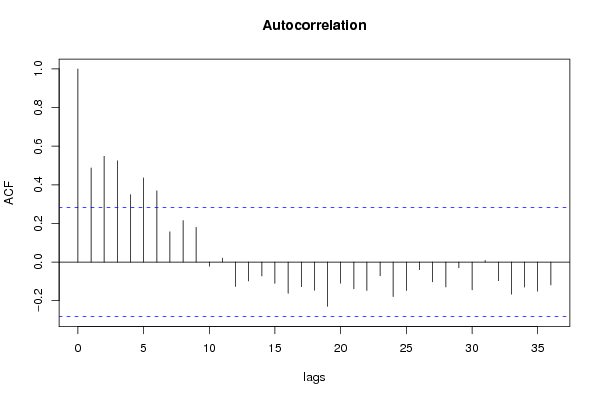
Autocorrelation Function
Time lag kACF(k)T-STATP-value
016.92820
10.4872253.37560.000733
20.5477093.79460.000207
30.5244943.63380.000339
40.3490632.41840.009716
50.4355123.01730.002036
60.368592.55370.006945
70.1568391.08660.141317
80.2147641.48790.071655
90.1794841.24350.109861
10-0.021464-0.14870.558796
110.0202720.14040.444446
12-0.126436-0.8760.807297
13-0.098118-0.67980.750047
14-0.071727-0.49690.68925
15-0.110536-0.76580.776233
16-0.162114-1.12320.866521
17-0.127752-0.88510.809741
18-0.145806-1.01020.841261
19-0.229369-1.58910.9407
20-0.109596-0.75930.774309
21-0.138979-0.96290.829782
22-0.147388-1.02110.843846
23-0.071469-0.49520.688624
24-0.178956-1.23980.889469
25-0.148056-1.02580.844927
26-0.039543-0.2740.607354
27-0.102772-0.7120.760052
28-0.128928-0.89320.811908
29-0.029664-0.20550.580982
30-0.143851-0.99660.838029
310.0080120.05550.477981
32-0.096827-0.67080.747229
33-0.166241-1.15170.872436
34-0.129894-0.89990.813676
35-0.150803-1.04480.849324

\begin{tabular}{lllllllll}
\hline
Autocorrelation Function \tabularnewline
Time lag k & ACF(k) & T-STAT & P-value \tabularnewline
0 & 1 & 6.9282 & 0 \tabularnewline
1 & 0.487225 & 3.3756 & 0.000733 \tabularnewline
2 & 0.547709 & 3.7946 & 0.000207 \tabularnewline
3 & 0.524494 & 3.6338 & 0.000339 \tabularnewline
4 & 0.349063 & 2.4184 & 0.009716 \tabularnewline
5 & 0.435512 & 3.0173 & 0.002036 \tabularnewline
6 & 0.36859 & 2.5537 & 0.006945 \tabularnewline
7 & 0.156839 & 1.0866 & 0.141317 \tabularnewline
8 & 0.214764 & 1.4879 & 0.071655 \tabularnewline
9 & 0.179484 & 1.2435 & 0.109861 \tabularnewline
10 & -0.021464 & -0.1487 & 0.558796 \tabularnewline
11 & 0.020272 & 0.1404 & 0.444446 \tabularnewline
12 & -0.126436 & -0.876 & 0.807297 \tabularnewline
13 & -0.098118 & -0.6798 & 0.750047 \tabularnewline
14 & -0.071727 & -0.4969 & 0.68925 \tabularnewline
15 & -0.110536 & -0.7658 & 0.776233 \tabularnewline
16 & -0.162114 & -1.1232 & 0.866521 \tabularnewline
17 & -0.127752 & -0.8851 & 0.809741 \tabularnewline
18 & -0.145806 & -1.0102 & 0.841261 \tabularnewline
19 & -0.229369 & -1.5891 & 0.9407 \tabularnewline
20 & -0.109596 & -0.7593 & 0.774309 \tabularnewline
21 & -0.138979 & -0.9629 & 0.829782 \tabularnewline
22 & -0.147388 & -1.0211 & 0.843846 \tabularnewline
23 & -0.071469 & -0.4952 & 0.688624 \tabularnewline
24 & -0.178956 & -1.2398 & 0.889469 \tabularnewline
25 & -0.148056 & -1.0258 & 0.844927 \tabularnewline
26 & -0.039543 & -0.274 & 0.607354 \tabularnewline
27 & -0.102772 & -0.712 & 0.760052 \tabularnewline
28 & -0.128928 & -0.8932 & 0.811908 \tabularnewline
29 & -0.029664 & -0.2055 & 0.580982 \tabularnewline
30 & -0.143851 & -0.9966 & 0.838029 \tabularnewline
31 & 0.008012 & 0.0555 & 0.477981 \tabularnewline
32 & -0.096827 & -0.6708 & 0.747229 \tabularnewline
33 & -0.166241 & -1.1517 & 0.872436 \tabularnewline
34 & -0.129894 & -0.8999 & 0.813676 \tabularnewline
35 & -0.150803 & -1.0448 & 0.849324 \tabularnewline
\hline
\end{tabular}
%Source: https://freestatistics.org/blog/index.php?pk=7699&T=1

[TABLE]
[ROW][C]Autocorrelation Function[/C][/ROW]
[ROW][C]Time lag k[/C][C]ACF(k)[/C][C]T-STAT[/C][C]P-value[/C][/ROW]
[ROW][C]0[/C][C]1[/C][C]6.9282[/C][C]0[/C][/ROW]
[ROW][C]1[/C][C]0.487225[/C][C]3.3756[/C][C]0.000733[/C][/ROW]
[ROW][C]2[/C][C]0.547709[/C][C]3.7946[/C][C]0.000207[/C][/ROW]
[ROW][C]3[/C][C]0.524494[/C][C]3.6338[/C][C]0.000339[/C][/ROW]
[ROW][C]4[/C][C]0.349063[/C][C]2.4184[/C][C]0.009716[/C][/ROW]
[ROW][C]5[/C][C]0.435512[/C][C]3.0173[/C][C]0.002036[/C][/ROW]
[ROW][C]6[/C][C]0.36859[/C][C]2.5537[/C][C]0.006945[/C][/ROW]
[ROW][C]7[/C][C]0.156839[/C][C]1.0866[/C][C]0.141317[/C][/ROW]
[ROW][C]8[/C][C]0.214764[/C][C]1.4879[/C][C]0.071655[/C][/ROW]
[ROW][C]9[/C][C]0.179484[/C][C]1.2435[/C][C]0.109861[/C][/ROW]
[ROW][C]10[/C][C]-0.021464[/C][C]-0.1487[/C][C]0.558796[/C][/ROW]
[ROW][C]11[/C][C]0.020272[/C][C]0.1404[/C][C]0.444446[/C][/ROW]
[ROW][C]12[/C][C]-0.126436[/C][C]-0.876[/C][C]0.807297[/C][/ROW]
[ROW][C]13[/C][C]-0.098118[/C][C]-0.6798[/C][C]0.750047[/C][/ROW]
[ROW][C]14[/C][C]-0.071727[/C][C]-0.4969[/C][C]0.68925[/C][/ROW]
[ROW][C]15[/C][C]-0.110536[/C][C]-0.7658[/C][C]0.776233[/C][/ROW]
[ROW][C]16[/C][C]-0.162114[/C][C]-1.1232[/C][C]0.866521[/C][/ROW]
[ROW][C]17[/C][C]-0.127752[/C][C]-0.8851[/C][C]0.809741[/C][/ROW]
[ROW][C]18[/C][C]-0.145806[/C][C]-1.0102[/C][C]0.841261[/C][/ROW]
[ROW][C]19[/C][C]-0.229369[/C][C]-1.5891[/C][C]0.9407[/C][/ROW]
[ROW][C]20[/C][C]-0.109596[/C][C]-0.7593[/C][C]0.774309[/C][/ROW]
[ROW][C]21[/C][C]-0.138979[/C][C]-0.9629[/C][C]0.829782[/C][/ROW]
[ROW][C]22[/C][C]-0.147388[/C][C]-1.0211[/C][C]0.843846[/C][/ROW]
[ROW][C]23[/C][C]-0.071469[/C][C]-0.4952[/C][C]0.688624[/C][/ROW]
[ROW][C]24[/C][C]-0.178956[/C][C]-1.2398[/C][C]0.889469[/C][/ROW]
[ROW][C]25[/C][C]-0.148056[/C][C]-1.0258[/C][C]0.844927[/C][/ROW]
[ROW][C]26[/C][C]-0.039543[/C][C]-0.274[/C][C]0.607354[/C][/ROW]
[ROW][C]27[/C][C]-0.102772[/C][C]-0.712[/C][C]0.760052[/C][/ROW]
[ROW][C]28[/C][C]-0.128928[/C][C]-0.8932[/C][C]0.811908[/C][/ROW]
[ROW][C]29[/C][C]-0.029664[/C][C]-0.2055[/C][C]0.580982[/C][/ROW]
[ROW][C]30[/C][C]-0.143851[/C][C]-0.9966[/C][C]0.838029[/C][/ROW]
[ROW][C]31[/C][C]0.008012[/C][C]0.0555[/C][C]0.477981[/C][/ROW]
[ROW][C]32[/C][C]-0.096827[/C][C]-0.6708[/C][C]0.747229[/C][/ROW]
[ROW][C]33[/C][C]-0.166241[/C][C]-1.1517[/C][C]0.872436[/C][/ROW]
[ROW][C]34[/C][C]-0.129894[/C][C]-0.8999[/C][C]0.813676[/C][/ROW]
[ROW][C]35[/C][C]-0.150803[/C][C]-1.0448[/C][C]0.849324[/C][/ROW]
[/TABLE]
Source: https://freestatistics.org/blog/index.php?pk=7699&T=1

Globally Unique Identifier (entire table): ba.freestatistics.org/blog/index.php?pk=7699&T=1

As an alternative you can also use a QR Code:  

The GUIDs for individual cells are displayed in the table below:

Autocorrelation Function
Time lag kACF(k)T-STATP-value
016.92820
10.4872253.37560.000733
20.5477093.79460.000207
30.5244943.63380.000339
40.3490632.41840.009716
50.4355123.01730.002036
60.368592.55370.006945
70.1568391.08660.141317
80.2147641.48790.071655
90.1794841.24350.109861
10-0.021464-0.14870.558796
110.0202720.14040.444446
12-0.126436-0.8760.807297
13-0.098118-0.67980.750047
14-0.071727-0.49690.68925
15-0.110536-0.76580.776233
16-0.162114-1.12320.866521
17-0.127752-0.88510.809741
18-0.145806-1.01020.841261
19-0.229369-1.58910.9407
20-0.109596-0.75930.774309
21-0.138979-0.96290.829782
22-0.147388-1.02110.843846
23-0.071469-0.49520.688624
24-0.178956-1.23980.889469
25-0.148056-1.02580.844927
26-0.039543-0.2740.607354
27-0.102772-0.7120.760052
28-0.128928-0.89320.811908
29-0.029664-0.20550.580982
30-0.143851-0.99660.838029
310.0080120.05550.477981
32-0.096827-0.67080.747229
33-0.166241-1.15170.872436
34-0.129894-0.89990.813676
35-0.150803-1.04480.849324


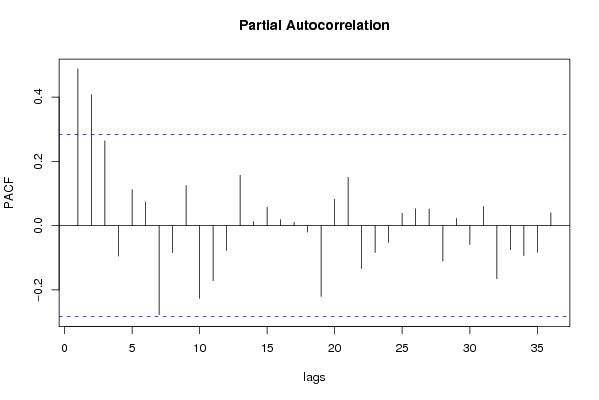
Partial Autocorrelation Function
Time lag kPACF(k)T-STATP-value
00.4872253.37560.000733
10.4069192.81920.003488
20.2639561.82870.036828
3-0.094365-0.65380.741814
40.1119410.77550.22091
50.0731250.50660.307369
6-0.276882-1.91830.969484
7-0.083617-0.57930.717458
80.124610.86330.196126
9-0.226369-1.56830.938313
10-0.1709-1.1840.878884
11-0.077196-0.53480.702381
120.1564661.0840.141884
130.0125590.0870.465512
140.0568740.3940.347649
150.0189750.13150.447978
160.0103840.07190.471473
17-0.020014-0.13870.554852
18-0.220157-1.52530.933125
190.0821570.56920.285937
200.150191.04050.151649
21-0.133476-0.92470.820138
22-0.083069-0.57550.716186
23-0.052343-0.36260.640769
240.038210.26470.396177
250.0521920.36160.359619
260.0519470.35990.36025
27-0.110096-0.76280.775334
280.0225250.15610.438322
29-0.058257-0.40360.655855
300.0593030.41090.341502
31-0.165289-1.14520.871089
32-0.074716-0.51760.696458
33-0.093061-0.64470.73892
34-0.082705-0.5730.71534
350.0400450.27740.391318

\begin{tabular}{lllllllll}
\hline
Partial Autocorrelation Function \tabularnewline
Time lag k & PACF(k) & T-STAT & P-value \tabularnewline
0 & 0.487225 & 3.3756 & 0.000733 \tabularnewline
1 & 0.406919 & 2.8192 & 0.003488 \tabularnewline
2 & 0.263956 & 1.8287 & 0.036828 \tabularnewline
3 & -0.094365 & -0.6538 & 0.741814 \tabularnewline
4 & 0.111941 & 0.7755 & 0.22091 \tabularnewline
5 & 0.073125 & 0.5066 & 0.307369 \tabularnewline
6 & -0.276882 & -1.9183 & 0.969484 \tabularnewline
7 & -0.083617 & -0.5793 & 0.717458 \tabularnewline
8 & 0.12461 & 0.8633 & 0.196126 \tabularnewline
9 & -0.226369 & -1.5683 & 0.938313 \tabularnewline
10 & -0.1709 & -1.184 & 0.878884 \tabularnewline
11 & -0.077196 & -0.5348 & 0.702381 \tabularnewline
12 & 0.156466 & 1.084 & 0.141884 \tabularnewline
13 & 0.012559 & 0.087 & 0.465512 \tabularnewline
14 & 0.056874 & 0.394 & 0.347649 \tabularnewline
15 & 0.018975 & 0.1315 & 0.447978 \tabularnewline
16 & 0.010384 & 0.0719 & 0.471473 \tabularnewline
17 & -0.020014 & -0.1387 & 0.554852 \tabularnewline
18 & -0.220157 & -1.5253 & 0.933125 \tabularnewline
19 & 0.082157 & 0.5692 & 0.285937 \tabularnewline
20 & 0.15019 & 1.0405 & 0.151649 \tabularnewline
21 & -0.133476 & -0.9247 & 0.820138 \tabularnewline
22 & -0.083069 & -0.5755 & 0.716186 \tabularnewline
23 & -0.052343 & -0.3626 & 0.640769 \tabularnewline
24 & 0.03821 & 0.2647 & 0.396177 \tabularnewline
25 & 0.052192 & 0.3616 & 0.359619 \tabularnewline
26 & 0.051947 & 0.3599 & 0.36025 \tabularnewline
27 & -0.110096 & -0.7628 & 0.775334 \tabularnewline
28 & 0.022525 & 0.1561 & 0.438322 \tabularnewline
29 & -0.058257 & -0.4036 & 0.655855 \tabularnewline
30 & 0.059303 & 0.4109 & 0.341502 \tabularnewline
31 & -0.165289 & -1.1452 & 0.871089 \tabularnewline
32 & -0.074716 & -0.5176 & 0.696458 \tabularnewline
33 & -0.093061 & -0.6447 & 0.73892 \tabularnewline
34 & -0.082705 & -0.573 & 0.71534 \tabularnewline
35 & 0.040045 & 0.2774 & 0.391318 \tabularnewline
\hline
\end{tabular}
%Source: https://freestatistics.org/blog/index.php?pk=7699&T=2

[TABLE]
[ROW][C]Partial Autocorrelation Function[/C][/ROW]
[ROW][C]Time lag k[/C][C]PACF(k)[/C][C]T-STAT[/C][C]P-value[/C][/ROW]
[ROW][C]0[/C][C]0.487225[/C][C]3.3756[/C][C]0.000733[/C][/ROW]
[ROW][C]1[/C][C]0.406919[/C][C]2.8192[/C][C]0.003488[/C][/ROW]
[ROW][C]2[/C][C]0.263956[/C][C]1.8287[/C][C]0.036828[/C][/ROW]
[ROW][C]3[/C][C]-0.094365[/C][C]-0.6538[/C][C]0.741814[/C][/ROW]
[ROW][C]4[/C][C]0.111941[/C][C]0.7755[/C][C]0.22091[/C][/ROW]
[ROW][C]5[/C][C]0.073125[/C][C]0.5066[/C][C]0.307369[/C][/ROW]
[ROW][C]6[/C][C]-0.276882[/C][C]-1.9183[/C][C]0.969484[/C][/ROW]
[ROW][C]7[/C][C]-0.083617[/C][C]-0.5793[/C][C]0.717458[/C][/ROW]
[ROW][C]8[/C][C]0.12461[/C][C]0.8633[/C][C]0.196126[/C][/ROW]
[ROW][C]9[/C][C]-0.226369[/C][C]-1.5683[/C][C]0.938313[/C][/ROW]
[ROW][C]10[/C][C]-0.1709[/C][C]-1.184[/C][C]0.878884[/C][/ROW]
[ROW][C]11[/C][C]-0.077196[/C][C]-0.5348[/C][C]0.702381[/C][/ROW]
[ROW][C]12[/C][C]0.156466[/C][C]1.084[/C][C]0.141884[/C][/ROW]
[ROW][C]13[/C][C]0.012559[/C][C]0.087[/C][C]0.465512[/C][/ROW]
[ROW][C]14[/C][C]0.056874[/C][C]0.394[/C][C]0.347649[/C][/ROW]
[ROW][C]15[/C][C]0.018975[/C][C]0.1315[/C][C]0.447978[/C][/ROW]
[ROW][C]16[/C][C]0.010384[/C][C]0.0719[/C][C]0.471473[/C][/ROW]
[ROW][C]17[/C][C]-0.020014[/C][C]-0.1387[/C][C]0.554852[/C][/ROW]
[ROW][C]18[/C][C]-0.220157[/C][C]-1.5253[/C][C]0.933125[/C][/ROW]
[ROW][C]19[/C][C]0.082157[/C][C]0.5692[/C][C]0.285937[/C][/ROW]
[ROW][C]20[/C][C]0.15019[/C][C]1.0405[/C][C]0.151649[/C][/ROW]
[ROW][C]21[/C][C]-0.133476[/C][C]-0.9247[/C][C]0.820138[/C][/ROW]
[ROW][C]22[/C][C]-0.083069[/C][C]-0.5755[/C][C]0.716186[/C][/ROW]
[ROW][C]23[/C][C]-0.052343[/C][C]-0.3626[/C][C]0.640769[/C][/ROW]
[ROW][C]24[/C][C]0.03821[/C][C]0.2647[/C][C]0.396177[/C][/ROW]
[ROW][C]25[/C][C]0.052192[/C][C]0.3616[/C][C]0.359619[/C][/ROW]
[ROW][C]26[/C][C]0.051947[/C][C]0.3599[/C][C]0.36025[/C][/ROW]
[ROW][C]27[/C][C]-0.110096[/C][C]-0.7628[/C][C]0.775334[/C][/ROW]
[ROW][C]28[/C][C]0.022525[/C][C]0.1561[/C][C]0.438322[/C][/ROW]
[ROW][C]29[/C][C]-0.058257[/C][C]-0.4036[/C][C]0.655855[/C][/ROW]
[ROW][C]30[/C][C]0.059303[/C][C]0.4109[/C][C]0.341502[/C][/ROW]
[ROW][C]31[/C][C]-0.165289[/C][C]-1.1452[/C][C]0.871089[/C][/ROW]
[ROW][C]32[/C][C]-0.074716[/C][C]-0.5176[/C][C]0.696458[/C][/ROW]
[ROW][C]33[/C][C]-0.093061[/C][C]-0.6447[/C][C]0.73892[/C][/ROW]
[ROW][C]34[/C][C]-0.082705[/C][C]-0.573[/C][C]0.71534[/C][/ROW]
[ROW][C]35[/C][C]0.040045[/C][C]0.2774[/C][C]0.391318[/C][/ROW]
[/TABLE]
Source: https://freestatistics.org/blog/index.php?pk=7699&T=2

Globally Unique Identifier (entire table): ba.freestatistics.org/blog/index.php?pk=7699&T=2

As an alternative you can also use a QR Code:  

The GUIDs for individual cells are displayed in the table below:

Partial Autocorrelation Function
Time lag kPACF(k)T-STATP-value
00.4872253.37560.000733
10.4069192.81920.003488
20.2639561.82870.036828
3-0.094365-0.65380.741814
40.1119410.77550.22091
50.0731250.50660.307369
6-0.276882-1.91830.969484
7-0.083617-0.57930.717458
80.124610.86330.196126
9-0.226369-1.56830.938313
10-0.1709-1.1840.878884
11-0.077196-0.53480.702381
120.1564661.0840.141884
130.0125590.0870.465512
140.0568740.3940.347649
150.0189750.13150.447978
160.0103840.07190.471473
17-0.020014-0.13870.554852
18-0.220157-1.52530.933125
190.0821570.56920.285937
200.150191.04050.151649
21-0.133476-0.92470.820138
22-0.083069-0.57550.716186
23-0.052343-0.36260.640769
240.038210.26470.396177
250.0521920.36160.359619
260.0519470.35990.36025
27-0.110096-0.76280.775334
280.0225250.15610.438322
29-0.058257-0.40360.655855
300.0593030.41090.341502
31-0.165289-1.14520.871089
32-0.074716-0.51760.696458
33-0.093061-0.64470.73892
34-0.082705-0.5730.71534
350.0400450.27740.391318


Parameters (Session):
par1 = 36 ; par2 = 1 ; par3 = 0 ; par4 = 1 ; par5 = 12 ;
Parameters (R input):
par1 = 36 ; par2 = 1 ; par3 = 0 ; par4 = 1 ; par5 = 12 ;
R code (references can be found in the software module):
if (par1 == 'Default') {
par1 = 10*log10(length(x))
} else {
par1 <- as.numeric(par1)
}
par2 <- as.numeric(par2)
par3 <- as.numeric(par3)
par4 <- as.numeric(par4)
par5 <- as.numeric(par5)
if (par2 == 0) {
x <- log(x)
} else {
x <- (x ^ par2 - 1) / par2
}
if (par3 > 0) x <- diff(x,lag=1,difference=par3)
if (par4 > 0) x <- diff(x,lag=par5,difference=par4)
bitmap(file='pic1.png')
racf <- acf(x,par1,main='Autocorrelation',xlab='lags',ylab='ACF')
dev.off()
bitmap(file='pic2.png')
rpacf <- pacf(x,par1,main='Partial Autocorrelation',xlab='lags',ylab='PACF')
dev.off()
(myacf <- c(racf$acf))
(mypacf <- c(rpacf$acf))
lengthx <- length(x)
sqrtn <- sqrt(lengthx)
load(file='createtable')
a<-table.start()
a<-table.row.start(a)
a<-table.element(a,'Autocorrelation Function',4,TRUE)
a<-table.row.end(a)
a<-table.row.start(a)
a<-table.element(a,'Time lag k',header=TRUE)
a<-table.element(a,hyperlink('basics.htm','ACF(k)','click here for more information about the Autocorrelation Function'),header=TRUE)
a<-table.element(a,'T-STAT',header=TRUE)
a<-table.element(a,'P-value',header=TRUE)
a<-table.row.end(a)
for (i in 1:par1) {
a<-table.row.start(a)
a<-table.element(a,i-1,header=TRUE)
a<-table.element(a,round(myacf[i],6))
mytstat <- myacf[i]*sqrtn
a<-table.element(a,round(mytstat,4))
a<-table.element(a,round(1-pt(mytstat,lengthx),6))
a<-table.row.end(a)
}
a<-table.end(a)
table.save(a,file='mytable.tab')
a<-table.start()
a<-table.row.start(a)
a<-table.element(a,'Partial Autocorrelation Function',4,TRUE)
a<-table.row.end(a)
a<-table.row.start(a)
a<-table.element(a,'Time lag k',header=TRUE)
a<-table.element(a,hyperlink('basics.htm','PACF(k)','click here for more information about the Partial Autocorrelation Function'),header=TRUE)
a<-table.element(a,'T-STAT',header=TRUE)
a<-table.element(a,'P-value',header=TRUE)
a<-table.row.end(a)
for (i in 1:par1) {
a<-table.row.start(a)
a<-table.element(a,i-1,header=TRUE)
a<-table.element(a,round(mypacf[i],6))
mytstat <- mypacf[i]*sqrtn
a<-table.element(a,round(mytstat,4))
a<-table.element(a,round(1-pt(mytstat,lengthx),6))
a<-table.row.end(a)
}
a<-table.end(a)
table.save(a,file='mytable1.tab')