Free Statistics

of Irreproducible Research!

Author's title

Author*Unverified author*
R Software Modulerwasp_autocorrelation.wasp
Title produced by software(Partial) Autocorrelation Function
Date of computationFri, 30 Nov 2007 04:28:35 -0700
Cite this page as followsStatistical Computations at FreeStatistics.org, Office for Research Development and Education, URL https://freestatistics.org/blog/index.php?v=date/2007/Nov/30/t11964214831beytanp3mvj9wu.htm/, Retrieved Sat, 27 Apr 2024 15:42:11 +0000
Statistical Computations at FreeStatistics.org, Office for Research Development and Education, URL https://freestatistics.org/blog/index.php?pk=7651, Retrieved Sat, 27 Apr 2024 15:42:11 +0000
QR Codes:

Original text written by user:
IsPrivate?No (this computation is public)
User-defined keywordsWorkshop 8, question 1, autocorrelation function, niet-duurzame consumptiegoederen
Estimated Impact225
Family? (F = Feedback message, R = changed R code, M = changed R Module, P = changed Parameters, D = changed Data)
-       [(Partial) Autocorrelation Function] [Workshop 8, quest...] [2007-11-30 11:28:35] [181c187d2008ac66a37ecc12859b08c5] [Current]
Feedback Forum

Post a new message
Dataseries X:
112,7
118,4
108,1
105,4
114,6
106,9
115,9
109,8
101,8
114,2
110,8
108,4
127,5
128,6
116,6
127,4
105
108,3
125
111,6
106,5
130,3
115
116,1
134
126,5
125,8
136,4
114,9
110,9
125,5
116,8
116,8
125,5
104,2
115,1
132,8
123,3
124,8
122
117,4
117,9
137,4
114,6
124,7
129,6
109,4
120,9
134,9
136,3
133,2
127,2
122,7
120,5
137,8
119,1
124,3
134,3
121,7
125


Summary of compuational transaction
Raw Inputview raw input (R code)
Raw Outputview raw output of R engine
Computing time1 seconds
R Server'Gwilym Jenkins' @ 72.249.127.135

\begin{tabular}{lllllllll}
\hline
Summary of compuational transaction \tabularnewline
Raw Input & view raw input (R code)  \tabularnewline
Raw Output & view raw output of R engine  \tabularnewline
Computing time & 1 seconds \tabularnewline
R Server & 'Gwilym Jenkins' @ 72.249.127.135 \tabularnewline
\hline
\end{tabular}
%Source: https://freestatistics.org/blog/index.php?pk=7651&T=0

[TABLE]
[ROW][C]Summary of compuational transaction[/C][/ROW]
[ROW][C]Raw Input[/C][C]view raw input (R code) [/C][/ROW]
[ROW][C]Raw Output[/C][C]view raw output of R engine [/C][/ROW]
[ROW][C]Computing time[/C][C]1 seconds[/C][/ROW]
[ROW][C]R Server[/C][C]'Gwilym Jenkins' @ 72.249.127.135[/C][/ROW]
[/TABLE]
Source: https://freestatistics.org/blog/index.php?pk=7651&T=0

Globally Unique Identifier (entire table): ba.freestatistics.org/blog/index.php?pk=7651&T=0

As an alternative you can also use a QR Code:  

The GUIDs for individual cells are displayed in the table below:

Summary of compuational transaction
Raw Inputview raw input (R code)
Raw Outputview raw output of R engine
Computing time1 seconds
R Server'Gwilym Jenkins' @ 72.249.127.135


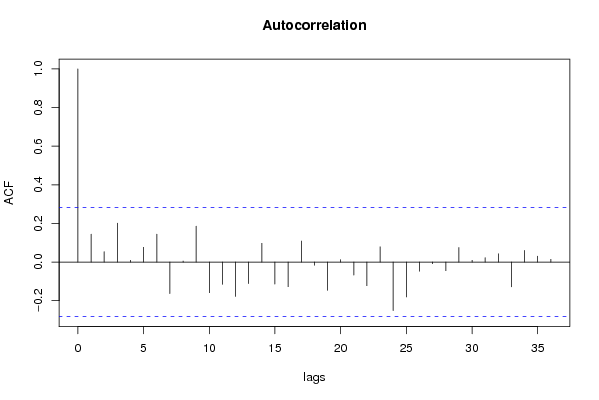
Autocorrelation Function
Time lag kACF(k)T-STATP-value
016.92820
10.1440050.99770.161714
20.053470.37050.356337
30.2013141.39470.084757
40.0090450.06270.475147
50.0765410.53030.299177
60.1440960.99830.161563
7-0.163556-1.13310.86861
80.0052030.0360.485696
90.1856071.28590.10232
10-0.158944-1.10120.861848
11-0.115718-0.80170.786666
12-0.178473-1.23650.888855
13-0.111832-0.77480.778869
140.0967860.67060.252859
15-0.114129-0.79070.783499
16-0.127459-0.88310.809197
170.1086020.75240.227737
18-0.016244-0.11250.544569
19-0.146798-1.0170.842884
200.0122510.08490.466356
21-0.067651-0.46870.679298
22-0.122562-0.84910.799988
230.079110.54810.293084
24-0.251648-1.74350.956173
25-0.180541-1.25080.89147
26-0.047742-0.33080.628868
27-0.008267-0.05730.522719
28-0.045161-0.31290.622137
290.0748910.51890.303121
300.0089990.06230.475272
310.0224730.15570.438461
320.0424320.2940.385022
33-0.128348-0.88920.81084
340.0601750.41690.339304
350.0301850.20910.417616

\begin{tabular}{lllllllll}
\hline
Autocorrelation Function \tabularnewline
Time lag k & ACF(k) & T-STAT & P-value \tabularnewline
0 & 1 & 6.9282 & 0 \tabularnewline
1 & 0.144005 & 0.9977 & 0.161714 \tabularnewline
2 & 0.05347 & 0.3705 & 0.356337 \tabularnewline
3 & 0.201314 & 1.3947 & 0.084757 \tabularnewline
4 & 0.009045 & 0.0627 & 0.475147 \tabularnewline
5 & 0.076541 & 0.5303 & 0.299177 \tabularnewline
6 & 0.144096 & 0.9983 & 0.161563 \tabularnewline
7 & -0.163556 & -1.1331 & 0.86861 \tabularnewline
8 & 0.005203 & 0.036 & 0.485696 \tabularnewline
9 & 0.185607 & 1.2859 & 0.10232 \tabularnewline
10 & -0.158944 & -1.1012 & 0.861848 \tabularnewline
11 & -0.115718 & -0.8017 & 0.786666 \tabularnewline
12 & -0.178473 & -1.2365 & 0.888855 \tabularnewline
13 & -0.111832 & -0.7748 & 0.778869 \tabularnewline
14 & 0.096786 & 0.6706 & 0.252859 \tabularnewline
15 & -0.114129 & -0.7907 & 0.783499 \tabularnewline
16 & -0.127459 & -0.8831 & 0.809197 \tabularnewline
17 & 0.108602 & 0.7524 & 0.227737 \tabularnewline
18 & -0.016244 & -0.1125 & 0.544569 \tabularnewline
19 & -0.146798 & -1.017 & 0.842884 \tabularnewline
20 & 0.012251 & 0.0849 & 0.466356 \tabularnewline
21 & -0.067651 & -0.4687 & 0.679298 \tabularnewline
22 & -0.122562 & -0.8491 & 0.799988 \tabularnewline
23 & 0.07911 & 0.5481 & 0.293084 \tabularnewline
24 & -0.251648 & -1.7435 & 0.956173 \tabularnewline
25 & -0.180541 & -1.2508 & 0.89147 \tabularnewline
26 & -0.047742 & -0.3308 & 0.628868 \tabularnewline
27 & -0.008267 & -0.0573 & 0.522719 \tabularnewline
28 & -0.045161 & -0.3129 & 0.622137 \tabularnewline
29 & 0.074891 & 0.5189 & 0.303121 \tabularnewline
30 & 0.008999 & 0.0623 & 0.475272 \tabularnewline
31 & 0.022473 & 0.1557 & 0.438461 \tabularnewline
32 & 0.042432 & 0.294 & 0.385022 \tabularnewline
33 & -0.128348 & -0.8892 & 0.81084 \tabularnewline
34 & 0.060175 & 0.4169 & 0.339304 \tabularnewline
35 & 0.030185 & 0.2091 & 0.417616 \tabularnewline
\hline
\end{tabular}
%Source: https://freestatistics.org/blog/index.php?pk=7651&T=1

[TABLE]
[ROW][C]Autocorrelation Function[/C][/ROW]
[ROW][C]Time lag k[/C][C]ACF(k)[/C][C]T-STAT[/C][C]P-value[/C][/ROW]
[ROW][C]0[/C][C]1[/C][C]6.9282[/C][C]0[/C][/ROW]
[ROW][C]1[/C][C]0.144005[/C][C]0.9977[/C][C]0.161714[/C][/ROW]
[ROW][C]2[/C][C]0.05347[/C][C]0.3705[/C][C]0.356337[/C][/ROW]
[ROW][C]3[/C][C]0.201314[/C][C]1.3947[/C][C]0.084757[/C][/ROW]
[ROW][C]4[/C][C]0.009045[/C][C]0.0627[/C][C]0.475147[/C][/ROW]
[ROW][C]5[/C][C]0.076541[/C][C]0.5303[/C][C]0.299177[/C][/ROW]
[ROW][C]6[/C][C]0.144096[/C][C]0.9983[/C][C]0.161563[/C][/ROW]
[ROW][C]7[/C][C]-0.163556[/C][C]-1.1331[/C][C]0.86861[/C][/ROW]
[ROW][C]8[/C][C]0.005203[/C][C]0.036[/C][C]0.485696[/C][/ROW]
[ROW][C]9[/C][C]0.185607[/C][C]1.2859[/C][C]0.10232[/C][/ROW]
[ROW][C]10[/C][C]-0.158944[/C][C]-1.1012[/C][C]0.861848[/C][/ROW]
[ROW][C]11[/C][C]-0.115718[/C][C]-0.8017[/C][C]0.786666[/C][/ROW]
[ROW][C]12[/C][C]-0.178473[/C][C]-1.2365[/C][C]0.888855[/C][/ROW]
[ROW][C]13[/C][C]-0.111832[/C][C]-0.7748[/C][C]0.778869[/C][/ROW]
[ROW][C]14[/C][C]0.096786[/C][C]0.6706[/C][C]0.252859[/C][/ROW]
[ROW][C]15[/C][C]-0.114129[/C][C]-0.7907[/C][C]0.783499[/C][/ROW]
[ROW][C]16[/C][C]-0.127459[/C][C]-0.8831[/C][C]0.809197[/C][/ROW]
[ROW][C]17[/C][C]0.108602[/C][C]0.7524[/C][C]0.227737[/C][/ROW]
[ROW][C]18[/C][C]-0.016244[/C][C]-0.1125[/C][C]0.544569[/C][/ROW]
[ROW][C]19[/C][C]-0.146798[/C][C]-1.017[/C][C]0.842884[/C][/ROW]
[ROW][C]20[/C][C]0.012251[/C][C]0.0849[/C][C]0.466356[/C][/ROW]
[ROW][C]21[/C][C]-0.067651[/C][C]-0.4687[/C][C]0.679298[/C][/ROW]
[ROW][C]22[/C][C]-0.122562[/C][C]-0.8491[/C][C]0.799988[/C][/ROW]
[ROW][C]23[/C][C]0.07911[/C][C]0.5481[/C][C]0.293084[/C][/ROW]
[ROW][C]24[/C][C]-0.251648[/C][C]-1.7435[/C][C]0.956173[/C][/ROW]
[ROW][C]25[/C][C]-0.180541[/C][C]-1.2508[/C][C]0.89147[/C][/ROW]
[ROW][C]26[/C][C]-0.047742[/C][C]-0.3308[/C][C]0.628868[/C][/ROW]
[ROW][C]27[/C][C]-0.008267[/C][C]-0.0573[/C][C]0.522719[/C][/ROW]
[ROW][C]28[/C][C]-0.045161[/C][C]-0.3129[/C][C]0.622137[/C][/ROW]
[ROW][C]29[/C][C]0.074891[/C][C]0.5189[/C][C]0.303121[/C][/ROW]
[ROW][C]30[/C][C]0.008999[/C][C]0.0623[/C][C]0.475272[/C][/ROW]
[ROW][C]31[/C][C]0.022473[/C][C]0.1557[/C][C]0.438461[/C][/ROW]
[ROW][C]32[/C][C]0.042432[/C][C]0.294[/C][C]0.385022[/C][/ROW]
[ROW][C]33[/C][C]-0.128348[/C][C]-0.8892[/C][C]0.81084[/C][/ROW]
[ROW][C]34[/C][C]0.060175[/C][C]0.4169[/C][C]0.339304[/C][/ROW]
[ROW][C]35[/C][C]0.030185[/C][C]0.2091[/C][C]0.417616[/C][/ROW]
[/TABLE]
Source: https://freestatistics.org/blog/index.php?pk=7651&T=1

Globally Unique Identifier (entire table): ba.freestatistics.org/blog/index.php?pk=7651&T=1

As an alternative you can also use a QR Code:  

The GUIDs for individual cells are displayed in the table below:

Autocorrelation Function
Time lag kACF(k)T-STATP-value
016.92820
10.1440050.99770.161714
20.053470.37050.356337
30.2013141.39470.084757
40.0090450.06270.475147
50.0765410.53030.299177
60.1440960.99830.161563
7-0.163556-1.13310.86861
80.0052030.0360.485696
90.1856071.28590.10232
10-0.158944-1.10120.861848
11-0.115718-0.80170.786666
12-0.178473-1.23650.888855
13-0.111832-0.77480.778869
140.0967860.67060.252859
15-0.114129-0.79070.783499
16-0.127459-0.88310.809197
170.1086020.75240.227737
18-0.016244-0.11250.544569
19-0.146798-1.0170.842884
200.0122510.08490.466356
21-0.067651-0.46870.679298
22-0.122562-0.84910.799988
230.079110.54810.293084
24-0.251648-1.74350.956173
25-0.180541-1.25080.89147
26-0.047742-0.33080.628868
27-0.008267-0.05730.522719
28-0.045161-0.31290.622137
290.0748910.51890.303121
300.0089990.06230.475272
310.0224730.15570.438461
320.0424320.2940.385022
33-0.128348-0.88920.81084
340.0601750.41690.339304
350.0301850.20910.417616


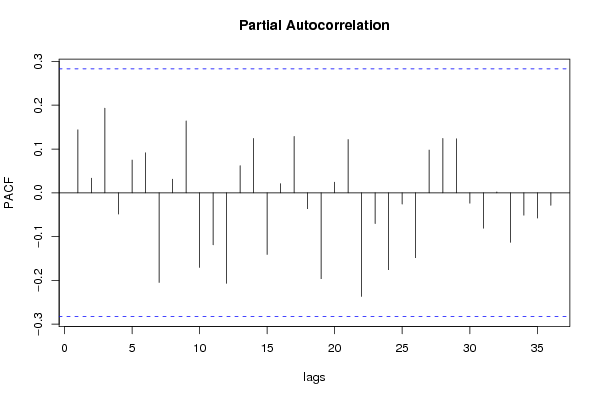
Partial Autocorrelation Function
Time lag kPACF(k)T-STATP-value
00.1440050.99770.161714
10.0334260.23160.408923
20.1932771.33910.093428
3-0.0487-0.33740.631359
40.0747410.51780.303482
50.0913260.63270.264958
6-0.204731-1.41840.918736
70.0311420.21580.415046
80.1640371.13650.130698
9-0.170365-1.18030.878157
10-0.118721-0.82250.792576
11-0.206857-1.43310.920851
120.0619140.4290.334938
130.124140.86010.197014
14-0.140758-0.97520.832825
150.0207720.14390.443085
160.1287860.89230.188354
17-0.036418-0.25230.599062
18-0.196132-1.35880.909726
190.024190.16760.433804
200.1217090.84320.201643
21-0.236708-1.640.946224
22-0.07039-0.48770.686001
23-0.175556-1.21630.885089
24-0.025686-0.1780.570248
25-0.14809-1.0260.844983
260.0975810.67610.251122
270.1242730.8610.196762
280.1233540.85460.198503
29-0.023829-0.16510.565219
30-0.080714-0.55920.710688
310.0019110.01320.494744
32-0.112983-0.78280.781196
33-0.051022-0.35350.637367
34-0.05773-0.40.654521
35-0.028493-0.19740.577829

\begin{tabular}{lllllllll}
\hline
Partial Autocorrelation Function \tabularnewline
Time lag k & PACF(k) & T-STAT & P-value \tabularnewline
0 & 0.144005 & 0.9977 & 0.161714 \tabularnewline
1 & 0.033426 & 0.2316 & 0.408923 \tabularnewline
2 & 0.193277 & 1.3391 & 0.093428 \tabularnewline
3 & -0.0487 & -0.3374 & 0.631359 \tabularnewline
4 & 0.074741 & 0.5178 & 0.303482 \tabularnewline
5 & 0.091326 & 0.6327 & 0.264958 \tabularnewline
6 & -0.204731 & -1.4184 & 0.918736 \tabularnewline
7 & 0.031142 & 0.2158 & 0.415046 \tabularnewline
8 & 0.164037 & 1.1365 & 0.130698 \tabularnewline
9 & -0.170365 & -1.1803 & 0.878157 \tabularnewline
10 & -0.118721 & -0.8225 & 0.792576 \tabularnewline
11 & -0.206857 & -1.4331 & 0.920851 \tabularnewline
12 & 0.061914 & 0.429 & 0.334938 \tabularnewline
13 & 0.12414 & 0.8601 & 0.197014 \tabularnewline
14 & -0.140758 & -0.9752 & 0.832825 \tabularnewline
15 & 0.020772 & 0.1439 & 0.443085 \tabularnewline
16 & 0.128786 & 0.8923 & 0.188354 \tabularnewline
17 & -0.036418 & -0.2523 & 0.599062 \tabularnewline
18 & -0.196132 & -1.3588 & 0.909726 \tabularnewline
19 & 0.02419 & 0.1676 & 0.433804 \tabularnewline
20 & 0.121709 & 0.8432 & 0.201643 \tabularnewline
21 & -0.236708 & -1.64 & 0.946224 \tabularnewline
22 & -0.07039 & -0.4877 & 0.686001 \tabularnewline
23 & -0.175556 & -1.2163 & 0.885089 \tabularnewline
24 & -0.025686 & -0.178 & 0.570248 \tabularnewline
25 & -0.14809 & -1.026 & 0.844983 \tabularnewline
26 & 0.097581 & 0.6761 & 0.251122 \tabularnewline
27 & 0.124273 & 0.861 & 0.196762 \tabularnewline
28 & 0.123354 & 0.8546 & 0.198503 \tabularnewline
29 & -0.023829 & -0.1651 & 0.565219 \tabularnewline
30 & -0.080714 & -0.5592 & 0.710688 \tabularnewline
31 & 0.001911 & 0.0132 & 0.494744 \tabularnewline
32 & -0.112983 & -0.7828 & 0.781196 \tabularnewline
33 & -0.051022 & -0.3535 & 0.637367 \tabularnewline
34 & -0.05773 & -0.4 & 0.654521 \tabularnewline
35 & -0.028493 & -0.1974 & 0.577829 \tabularnewline
\hline
\end{tabular}
%Source: https://freestatistics.org/blog/index.php?pk=7651&T=2

[TABLE]
[ROW][C]Partial Autocorrelation Function[/C][/ROW]
[ROW][C]Time lag k[/C][C]PACF(k)[/C][C]T-STAT[/C][C]P-value[/C][/ROW]
[ROW][C]0[/C][C]0.144005[/C][C]0.9977[/C][C]0.161714[/C][/ROW]
[ROW][C]1[/C][C]0.033426[/C][C]0.2316[/C][C]0.408923[/C][/ROW]
[ROW][C]2[/C][C]0.193277[/C][C]1.3391[/C][C]0.093428[/C][/ROW]
[ROW][C]3[/C][C]-0.0487[/C][C]-0.3374[/C][C]0.631359[/C][/ROW]
[ROW][C]4[/C][C]0.074741[/C][C]0.5178[/C][C]0.303482[/C][/ROW]
[ROW][C]5[/C][C]0.091326[/C][C]0.6327[/C][C]0.264958[/C][/ROW]
[ROW][C]6[/C][C]-0.204731[/C][C]-1.4184[/C][C]0.918736[/C][/ROW]
[ROW][C]7[/C][C]0.031142[/C][C]0.2158[/C][C]0.415046[/C][/ROW]
[ROW][C]8[/C][C]0.164037[/C][C]1.1365[/C][C]0.130698[/C][/ROW]
[ROW][C]9[/C][C]-0.170365[/C][C]-1.1803[/C][C]0.878157[/C][/ROW]
[ROW][C]10[/C][C]-0.118721[/C][C]-0.8225[/C][C]0.792576[/C][/ROW]
[ROW][C]11[/C][C]-0.206857[/C][C]-1.4331[/C][C]0.920851[/C][/ROW]
[ROW][C]12[/C][C]0.061914[/C][C]0.429[/C][C]0.334938[/C][/ROW]
[ROW][C]13[/C][C]0.12414[/C][C]0.8601[/C][C]0.197014[/C][/ROW]
[ROW][C]14[/C][C]-0.140758[/C][C]-0.9752[/C][C]0.832825[/C][/ROW]
[ROW][C]15[/C][C]0.020772[/C][C]0.1439[/C][C]0.443085[/C][/ROW]
[ROW][C]16[/C][C]0.128786[/C][C]0.8923[/C][C]0.188354[/C][/ROW]
[ROW][C]17[/C][C]-0.036418[/C][C]-0.2523[/C][C]0.599062[/C][/ROW]
[ROW][C]18[/C][C]-0.196132[/C][C]-1.3588[/C][C]0.909726[/C][/ROW]
[ROW][C]19[/C][C]0.02419[/C][C]0.1676[/C][C]0.433804[/C][/ROW]
[ROW][C]20[/C][C]0.121709[/C][C]0.8432[/C][C]0.201643[/C][/ROW]
[ROW][C]21[/C][C]-0.236708[/C][C]-1.64[/C][C]0.946224[/C][/ROW]
[ROW][C]22[/C][C]-0.07039[/C][C]-0.4877[/C][C]0.686001[/C][/ROW]
[ROW][C]23[/C][C]-0.175556[/C][C]-1.2163[/C][C]0.885089[/C][/ROW]
[ROW][C]24[/C][C]-0.025686[/C][C]-0.178[/C][C]0.570248[/C][/ROW]
[ROW][C]25[/C][C]-0.14809[/C][C]-1.026[/C][C]0.844983[/C][/ROW]
[ROW][C]26[/C][C]0.097581[/C][C]0.6761[/C][C]0.251122[/C][/ROW]
[ROW][C]27[/C][C]0.124273[/C][C]0.861[/C][C]0.196762[/C][/ROW]
[ROW][C]28[/C][C]0.123354[/C][C]0.8546[/C][C]0.198503[/C][/ROW]
[ROW][C]29[/C][C]-0.023829[/C][C]-0.1651[/C][C]0.565219[/C][/ROW]
[ROW][C]30[/C][C]-0.080714[/C][C]-0.5592[/C][C]0.710688[/C][/ROW]
[ROW][C]31[/C][C]0.001911[/C][C]0.0132[/C][C]0.494744[/C][/ROW]
[ROW][C]32[/C][C]-0.112983[/C][C]-0.7828[/C][C]0.781196[/C][/ROW]
[ROW][C]33[/C][C]-0.051022[/C][C]-0.3535[/C][C]0.637367[/C][/ROW]
[ROW][C]34[/C][C]-0.05773[/C][C]-0.4[/C][C]0.654521[/C][/ROW]
[ROW][C]35[/C][C]-0.028493[/C][C]-0.1974[/C][C]0.577829[/C][/ROW]
[/TABLE]
Source: https://freestatistics.org/blog/index.php?pk=7651&T=2

Globally Unique Identifier (entire table): ba.freestatistics.org/blog/index.php?pk=7651&T=2

As an alternative you can also use a QR Code:  

The GUIDs for individual cells are displayed in the table below:

Partial Autocorrelation Function
Time lag kPACF(k)T-STATP-value
00.1440050.99770.161714
10.0334260.23160.408923
20.1932771.33910.093428
3-0.0487-0.33740.631359
40.0747410.51780.303482
50.0913260.63270.264958
6-0.204731-1.41840.918736
70.0311420.21580.415046
80.1640371.13650.130698
9-0.170365-1.18030.878157
10-0.118721-0.82250.792576
11-0.206857-1.43310.920851
120.0619140.4290.334938
130.124140.86010.197014
14-0.140758-0.97520.832825
150.0207720.14390.443085
160.1287860.89230.188354
17-0.036418-0.25230.599062
18-0.196132-1.35880.909726
190.024190.16760.433804
200.1217090.84320.201643
21-0.236708-1.640.946224
22-0.07039-0.48770.686001
23-0.175556-1.21630.885089
24-0.025686-0.1780.570248
25-0.14809-1.0260.844983
260.0975810.67610.251122
270.1242730.8610.196762
280.1233540.85460.198503
29-0.023829-0.16510.565219
30-0.080714-0.55920.710688
310.0019110.01320.494744
32-0.112983-0.78280.781196
33-0.051022-0.35350.637367
34-0.05773-0.40.654521
35-0.028493-0.19740.577829


Parameters (Session):
par1 = FALSE ; par2 = 1 ; par3 = 1 ; par4 = 0 ; par5 = 12 ; par6 = 3 ; par7 = 1 ; par8 = 2 ; par9 = 1 ;
Parameters (R input):
par1 = 36 ; par2 = 1 ; par3 = 0 ; par4 = 1 ; par5 = 12 ;
R code (references can be found in the software module):
if (par1 == 'Default') {
par1 = 10*log10(length(x))
} else {
par1 <- as.numeric(par1)
}
par2 <- as.numeric(par2)
par3 <- as.numeric(par3)
par4 <- as.numeric(par4)
par5 <- as.numeric(par5)
if (par2 == 0) {
x <- log(x)
} else {
x <- (x ^ par2 - 1) / par2
}
if (par3 > 0) x <- diff(x,lag=1,difference=par3)
if (par4 > 0) x <- diff(x,lag=par5,difference=par4)
bitmap(file='pic1.png')
racf <- acf(x,par1,main='Autocorrelation',xlab='lags',ylab='ACF')
dev.off()
bitmap(file='pic2.png')
rpacf <- pacf(x,par1,main='Partial Autocorrelation',xlab='lags',ylab='PACF')
dev.off()
(myacf <- c(racf$acf))
(mypacf <- c(rpacf$acf))
lengthx <- length(x)
sqrtn <- sqrt(lengthx)
load(file='createtable')
a<-table.start()
a<-table.row.start(a)
a<-table.element(a,'Autocorrelation Function',4,TRUE)
a<-table.row.end(a)
a<-table.row.start(a)
a<-table.element(a,'Time lag k',header=TRUE)
a<-table.element(a,hyperlink('basics.htm','ACF(k)','click here for more information about the Autocorrelation Function'),header=TRUE)
a<-table.element(a,'T-STAT',header=TRUE)
a<-table.element(a,'P-value',header=TRUE)
a<-table.row.end(a)
for (i in 1:par1) {
a<-table.row.start(a)
a<-table.element(a,i-1,header=TRUE)
a<-table.element(a,round(myacf[i],6))
mytstat <- myacf[i]*sqrtn
a<-table.element(a,round(mytstat,4))
a<-table.element(a,round(1-pt(mytstat,lengthx),6))
a<-table.row.end(a)
}
a<-table.end(a)
table.save(a,file='mytable.tab')
a<-table.start()
a<-table.row.start(a)
a<-table.element(a,'Partial Autocorrelation Function',4,TRUE)
a<-table.row.end(a)
a<-table.row.start(a)
a<-table.element(a,'Time lag k',header=TRUE)
a<-table.element(a,hyperlink('basics.htm','PACF(k)','click here for more information about the Partial Autocorrelation Function'),header=TRUE)
a<-table.element(a,'T-STAT',header=TRUE)
a<-table.element(a,'P-value',header=TRUE)
a<-table.row.end(a)
for (i in 1:par1) {
a<-table.row.start(a)
a<-table.element(a,i-1,header=TRUE)
a<-table.element(a,round(mypacf[i],6))
mytstat <- mypacf[i]*sqrtn
a<-table.element(a,round(mytstat,4))
a<-table.element(a,round(1-pt(mytstat,lengthx),6))
a<-table.row.end(a)
}
a<-table.end(a)
table.save(a,file='mytable1.tab')