Free Statistics
of Irreproducible Research!
Description of Statistical Computation | |||||||||||||||||||||||||||||||||||||||||||||||||||||
|---|---|---|---|---|---|---|---|---|---|---|---|---|---|---|---|---|---|---|---|---|---|---|---|---|---|---|---|---|---|---|---|---|---|---|---|---|---|---|---|---|---|---|---|---|---|---|---|---|---|---|---|---|---|
| Author's title | |||||||||||||||||||||||||||||||||||||||||||||||||||||
| Author | *Unverified author* | ||||||||||||||||||||||||||||||||||||||||||||||||||||
| R Software Module | rwasp_edauni.wasp | ||||||||||||||||||||||||||||||||||||||||||||||||||||
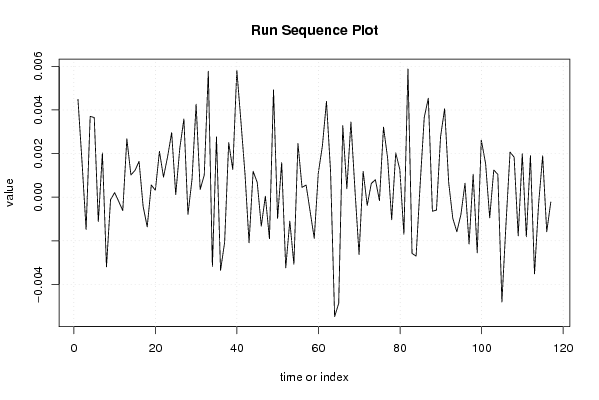
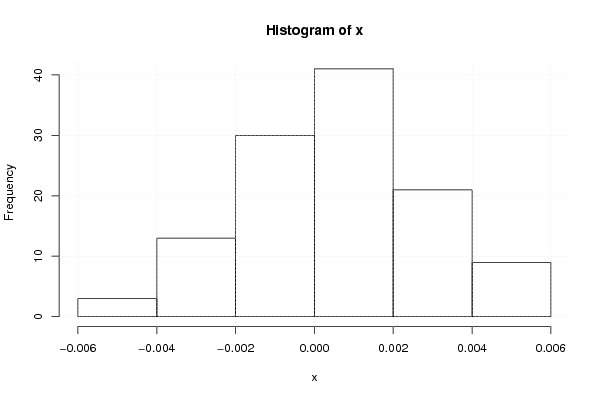
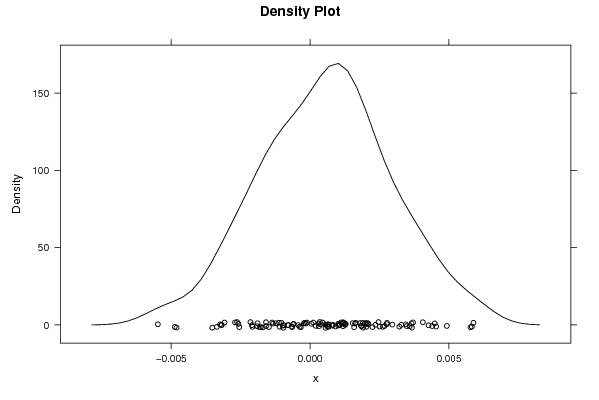
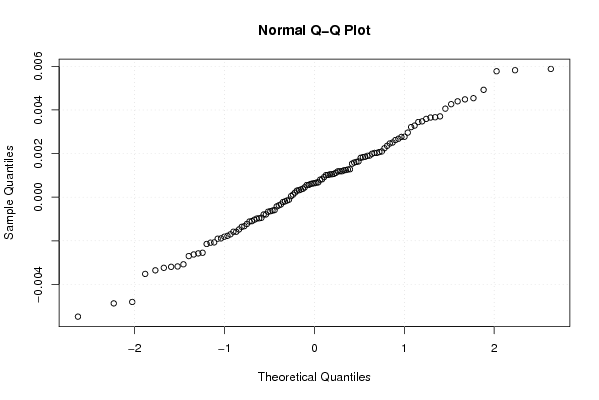
| Title produced by software | Univariate Explorative Data Analysis | ||||||||||||||||||||||||||||||||||||||||||||||||||||
| Date of computation | Fri, 30 Nov 2007 04:02:50 -0700 | ||||||||||||||||||||||||||||||||||||||||||||||||||||
| Cite this page as follows | Statistical Computations at FreeStatistics.org, Office for Research Development and Education, URL https://freestatistics.org/blog/index.php?v=date/2007/Nov/30/t11964199631jp0ckee1sjkpvi.htm/, Retrieved Fri, 11 Jul 2025 19:42:52 +0000 | ||||||||||||||||||||||||||||||||||||||||||||||||||||
| Statistical Computations at FreeStatistics.org, Office for Research Development and Education, URL https://freestatistics.org/blog/index.php?pk=7643, Retrieved Fri, 11 Jul 2025 19:42:52 +0000 | |||||||||||||||||||||||||||||||||||||||||||||||||||||
| QR Codes: | |||||||||||||||||||||||||||||||||||||||||||||||||||||
|
| |||||||||||||||||||||||||||||||||||||||||||||||||||||
| Original text written by user: | |||||||||||||||||||||||||||||||||||||||||||||||||||||
| IsPrivate? | No (this computation is public) | ||||||||||||||||||||||||||||||||||||||||||||||||||||
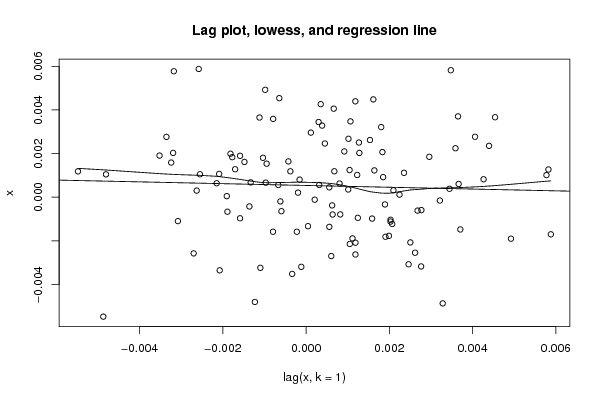
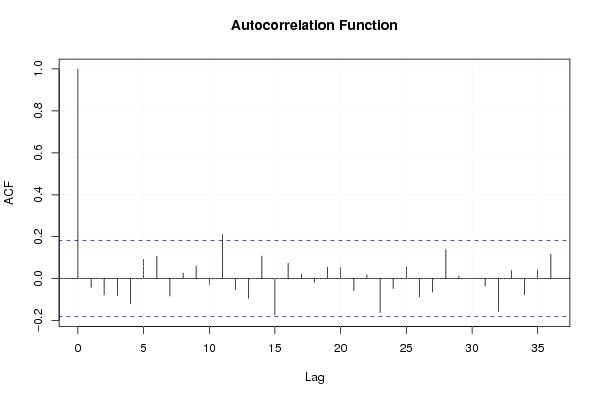
| User-defined keywords | Q4, ARIMA, 4-plot, assumpties | ||||||||||||||||||||||||||||||||||||||||||||||||||||
| Estimated Impact | 291 | ||||||||||||||||||||||||||||||||||||||||||||||||||||
Tree of Dependent Computations | |||||||||||||||||||||||||||||||||||||||||||||||||||||
| Family? (F = Feedback message, R = changed R code, M = changed R Module, P = changed Parameters, D = changed Data) | |||||||||||||||||||||||||||||||||||||||||||||||||||||
| - [Univariate Explorative Data Analysis] [4-plot] [2007-11-30 11:02:50] [bd7b8d7754bcf95ad80b21f541dc6b78] [Current] | |||||||||||||||||||||||||||||||||||||||||||||||||||||
| Feedback Forum | |||||||||||||||||||||||||||||||||||||||||||||||||||||
Post a new message | |||||||||||||||||||||||||||||||||||||||||||||||||||||
Dataset | |||||||||||||||||||||||||||||||||||||||||||||||||||||
| Dataseries X: | |||||||||||||||||||||||||||||||||||||||||||||||||||||
0.00448570722258807 0.00161627008051144 -0.00148103604695934 0.00370662236561495 0.00365213590849957 -0.00111929007561087 0.00202894670871937 -0.00319537555574839 -0.000115297471801953 0.000207732752387937 -0.000193809964066644 -0.000617502855287235 0.00267917863791114 0.00101870086796636 0.00122816042981585 0.00164007142023998 -0.000425131732519528 -0.00136244733432715 0.000558705725005591 0.000315360633839379 0.00209902605197982 0.000918783548783637 0.00185127411835918 0.00296081256507189 0.000115071804741404 0.00224444271218977 0.00358967265745595 -0.000791569555137633 0.000820898909146944 0.0042654643382554 0.000352135463422806 0.00101319797453202 0.00577618519868283 -0.00317793724831984 0.00276463935659925 -0.00335592071342644 -0.00207518674583269 0.00250587076741912 0.00127015567990493 0.00582329478916602 0.00347779560993236 0.00106706078643245 -0.00208869630491994 0.00118711723817082 0.000678895704500574 -0.00133031152020092 4.66272759626643e-05 -0.00190522951870584 0.00492388039825642 -0.000982094706596713 0.00158700153242671 -0.00324114444069905 -0.00109834861765504 -0.00307957607000311 0.00246280425525008 0.000451168657026153 0.000557078701682656 -0.000667750757797388 -0.00189007898443563 0.00111563541279842 0.00235327038447162 0.00439708454751803 0.00118393590213247 -0.00548126638100145 -0.00487263830895669 0.00328381565008992 0.000385101134086802 0.00344659419526791 0.000301555401043752 -0.00262866719031730 0.00118629498011972 -0.000377642996183579 0.000626204256106537 0.0008049247836587 -0.000155132511933779 0.00321473719305704 0.00180526825813112 -0.00103547278097048 0.00202972923549924 0.00127992120343444 -0.00170430074604714 0.00588152522860069 -0.00257880934823165 -0.00270165345509185 0.000605358855440578 0.00366563922443009 0.0045409959925552 -0.000643791480355452 -0.000592834618556011 0.00277039361546545 0.00405977710356672 0.000665078000940488 -0.000969006282867427 -0.00158668951022226 -0.000794393348260039 0.000638022815746765 -0.00214771844939365 0.00105058419629655 -0.00254981462795891 0.00262015509706327 0.00153553233128507 -0.000947475648852895 0.00124325433079447 0.00104583455268845 -0.00480731405784928 -0.00122987289697014 0.00206882711674461 0.00183460657908581 -0.00177412254735189 0.00199191110992592 -0.00181600070846074 0.00190792404916493 -0.00352131241210541 -0.000333990880691547 0.00189578833611634 -0.00158666313146865 -0.00022224948193303 | |||||||||||||||||||||||||||||||||||||||||||||||||||||
Tables (Output of Computation) | |||||||||||||||||||||||||||||||||||||||||||||||||||||
| |||||||||||||||||||||||||||||||||||||||||||||||||||||
Figures (Output of Computation) | |||||||||||||||||||||||||||||||||||||||||||||||||||||
Input Parameters & R Code | |||||||||||||||||||||||||||||||||||||||||||||||||||||
| Parameters (Session): | |||||||||||||||||||||||||||||||||||||||||||||||||||||
| par1 = 0 ; par2 = 36 ; | |||||||||||||||||||||||||||||||||||||||||||||||||||||
| Parameters (R input): | |||||||||||||||||||||||||||||||||||||||||||||||||||||
| par1 = 0 ; par2 = 36 ; | |||||||||||||||||||||||||||||||||||||||||||||||||||||
| R code (references can be found in the software module): | |||||||||||||||||||||||||||||||||||||||||||||||||||||
par1 <- as.numeric(par1) | |||||||||||||||||||||||||||||||||||||||||||||||||||||