Free Statistics

of Irreproducible Research!

Author's title

Author*Unverified author*
R Software Modulerwasp_autocorrelation.wasp
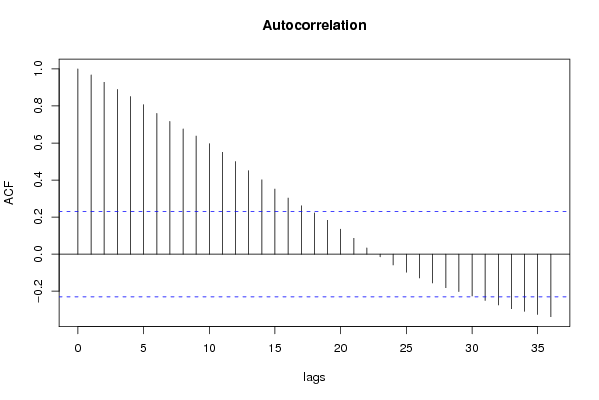
Title produced by software(Partial) Autocorrelation Function
Date of computationFri, 30 Nov 2007 02:36:50 -0700
Cite this page as followsStatistical Computations at FreeStatistics.org, Office for Research Development and Education, URL https://freestatistics.org/blog/index.php?v=date/2007/Nov/30/t1196414781ln5osgs4ulgtnsp.htm/, Retrieved Sun, 28 Apr 2024 00:55:01 +0000
Statistical Computations at FreeStatistics.org, Office for Research Development and Education, URL https://freestatistics.org/blog/index.php?pk=7624, Retrieved Sun, 28 Apr 2024 00:55:01 +0000
QR Codes:

Original text written by user:
IsPrivate?No (this computation is public)
User-defined keywordsautocorrelation dollar
Estimated Impact239
Family? (F = Feedback message, R = changed R code, M = changed R Module, P = changed Parameters, D = changed Data)
-       [(Partial) Autocorrelation Function] [autocorrelation d...] [2007-11-30 09:36:50] [e4c7d76df262b0a2d80dba01c6bb2cb8] [Current]
Feedback Forum

Post a new message
Dataseries X:
0.9383
0.9217
0.9095
0.892
0.8742
0.8532
0.8607
0.9005
0.9111
0.9059
0.8883
0.8924
0.8833
0.87
0.8758
0.8858
0.917
0.9554
0.9922
0.9778
0.9808
0.9811
1.0014
1.0183
1.0622
1.0773
1.0807
1.0848
1.1582
1.1663
1.1372
1.1139
1.1222
1.1692
1.1702
1.2286
1.2613
1.2646
1.2262
1.1985
1.2007
1.2138
1.2266
1.2176
1.2218
1.249
1.2991
1.3408
1.3119
1.3014
1.3201
1.2938
1.2694
1.2165
1.2037
1.2292
1.2256
1.2015
1.1786
1.1856
1.2103
1.1938
1.202
1.2271
1.277
1.265
1.2684
1.2811
1.2727
1.2611
1.2881
1.3213


Summary of compuational transaction
Raw Inputview raw input (R code)
Raw Outputview raw output of R engine
Computing time1 seconds
R Server'Gwilym Jenkins' @ 72.249.127.135

\begin{tabular}{lllllllll}
\hline
Summary of compuational transaction \tabularnewline
Raw Input & view raw input (R code)  \tabularnewline
Raw Output & view raw output of R engine  \tabularnewline
Computing time & 1 seconds \tabularnewline
R Server & 'Gwilym Jenkins' @ 72.249.127.135 \tabularnewline
\hline
\end{tabular}
%Source: https://freestatistics.org/blog/index.php?pk=7624&T=0

[TABLE]
[ROW][C]Summary of compuational transaction[/C][/ROW]
[ROW][C]Raw Input[/C][C]view raw input (R code) [/C][/ROW]
[ROW][C]Raw Output[/C][C]view raw output of R engine [/C][/ROW]
[ROW][C]Computing time[/C][C]1 seconds[/C][/ROW]
[ROW][C]R Server[/C][C]'Gwilym Jenkins' @ 72.249.127.135[/C][/ROW]
[/TABLE]
Source: https://freestatistics.org/blog/index.php?pk=7624&T=0

Globally Unique Identifier (entire table): ba.freestatistics.org/blog/index.php?pk=7624&T=0

As an alternative you can also use a QR Code:  

The GUIDs for individual cells are displayed in the table below:

Summary of compuational transaction
Raw Inputview raw input (R code)
Raw Outputview raw output of R engine
Computing time1 seconds
R Server'Gwilym Jenkins' @ 72.249.127.135


Autocorrelation Function
Time lag kACF(k)T-STATP-value
018.48530
10.9678518.21250
20.927587.87080
30.8894497.54720
40.850937.22040
50.8067446.84540
60.7597996.44710
70.7164576.07930
80.6758235.73460
90.6375765.410
100.5965845.06222e-06
110.5501274.6687e-06
120.4997384.24043.3e-05
130.4505633.82320.000139
140.4012123.40440.000544
150.3515662.98310.001946
160.3032142.57290.006074
170.2609522.21430.014989
180.2222691.8860.031663
190.1829461.55240.062482
200.1346661.14270.128479
210.0854310.72490.235429
220.0335510.28470.388349
23-0.014446-0.12260.548609
24-0.058128-0.49320.688326
25-0.097243-0.82510.79399
26-0.128425-1.08970.860265
27-0.155064-1.31580.903786
28-0.181107-1.53670.935631
29-0.202141-1.71520.954698
30-0.225431-1.91280.970128
31-0.249761-2.11930.981242
32-0.274116-2.32590.988579
33-0.294273-2.4970.992593
34-0.308719-2.61960.994635
35-0.325605-2.76290.996366

\begin{tabular}{lllllllll}
\hline
Autocorrelation Function \tabularnewline
Time lag k & ACF(k) & T-STAT & P-value \tabularnewline
0 & 1 & 8.4853 & 0 \tabularnewline
1 & 0.967851 & 8.2125 & 0 \tabularnewline
2 & 0.92758 & 7.8708 & 0 \tabularnewline
3 & 0.889449 & 7.5472 & 0 \tabularnewline
4 & 0.85093 & 7.2204 & 0 \tabularnewline
5 & 0.806744 & 6.8454 & 0 \tabularnewline
6 & 0.759799 & 6.4471 & 0 \tabularnewline
7 & 0.716457 & 6.0793 & 0 \tabularnewline
8 & 0.675823 & 5.7346 & 0 \tabularnewline
9 & 0.637576 & 5.41 & 0 \tabularnewline
10 & 0.596584 & 5.0622 & 2e-06 \tabularnewline
11 & 0.550127 & 4.668 & 7e-06 \tabularnewline
12 & 0.499738 & 4.2404 & 3.3e-05 \tabularnewline
13 & 0.450563 & 3.8232 & 0.000139 \tabularnewline
14 & 0.401212 & 3.4044 & 0.000544 \tabularnewline
15 & 0.351566 & 2.9831 & 0.001946 \tabularnewline
16 & 0.303214 & 2.5729 & 0.006074 \tabularnewline
17 & 0.260952 & 2.2143 & 0.014989 \tabularnewline
18 & 0.222269 & 1.886 & 0.031663 \tabularnewline
19 & 0.182946 & 1.5524 & 0.062482 \tabularnewline
20 & 0.134666 & 1.1427 & 0.128479 \tabularnewline
21 & 0.085431 & 0.7249 & 0.235429 \tabularnewline
22 & 0.033551 & 0.2847 & 0.388349 \tabularnewline
23 & -0.014446 & -0.1226 & 0.548609 \tabularnewline
24 & -0.058128 & -0.4932 & 0.688326 \tabularnewline
25 & -0.097243 & -0.8251 & 0.79399 \tabularnewline
26 & -0.128425 & -1.0897 & 0.860265 \tabularnewline
27 & -0.155064 & -1.3158 & 0.903786 \tabularnewline
28 & -0.181107 & -1.5367 & 0.935631 \tabularnewline
29 & -0.202141 & -1.7152 & 0.954698 \tabularnewline
30 & -0.225431 & -1.9128 & 0.970128 \tabularnewline
31 & -0.249761 & -2.1193 & 0.981242 \tabularnewline
32 & -0.274116 & -2.3259 & 0.988579 \tabularnewline
33 & -0.294273 & -2.497 & 0.992593 \tabularnewline
34 & -0.308719 & -2.6196 & 0.994635 \tabularnewline
35 & -0.325605 & -2.7629 & 0.996366 \tabularnewline
\hline
\end{tabular}
%Source: https://freestatistics.org/blog/index.php?pk=7624&T=1

[TABLE]
[ROW][C]Autocorrelation Function[/C][/ROW]
[ROW][C]Time lag k[/C][C]ACF(k)[/C][C]T-STAT[/C][C]P-value[/C][/ROW]
[ROW][C]0[/C][C]1[/C][C]8.4853[/C][C]0[/C][/ROW]
[ROW][C]1[/C][C]0.967851[/C][C]8.2125[/C][C]0[/C][/ROW]
[ROW][C]2[/C][C]0.92758[/C][C]7.8708[/C][C]0[/C][/ROW]
[ROW][C]3[/C][C]0.889449[/C][C]7.5472[/C][C]0[/C][/ROW]
[ROW][C]4[/C][C]0.85093[/C][C]7.2204[/C][C]0[/C][/ROW]
[ROW][C]5[/C][C]0.806744[/C][C]6.8454[/C][C]0[/C][/ROW]
[ROW][C]6[/C][C]0.759799[/C][C]6.4471[/C][C]0[/C][/ROW]
[ROW][C]7[/C][C]0.716457[/C][C]6.0793[/C][C]0[/C][/ROW]
[ROW][C]8[/C][C]0.675823[/C][C]5.7346[/C][C]0[/C][/ROW]
[ROW][C]9[/C][C]0.637576[/C][C]5.41[/C][C]0[/C][/ROW]
[ROW][C]10[/C][C]0.596584[/C][C]5.0622[/C][C]2e-06[/C][/ROW]
[ROW][C]11[/C][C]0.550127[/C][C]4.668[/C][C]7e-06[/C][/ROW]
[ROW][C]12[/C][C]0.499738[/C][C]4.2404[/C][C]3.3e-05[/C][/ROW]
[ROW][C]13[/C][C]0.450563[/C][C]3.8232[/C][C]0.000139[/C][/ROW]
[ROW][C]14[/C][C]0.401212[/C][C]3.4044[/C][C]0.000544[/C][/ROW]
[ROW][C]15[/C][C]0.351566[/C][C]2.9831[/C][C]0.001946[/C][/ROW]
[ROW][C]16[/C][C]0.303214[/C][C]2.5729[/C][C]0.006074[/C][/ROW]
[ROW][C]17[/C][C]0.260952[/C][C]2.2143[/C][C]0.014989[/C][/ROW]
[ROW][C]18[/C][C]0.222269[/C][C]1.886[/C][C]0.031663[/C][/ROW]
[ROW][C]19[/C][C]0.182946[/C][C]1.5524[/C][C]0.062482[/C][/ROW]
[ROW][C]20[/C][C]0.134666[/C][C]1.1427[/C][C]0.128479[/C][/ROW]
[ROW][C]21[/C][C]0.085431[/C][C]0.7249[/C][C]0.235429[/C][/ROW]
[ROW][C]22[/C][C]0.033551[/C][C]0.2847[/C][C]0.388349[/C][/ROW]
[ROW][C]23[/C][C]-0.014446[/C][C]-0.1226[/C][C]0.548609[/C][/ROW]
[ROW][C]24[/C][C]-0.058128[/C][C]-0.4932[/C][C]0.688326[/C][/ROW]
[ROW][C]25[/C][C]-0.097243[/C][C]-0.8251[/C][C]0.79399[/C][/ROW]
[ROW][C]26[/C][C]-0.128425[/C][C]-1.0897[/C][C]0.860265[/C][/ROW]
[ROW][C]27[/C][C]-0.155064[/C][C]-1.3158[/C][C]0.903786[/C][/ROW]
[ROW][C]28[/C][C]-0.181107[/C][C]-1.5367[/C][C]0.935631[/C][/ROW]
[ROW][C]29[/C][C]-0.202141[/C][C]-1.7152[/C][C]0.954698[/C][/ROW]
[ROW][C]30[/C][C]-0.225431[/C][C]-1.9128[/C][C]0.970128[/C][/ROW]
[ROW][C]31[/C][C]-0.249761[/C][C]-2.1193[/C][C]0.981242[/C][/ROW]
[ROW][C]32[/C][C]-0.274116[/C][C]-2.3259[/C][C]0.988579[/C][/ROW]
[ROW][C]33[/C][C]-0.294273[/C][C]-2.497[/C][C]0.992593[/C][/ROW]
[ROW][C]34[/C][C]-0.308719[/C][C]-2.6196[/C][C]0.994635[/C][/ROW]
[ROW][C]35[/C][C]-0.325605[/C][C]-2.7629[/C][C]0.996366[/C][/ROW]
[/TABLE]
Source: https://freestatistics.org/blog/index.php?pk=7624&T=1

Globally Unique Identifier (entire table): ba.freestatistics.org/blog/index.php?pk=7624&T=1

As an alternative you can also use a QR Code:  

The GUIDs for individual cells are displayed in the table below:

Autocorrelation Function
Time lag kACF(k)T-STATP-value
018.48530
10.9678518.21250
20.927587.87080
30.8894497.54720
40.850937.22040
50.8067446.84540
60.7597996.44710
70.7164576.07930
80.6758235.73460
90.6375765.410
100.5965845.06222e-06
110.5501274.6687e-06
120.4997384.24043.3e-05
130.4505633.82320.000139
140.4012123.40440.000544
150.3515662.98310.001946
160.3032142.57290.006074
170.2609522.21430.014989
180.2222691.8860.031663
190.1829461.55240.062482
200.1346661.14270.128479
210.0854310.72490.235429
220.0335510.28470.388349
23-0.014446-0.12260.548609
24-0.058128-0.49320.688326
25-0.097243-0.82510.79399
26-0.128425-1.08970.860265
27-0.155064-1.31580.903786
28-0.181107-1.53670.935631
29-0.202141-1.71520.954698
30-0.225431-1.91280.970128
31-0.249761-2.11930.981242
32-0.274116-2.32590.988579
33-0.294273-2.4970.992593
34-0.308719-2.61960.994635
35-0.325605-2.76290.996366


Partial Autocorrelation Function
Time lag kPACF(k)T-STATP-value
00.9678518.21250
1-0.144719-1.2280.888274
20.0295810.2510.401262
3-0.037246-0.3160.623558
4-0.107801-0.91470.818305
5-0.047602-0.40390.656264
60.0332350.2820.389373
70.0020950.01780.492934
80.0181750.15420.438933
9-0.070324-0.59670.723717
10-0.110189-0.9350.823538
11-0.088252-0.74880.771804
12-0.011646-0.09880.539221
13-0.037833-0.3210.625438
14-0.013817-0.11720.546502
15-0.003385-0.02870.511417
160.0491740.41730.338866
17-0.01047-0.08880.535272
18-0.054137-0.45940.676322
19-0.184251-1.56340.938831
20-0.034048-0.28890.613259
21-0.106073-0.90010.814456
220.0465890.39530.346889
230.0456010.38690.349971
240.0488520.41450.339862
250.0681810.57850.282353
26-0.020015-0.16980.567191
27-0.093893-0.79670.785879
280.0396840.33670.36865
29-0.09864-0.8370.797316
30-0.006829-0.05790.523025
31-0.008868-0.07520.529886
320.0594520.50450.307738
330.0506810.430.334225
34-0.100053-0.8490.800646
350.0009880.00840.496667

\begin{tabular}{lllllllll}
\hline
Partial Autocorrelation Function \tabularnewline
Time lag k & PACF(k) & T-STAT & P-value \tabularnewline
0 & 0.967851 & 8.2125 & 0 \tabularnewline
1 & -0.144719 & -1.228 & 0.888274 \tabularnewline
2 & 0.029581 & 0.251 & 0.401262 \tabularnewline
3 & -0.037246 & -0.316 & 0.623558 \tabularnewline
4 & -0.107801 & -0.9147 & 0.818305 \tabularnewline
5 & -0.047602 & -0.4039 & 0.656264 \tabularnewline
6 & 0.033235 & 0.282 & 0.389373 \tabularnewline
7 & 0.002095 & 0.0178 & 0.492934 \tabularnewline
8 & 0.018175 & 0.1542 & 0.438933 \tabularnewline
9 & -0.070324 & -0.5967 & 0.723717 \tabularnewline
10 & -0.110189 & -0.935 & 0.823538 \tabularnewline
11 & -0.088252 & -0.7488 & 0.771804 \tabularnewline
12 & -0.011646 & -0.0988 & 0.539221 \tabularnewline
13 & -0.037833 & -0.321 & 0.625438 \tabularnewline
14 & -0.013817 & -0.1172 & 0.546502 \tabularnewline
15 & -0.003385 & -0.0287 & 0.511417 \tabularnewline
16 & 0.049174 & 0.4173 & 0.338866 \tabularnewline
17 & -0.01047 & -0.0888 & 0.535272 \tabularnewline
18 & -0.054137 & -0.4594 & 0.676322 \tabularnewline
19 & -0.184251 & -1.5634 & 0.938831 \tabularnewline
20 & -0.034048 & -0.2889 & 0.613259 \tabularnewline
21 & -0.106073 & -0.9001 & 0.814456 \tabularnewline
22 & 0.046589 & 0.3953 & 0.346889 \tabularnewline
23 & 0.045601 & 0.3869 & 0.349971 \tabularnewline
24 & 0.048852 & 0.4145 & 0.339862 \tabularnewline
25 & 0.068181 & 0.5785 & 0.282353 \tabularnewline
26 & -0.020015 & -0.1698 & 0.567191 \tabularnewline
27 & -0.093893 & -0.7967 & 0.785879 \tabularnewline
28 & 0.039684 & 0.3367 & 0.36865 \tabularnewline
29 & -0.09864 & -0.837 & 0.797316 \tabularnewline
30 & -0.006829 & -0.0579 & 0.523025 \tabularnewline
31 & -0.008868 & -0.0752 & 0.529886 \tabularnewline
32 & 0.059452 & 0.5045 & 0.307738 \tabularnewline
33 & 0.050681 & 0.43 & 0.334225 \tabularnewline
34 & -0.100053 & -0.849 & 0.800646 \tabularnewline
35 & 0.000988 & 0.0084 & 0.496667 \tabularnewline
\hline
\end{tabular}
%Source: https://freestatistics.org/blog/index.php?pk=7624&T=2

[TABLE]
[ROW][C]Partial Autocorrelation Function[/C][/ROW]
[ROW][C]Time lag k[/C][C]PACF(k)[/C][C]T-STAT[/C][C]P-value[/C][/ROW]
[ROW][C]0[/C][C]0.967851[/C][C]8.2125[/C][C]0[/C][/ROW]
[ROW][C]1[/C][C]-0.144719[/C][C]-1.228[/C][C]0.888274[/C][/ROW]
[ROW][C]2[/C][C]0.029581[/C][C]0.251[/C][C]0.401262[/C][/ROW]
[ROW][C]3[/C][C]-0.037246[/C][C]-0.316[/C][C]0.623558[/C][/ROW]
[ROW][C]4[/C][C]-0.107801[/C][C]-0.9147[/C][C]0.818305[/C][/ROW]
[ROW][C]5[/C][C]-0.047602[/C][C]-0.4039[/C][C]0.656264[/C][/ROW]
[ROW][C]6[/C][C]0.033235[/C][C]0.282[/C][C]0.389373[/C][/ROW]
[ROW][C]7[/C][C]0.002095[/C][C]0.0178[/C][C]0.492934[/C][/ROW]
[ROW][C]8[/C][C]0.018175[/C][C]0.1542[/C][C]0.438933[/C][/ROW]
[ROW][C]9[/C][C]-0.070324[/C][C]-0.5967[/C][C]0.723717[/C][/ROW]
[ROW][C]10[/C][C]-0.110189[/C][C]-0.935[/C][C]0.823538[/C][/ROW]
[ROW][C]11[/C][C]-0.088252[/C][C]-0.7488[/C][C]0.771804[/C][/ROW]
[ROW][C]12[/C][C]-0.011646[/C][C]-0.0988[/C][C]0.539221[/C][/ROW]
[ROW][C]13[/C][C]-0.037833[/C][C]-0.321[/C][C]0.625438[/C][/ROW]
[ROW][C]14[/C][C]-0.013817[/C][C]-0.1172[/C][C]0.546502[/C][/ROW]
[ROW][C]15[/C][C]-0.003385[/C][C]-0.0287[/C][C]0.511417[/C][/ROW]
[ROW][C]16[/C][C]0.049174[/C][C]0.4173[/C][C]0.338866[/C][/ROW]
[ROW][C]17[/C][C]-0.01047[/C][C]-0.0888[/C][C]0.535272[/C][/ROW]
[ROW][C]18[/C][C]-0.054137[/C][C]-0.4594[/C][C]0.676322[/C][/ROW]
[ROW][C]19[/C][C]-0.184251[/C][C]-1.5634[/C][C]0.938831[/C][/ROW]
[ROW][C]20[/C][C]-0.034048[/C][C]-0.2889[/C][C]0.613259[/C][/ROW]
[ROW][C]21[/C][C]-0.106073[/C][C]-0.9001[/C][C]0.814456[/C][/ROW]
[ROW][C]22[/C][C]0.046589[/C][C]0.3953[/C][C]0.346889[/C][/ROW]
[ROW][C]23[/C][C]0.045601[/C][C]0.3869[/C][C]0.349971[/C][/ROW]
[ROW][C]24[/C][C]0.048852[/C][C]0.4145[/C][C]0.339862[/C][/ROW]
[ROW][C]25[/C][C]0.068181[/C][C]0.5785[/C][C]0.282353[/C][/ROW]
[ROW][C]26[/C][C]-0.020015[/C][C]-0.1698[/C][C]0.567191[/C][/ROW]
[ROW][C]27[/C][C]-0.093893[/C][C]-0.7967[/C][C]0.785879[/C][/ROW]
[ROW][C]28[/C][C]0.039684[/C][C]0.3367[/C][C]0.36865[/C][/ROW]
[ROW][C]29[/C][C]-0.09864[/C][C]-0.837[/C][C]0.797316[/C][/ROW]
[ROW][C]30[/C][C]-0.006829[/C][C]-0.0579[/C][C]0.523025[/C][/ROW]
[ROW][C]31[/C][C]-0.008868[/C][C]-0.0752[/C][C]0.529886[/C][/ROW]
[ROW][C]32[/C][C]0.059452[/C][C]0.5045[/C][C]0.307738[/C][/ROW]
[ROW][C]33[/C][C]0.050681[/C][C]0.43[/C][C]0.334225[/C][/ROW]
[ROW][C]34[/C][C]-0.100053[/C][C]-0.849[/C][C]0.800646[/C][/ROW]
[ROW][C]35[/C][C]0.000988[/C][C]0.0084[/C][C]0.496667[/C][/ROW]
[/TABLE]
Source: https://freestatistics.org/blog/index.php?pk=7624&T=2

Globally Unique Identifier (entire table): ba.freestatistics.org/blog/index.php?pk=7624&T=2

As an alternative you can also use a QR Code:  

The GUIDs for individual cells are displayed in the table below:

Partial Autocorrelation Function
Time lag kPACF(k)T-STATP-value
00.9678518.21250
1-0.144719-1.2280.888274
20.0295810.2510.401262
3-0.037246-0.3160.623558
4-0.107801-0.91470.818305
5-0.047602-0.40390.656264
60.0332350.2820.389373
70.0020950.01780.492934
80.0181750.15420.438933
9-0.070324-0.59670.723717
10-0.110189-0.9350.823538
11-0.088252-0.74880.771804
12-0.011646-0.09880.539221
13-0.037833-0.3210.625438
14-0.013817-0.11720.546502
15-0.003385-0.02870.511417
160.0491740.41730.338866
17-0.01047-0.08880.535272
18-0.054137-0.45940.676322
19-0.184251-1.56340.938831
20-0.034048-0.28890.613259
21-0.106073-0.90010.814456
220.0465890.39530.346889
230.0456010.38690.349971
240.0488520.41450.339862
250.0681810.57850.282353
26-0.020015-0.16980.567191
27-0.093893-0.79670.785879
280.0396840.33670.36865
29-0.09864-0.8370.797316
30-0.006829-0.05790.523025
31-0.008868-0.07520.529886
320.0594520.50450.307738
330.0506810.430.334225
34-0.100053-0.8490.800646
350.0009880.00840.496667


Parameters (Session):
par1 = 36 ; par2 = 0.0 ; par3 = 0 ; par4 = 0 ; par5 = 12 ;
Parameters (R input):
par1 = 36 ; par2 = 0.0 ; par3 = 0 ; par4 = 0 ; par5 = 12 ;
R code (references can be found in the software module):
if (par1 == 'Default') {
par1 = 10*log10(length(x))
} else {
par1 <- as.numeric(par1)
}
par2 <- as.numeric(par2)
par3 <- as.numeric(par3)
par4 <- as.numeric(par4)
par5 <- as.numeric(par5)
if (par2 == 0) {
x <- log(x)
} else {
x <- (x ^ par2 - 1) / par2
}
if (par3 > 0) x <- diff(x,lag=1,difference=par3)
if (par4 > 0) x <- diff(x,lag=par5,difference=par4)
bitmap(file='pic1.png')
racf <- acf(x,par1,main='Autocorrelation',xlab='lags',ylab='ACF')
dev.off()
bitmap(file='pic2.png')
rpacf <- pacf(x,par1,main='Partial Autocorrelation',xlab='lags',ylab='PACF')
dev.off()
(myacf <- c(racf$acf))
(mypacf <- c(rpacf$acf))
lengthx <- length(x)
sqrtn <- sqrt(lengthx)
load(file='createtable')
a<-table.start()
a<-table.row.start(a)
a<-table.element(a,'Autocorrelation Function',4,TRUE)
a<-table.row.end(a)
a<-table.row.start(a)
a<-table.element(a,'Time lag k',header=TRUE)
a<-table.element(a,hyperlink('basics.htm','ACF(k)','click here for more information about the Autocorrelation Function'),header=TRUE)
a<-table.element(a,'T-STAT',header=TRUE)
a<-table.element(a,'P-value',header=TRUE)
a<-table.row.end(a)
for (i in 1:par1) {
a<-table.row.start(a)
a<-table.element(a,i-1,header=TRUE)
a<-table.element(a,round(myacf[i],6))
mytstat <- myacf[i]*sqrtn
a<-table.element(a,round(mytstat,4))
a<-table.element(a,round(1-pt(mytstat,lengthx),6))
a<-table.row.end(a)
}
a<-table.end(a)
table.save(a,file='mytable.tab')
a<-table.start()
a<-table.row.start(a)
a<-table.element(a,'Partial Autocorrelation Function',4,TRUE)
a<-table.row.end(a)
a<-table.row.start(a)
a<-table.element(a,'Time lag k',header=TRUE)
a<-table.element(a,hyperlink('basics.htm','PACF(k)','click here for more information about the Partial Autocorrelation Function'),header=TRUE)
a<-table.element(a,'T-STAT',header=TRUE)
a<-table.element(a,'P-value',header=TRUE)
a<-table.row.end(a)
for (i in 1:par1) {
a<-table.row.start(a)
a<-table.element(a,i-1,header=TRUE)
a<-table.element(a,round(mypacf[i],6))
mytstat <- mypacf[i]*sqrtn
a<-table.element(a,round(mytstat,4))
a<-table.element(a,round(1-pt(mytstat,lengthx),6))
a<-table.row.end(a)
}
a<-table.end(a)
table.save(a,file='mytable1.tab')