Free Statistics

of Irreproducible Research!

Author's title

Author*Unverified author*
R Software Modulerwasp_cross.wasp
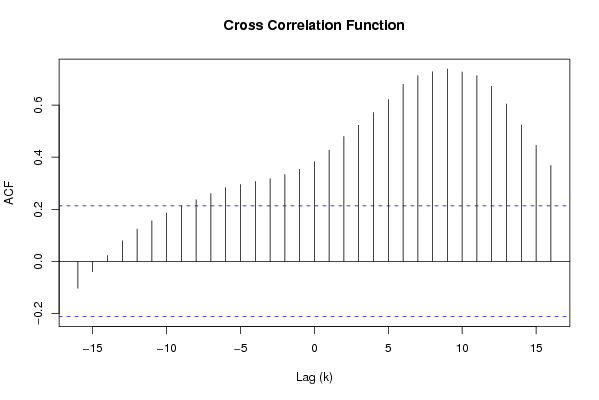
Title produced by softwareCross Correlation Function
Date of computationFri, 30 Nov 2007 01:58:16 -0700
Cite this page as followsStatistical Computations at FreeStatistics.org, Office for Research Development and Education, URL https://freestatistics.org/blog/index.php?v=date/2007/Nov/30/t1196412435ikq4csdt7b9bfa7.htm/, Retrieved Sun, 28 Apr 2024 09:14:05 +0000
Statistical Computations at FreeStatistics.org, Office for Research Development and Education, URL https://freestatistics.org/blog/index.php?pk=7620, Retrieved Sun, 28 Apr 2024 09:14:05 +0000
QR Codes:

Original text written by user:
IsPrivate?No (this computation is public)
User-defined keywords
Estimated Impact246
Family? (F = Feedback message, R = changed R code, M = changed R Module, P = changed Parameters, D = changed Data)
-       [Cross Correlation Function] [cross corr funct] [2007-11-30 08:58:16] [6c82e325b196f1aec5740f38b2795d46] [Current]
Feedback Forum

Post a new message
Dataseries X:
1.5
1.4
1.6
1.6
1.6
1.4
1.7
1.8
1.9
2.2
2.1
2.4
2.6
2.8
2.7
2.6
2.9
2.8
2.2
2.2
2.2
2
2
1.7
1.4
1.3
1.4
1.3
1.3
1.4
2
1.7
1.8
1.7
1.6
1.7
1.9
1.8
1.7
1.6
1.8
1.6
1.5
1.5
1.3
1.4
1.4
1.3
1.3
1.2
1.1
1.4
1.2
1.5
1.1
1.3
1.5
1.1
1.4
1.3
1.5
1.6
1.7
1.1
1.6
1.3
1.7
1.6
1.7
1.9
1.8
1.9
1.6
1.5
1.6
1.6
1.7
2
2
1.9
1.7
1.8
1.9
1.7
2
Dataseries Y:
4.76
4.83
4.81
4.77
4.77
4.77
4.79
4.63
4.53
4.52
4.51
4.06
3.76
3.48
3.35
3.31
3.3
3.3
3.3
3.32
3.34
3.32
3.29
3.29
3.29
3.28
3.02
2.84
2.78
2.63
2.54
2.56
2.19
2.09
2.06
2.08
2.05
2.03
2.04
2.03
2.01
2.01
2.01
2.01
2.01
2.01
2.02
2.02
2.03
2.05
2.08
2.07
2.06
2.05
2.05
2.05
2.05
2.05
2.06
2.06
2.07
2.07
2.3
2.31
2.31
2.53
2.58
2.59
2.73
2.82
3
3.04
3.23
3.32
3.49
3.57
3.56
3.72
3.82
3.82
3.98
4.06
4.08
4.19
4.16


Summary of compuational transaction
Raw Inputview raw input (R code)
Raw Outputview raw output of R engine
Computing time1 seconds
R Server'Gwilym Jenkins' @ 72.249.127.135

\begin{tabular}{lllllllll}
\hline
Summary of compuational transaction \tabularnewline
Raw Input & view raw input (R code)  \tabularnewline
Raw Output & view raw output of R engine  \tabularnewline
Computing time & 1 seconds \tabularnewline
R Server & 'Gwilym Jenkins' @ 72.249.127.135 \tabularnewline
\hline
\end{tabular}
%Source: https://freestatistics.org/blog/index.php?pk=7620&T=0

[TABLE]
[ROW][C]Summary of compuational transaction[/C][/ROW]
[ROW][C]Raw Input[/C][C]view raw input (R code) [/C][/ROW]
[ROW][C]Raw Output[/C][C]view raw output of R engine [/C][/ROW]
[ROW][C]Computing time[/C][C]1 seconds[/C][/ROW]
[ROW][C]R Server[/C][C]'Gwilym Jenkins' @ 72.249.127.135[/C][/ROW]
[/TABLE]
Source: https://freestatistics.org/blog/index.php?pk=7620&T=0

Globally Unique Identifier (entire table): ba.freestatistics.org/blog/index.php?pk=7620&T=0

As an alternative you can also use a QR Code:  

The GUIDs for individual cells are displayed in the table below:

Summary of compuational transaction
Raw Inputview raw input (R code)
Raw Outputview raw output of R engine
Computing time1 seconds
R Server'Gwilym Jenkins' @ 72.249.127.135


Cross Correlation Function
ParameterValue
Box-Cox transformation parameter (lambda) of X series1
Degree of non-seasonal differencing (d) of X series0
Degree of seasonal differencing (D) of X series0
Seasonal Period (s)1
Box-Cox transformation parameter (lambda) of Y series1
Degree of non-seasonal differencing (d) of Y series0
Degree of seasonal differencing (D) of Y series0
krho(Y[t],X[t+k])
-16-0.103149023689939
-15-0.0397485745921663
-140.0227215398331327
-130.0786536445809447
-120.123822733169880
-110.155703770911114
-100.185560093889344
-90.213675154731689
-80.236322406957205
-70.260604905572242
-60.282796476080933
-50.294901671282098
-40.307061176304208
-30.317707446041382
-20.333566342633963
-10.353617139036262
00.382676669983928
10.42673452537029
20.479625166361564
30.522680521970909
40.572213253690524
50.621949461246142
60.680101087152567
70.71332376127551
80.728149169546183
90.739140155664175
100.727670682956115
110.71299432691683
120.672276039749785
130.604336628767357
140.52363515383322
150.445110907542822
160.368321599642034

\begin{tabular}{lllllllll}
\hline
Cross Correlation Function \tabularnewline
Parameter & Value \tabularnewline
Box-Cox transformation parameter (lambda) of X series & 1 \tabularnewline
Degree of non-seasonal differencing (d) of X series & 0 \tabularnewline
Degree of seasonal differencing (D) of X series & 0 \tabularnewline
Seasonal Period (s) & 1 \tabularnewline
Box-Cox transformation parameter (lambda) of Y series & 1 \tabularnewline
Degree of non-seasonal differencing (d) of Y series & 0 \tabularnewline
Degree of seasonal differencing (D) of Y series & 0 \tabularnewline
k & rho(Y[t],X[t+k]) \tabularnewline
-16 & -0.103149023689939 \tabularnewline
-15 & -0.0397485745921663 \tabularnewline
-14 & 0.0227215398331327 \tabularnewline
-13 & 0.0786536445809447 \tabularnewline
-12 & 0.123822733169880 \tabularnewline
-11 & 0.155703770911114 \tabularnewline
-10 & 0.185560093889344 \tabularnewline
-9 & 0.213675154731689 \tabularnewline
-8 & 0.236322406957205 \tabularnewline
-7 & 0.260604905572242 \tabularnewline
-6 & 0.282796476080933 \tabularnewline
-5 & 0.294901671282098 \tabularnewline
-4 & 0.307061176304208 \tabularnewline
-3 & 0.317707446041382 \tabularnewline
-2 & 0.333566342633963 \tabularnewline
-1 & 0.353617139036262 \tabularnewline
0 & 0.382676669983928 \tabularnewline
1 & 0.42673452537029 \tabularnewline
2 & 0.479625166361564 \tabularnewline
3 & 0.522680521970909 \tabularnewline
4 & 0.572213253690524 \tabularnewline
5 & 0.621949461246142 \tabularnewline
6 & 0.680101087152567 \tabularnewline
7 & 0.71332376127551 \tabularnewline
8 & 0.728149169546183 \tabularnewline
9 & 0.739140155664175 \tabularnewline
10 & 0.727670682956115 \tabularnewline
11 & 0.71299432691683 \tabularnewline
12 & 0.672276039749785 \tabularnewline
13 & 0.604336628767357 \tabularnewline
14 & 0.52363515383322 \tabularnewline
15 & 0.445110907542822 \tabularnewline
16 & 0.368321599642034 \tabularnewline
\hline
\end{tabular}
%Source: https://freestatistics.org/blog/index.php?pk=7620&T=1

[TABLE]
[ROW][C]Cross Correlation Function[/C][/ROW]
[ROW][C]Parameter[/C][C]Value[/C][/ROW]
[ROW][C]Box-Cox transformation parameter (lambda) of X series[/C][C]1[/C][/ROW]
[ROW][C]Degree of non-seasonal differencing (d) of X series[/C][C]0[/C][/ROW]
[ROW][C]Degree of seasonal differencing (D) of X series[/C][C]0[/C][/ROW]
[ROW][C]Seasonal Period (s)[/C][C]1[/C][/ROW]
[ROW][C]Box-Cox transformation parameter (lambda) of Y series[/C][C]1[/C][/ROW]
[ROW][C]Degree of non-seasonal differencing (d) of Y series[/C][C]0[/C][/ROW]
[ROW][C]Degree of seasonal differencing (D) of Y series[/C][C]0[/C][/ROW]
[ROW][C]k[/C][C]rho(Y[t],X[t+k])[/C][/ROW]
[ROW][C]-16[/C][C]-0.103149023689939[/C][/ROW]
[ROW][C]-15[/C][C]-0.0397485745921663[/C][/ROW]
[ROW][C]-14[/C][C]0.0227215398331327[/C][/ROW]
[ROW][C]-13[/C][C]0.0786536445809447[/C][/ROW]
[ROW][C]-12[/C][C]0.123822733169880[/C][/ROW]
[ROW][C]-11[/C][C]0.155703770911114[/C][/ROW]
[ROW][C]-10[/C][C]0.185560093889344[/C][/ROW]
[ROW][C]-9[/C][C]0.213675154731689[/C][/ROW]
[ROW][C]-8[/C][C]0.236322406957205[/C][/ROW]
[ROW][C]-7[/C][C]0.260604905572242[/C][/ROW]
[ROW][C]-6[/C][C]0.282796476080933[/C][/ROW]
[ROW][C]-5[/C][C]0.294901671282098[/C][/ROW]
[ROW][C]-4[/C][C]0.307061176304208[/C][/ROW]
[ROW][C]-3[/C][C]0.317707446041382[/C][/ROW]
[ROW][C]-2[/C][C]0.333566342633963[/C][/ROW]
[ROW][C]-1[/C][C]0.353617139036262[/C][/ROW]
[ROW][C]0[/C][C]0.382676669983928[/C][/ROW]
[ROW][C]1[/C][C]0.42673452537029[/C][/ROW]
[ROW][C]2[/C][C]0.479625166361564[/C][/ROW]
[ROW][C]3[/C][C]0.522680521970909[/C][/ROW]
[ROW][C]4[/C][C]0.572213253690524[/C][/ROW]
[ROW][C]5[/C][C]0.621949461246142[/C][/ROW]
[ROW][C]6[/C][C]0.680101087152567[/C][/ROW]
[ROW][C]7[/C][C]0.71332376127551[/C][/ROW]
[ROW][C]8[/C][C]0.728149169546183[/C][/ROW]
[ROW][C]9[/C][C]0.739140155664175[/C][/ROW]
[ROW][C]10[/C][C]0.727670682956115[/C][/ROW]
[ROW][C]11[/C][C]0.71299432691683[/C][/ROW]
[ROW][C]12[/C][C]0.672276039749785[/C][/ROW]
[ROW][C]13[/C][C]0.604336628767357[/C][/ROW]
[ROW][C]14[/C][C]0.52363515383322[/C][/ROW]
[ROW][C]15[/C][C]0.445110907542822[/C][/ROW]
[ROW][C]16[/C][C]0.368321599642034[/C][/ROW]
[/TABLE]
Source: https://freestatistics.org/blog/index.php?pk=7620&T=1

Globally Unique Identifier (entire table): ba.freestatistics.org/blog/index.php?pk=7620&T=1

As an alternative you can also use a QR Code:  

The GUIDs for individual cells are displayed in the table below:

Cross Correlation Function
ParameterValue
Box-Cox transformation parameter (lambda) of X series1
Degree of non-seasonal differencing (d) of X series0
Degree of seasonal differencing (D) of X series0
Seasonal Period (s)1
Box-Cox transformation parameter (lambda) of Y series1
Degree of non-seasonal differencing (d) of Y series0
Degree of seasonal differencing (D) of Y series0
krho(Y[t],X[t+k])
-16-0.103149023689939
-15-0.0397485745921663
-140.0227215398331327
-130.0786536445809447
-120.123822733169880
-110.155703770911114
-100.185560093889344
-90.213675154731689
-80.236322406957205
-70.260604905572242
-60.282796476080933
-50.294901671282098
-40.307061176304208
-30.317707446041382
-20.333566342633963
-10.353617139036262
00.382676669983928
10.42673452537029
20.479625166361564
30.522680521970909
40.572213253690524
50.621949461246142
60.680101087152567
70.71332376127551
80.728149169546183
90.739140155664175
100.727670682956115
110.71299432691683
120.672276039749785
130.604336628767357
140.52363515383322
150.445110907542822
160.368321599642034


Parameters (Session):
par1 = 1 ; par2 = 0 ; par3 = 0 ; par4 = 1 ; par5 = 1 ; par6 = 0 ; par7 = 0 ;
Parameters (R input):
par1 = 1 ; par2 = 0 ; par3 = 0 ; par4 = 1 ; par5 = 1 ; par6 = 0 ; par7 = 0 ;
R code (references can be found in the software module):
par1 <- as.numeric(par1)
par2 <- as.numeric(par2)
par3 <- as.numeric(par3)
par4 <- as.numeric(par4)
par5 <- as.numeric(par5)
par6 <- as.numeric(par6)
par7 <- as.numeric(par7)
if (par1 == 0) {
x <- log(x)
} else {
x <- (x ^ par1 - 1) / par1
}
if (par5 == 0) {
y <- log(y)
} else {
y <- (y ^ par5 - 1) / par5
}
if (par2 > 0) x <- diff(x,lag=1,difference=par2)
if (par6 > 0) y <- diff(y,lag=1,difference=par6)
if (par3 > 0) x <- diff(x,lag=par4,difference=par3)
if (par7 > 0) x <- diff(y,lag=par4,difference=par7)
x
y
bitmap(file='test1.png')
(r <- ccf(x,y,main='Cross Correlation Function',xlab='Lag (k)'))
dev.off()
load(file='createtable')
a<-table.start()
a<-table.row.start(a)
a<-table.element(a,'Cross Correlation Function',2,TRUE)
a<-table.row.end(a)
a<-table.row.start(a)
a<-table.element(a,'Parameter',header=TRUE)
a<-table.element(a,'Value',header=TRUE)
a<-table.row.end(a)
a<-table.row.start(a)
a<-table.element(a,'Box-Cox transformation parameter (lambda) of X series',header=TRUE)
a<-table.element(a,par1)
a<-table.row.end(a)
a<-table.row.start(a)
a<-table.element(a,'Degree of non-seasonal differencing (d) of X series',header=TRUE)
a<-table.element(a,par2)
a<-table.row.end(a)
a<-table.row.start(a)
a<-table.element(a,'Degree of seasonal differencing (D) of X series',header=TRUE)
a<-table.element(a,par3)
a<-table.row.end(a)
a<-table.row.start(a)
a<-table.element(a,'Seasonal Period (s)',header=TRUE)
a<-table.element(a,par4)
a<-table.row.end(a)
a<-table.row.start(a)
a<-table.element(a,'Box-Cox transformation parameter (lambda) of Y series',header=TRUE)
a<-table.element(a,par5)
a<-table.row.end(a)
a<-table.row.start(a)
a<-table.element(a,'Degree of non-seasonal differencing (d) of Y series',header=TRUE)
a<-table.element(a,par6)
a<-table.row.end(a)
a<-table.row.start(a)
a<-table.element(a,'Degree of seasonal differencing (D) of Y series',header=TRUE)
a<-table.element(a,par7)
a<-table.row.end(a)
a<-table.row.start(a)
a<-table.element(a,'k',header=TRUE)
a<-table.element(a,'rho(Y[t],X[t+k])',header=TRUE)
a<-table.row.end(a)
mylength <- length(r$acf)
myhalf <- floor((mylength-1)/2)
for (i in 1:mylength) {
a<-table.row.start(a)
a<-table.element(a,i-myhalf-1,header=TRUE)
a<-table.element(a,r$acf[i])
a<-table.row.end(a)
}
a<-table.end(a)
table.save(a,file='mytable.tab')