Free Statistics

of Irreproducible Research!

Author's title

Author*Unverified author*
R Software Modulerwasp_autocorrelation.wasp
Title produced by software(Partial) Autocorrelation Function
Date of computationFri, 30 Nov 2007 01:54:38 -0700
Cite this page as followsStatistical Computations at FreeStatistics.org, Office for Research Development and Education, URL https://freestatistics.org/blog/index.php?v=date/2007/Nov/30/t1196412260sjzukvbr9km42k9.htm/, Retrieved Sat, 27 Apr 2024 13:34:37 +0000
Statistical Computations at FreeStatistics.org, Office for Research Development and Education, URL https://freestatistics.org/blog/index.php?pk=7619, Retrieved Sat, 27 Apr 2024 13:34:37 +0000
QR Codes:

Original text written by user:
IsPrivate?No (this computation is public)
User-defined keywordsautocorrelation dollar
Estimated Impact237
Family? (F = Feedback message, R = changed R code, M = changed R Module, P = changed Parameters, D = changed Data)
-       [(Partial) Autocorrelation Function] [autocorrelation d...] [2007-11-30 08:54:38] [e4c7d76df262b0a2d80dba01c6bb2cb8] [Current]
Feedback Forum

Post a new message
Dataseries X:
0.9383
0.9217
0.9095
0.892
0.8742
0.8532
0.8607
0.9005
0.9111
0.9059
0.8883
0.8924
0.8833
0.87
0.8758
0.8858
0.917
0.9554
0.9922
0.9778
0.9808
0.9811
1.0014
1.0183
1.0622
1.0773
1.0807
1.0848
1.1582
1.1663
1.1372
1.1139
1.1222
1.1692
1.1702
1.2286
1.2613
1.2646
1.2262
1.1985
1.2007
1.2138
1.2266
1.2176
1.2218
1.249
1.2991
1.3408
1.3119
1.3014
1.3201
1.2938
1.2694
1.2165
1.2037
1.2292
1.2256
1.2015
1.1786
1.1856
1.2103
1.1938
1.202
1.2271
1.277
1.265
1.2684
1.2811
1.2727
1.2611
1.2881
1.3213


Summary of compuational transaction
Raw Inputview raw input (R code)
Raw Outputview raw output of R engine
Computing time1 seconds
R Server'Gwilym Jenkins' @ 72.249.127.135

\begin{tabular}{lllllllll}
\hline
Summary of compuational transaction \tabularnewline
Raw Input & view raw input (R code)  \tabularnewline
Raw Output & view raw output of R engine  \tabularnewline
Computing time & 1 seconds \tabularnewline
R Server & 'Gwilym Jenkins' @ 72.249.127.135 \tabularnewline
\hline
\end{tabular}
%Source: https://freestatistics.org/blog/index.php?pk=7619&T=0

[TABLE]
[ROW][C]Summary of compuational transaction[/C][/ROW]
[ROW][C]Raw Input[/C][C]view raw input (R code) [/C][/ROW]
[ROW][C]Raw Output[/C][C]view raw output of R engine [/C][/ROW]
[ROW][C]Computing time[/C][C]1 seconds[/C][/ROW]
[ROW][C]R Server[/C][C]'Gwilym Jenkins' @ 72.249.127.135[/C][/ROW]
[/TABLE]
Source: https://freestatistics.org/blog/index.php?pk=7619&T=0

Globally Unique Identifier (entire table): ba.freestatistics.org/blog/index.php?pk=7619&T=0

As an alternative you can also use a QR Code:  

The GUIDs for individual cells are displayed in the table below:

Summary of compuational transaction
Raw Inputview raw input (R code)
Raw Outputview raw output of R engine
Computing time1 seconds
R Server'Gwilym Jenkins' @ 72.249.127.135


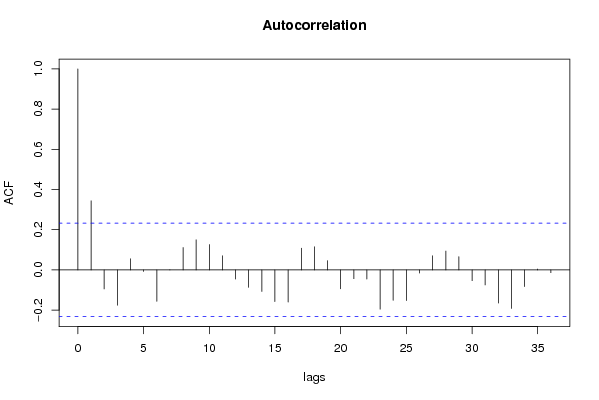
Autocorrelation Function
Time lag kACF(k)T-STATP-value
018.42610
10.3436162.89540.002515
2-0.094715-0.79810.786259
3-0.175819-1.48150.928548
40.0552890.46590.321366
5-0.007435-0.06260.524887
6-0.156075-1.31510.903648
70.0006780.00570.49773
80.1109280.93470.176558
90.1496611.26110.105706
100.1258321.06030.146306
110.0702290.59180.277944
12-0.045382-0.38240.648346
13-0.086769-0.73110.766447
14-0.107295-0.90410.815496
15-0.157479-1.32690.905611
16-0.160103-1.34910.909197
170.1083160.91270.182248
180.1151950.97070.167508
190.0457410.38540.35054
20-0.093903-0.79120.784281
21-0.043852-0.36950.643574
22-0.045821-0.38610.64971
23-0.195752-1.64940.948262
24-0.151584-1.27730.897165
25-0.152833-1.28780.899
26-0.015977-0.13460.553354
270.0704060.59330.277449
280.0936030.78870.216452
290.0659020.55530.290218
30-0.053343-0.44950.672772
31-0.07487-0.63090.734923
32-0.165117-1.39130.915761
33-0.191737-1.61560.944693
34-0.082811-0.69780.756203
350.0039370.03320.486816

\begin{tabular}{lllllllll}
\hline
Autocorrelation Function \tabularnewline
Time lag k & ACF(k) & T-STAT & P-value \tabularnewline
0 & 1 & 8.4261 & 0 \tabularnewline
1 & 0.343616 & 2.8954 & 0.002515 \tabularnewline
2 & -0.094715 & -0.7981 & 0.786259 \tabularnewline
3 & -0.175819 & -1.4815 & 0.928548 \tabularnewline
4 & 0.055289 & 0.4659 & 0.321366 \tabularnewline
5 & -0.007435 & -0.0626 & 0.524887 \tabularnewline
6 & -0.156075 & -1.3151 & 0.903648 \tabularnewline
7 & 0.000678 & 0.0057 & 0.49773 \tabularnewline
8 & 0.110928 & 0.9347 & 0.176558 \tabularnewline
9 & 0.149661 & 1.2611 & 0.105706 \tabularnewline
10 & 0.125832 & 1.0603 & 0.146306 \tabularnewline
11 & 0.070229 & 0.5918 & 0.277944 \tabularnewline
12 & -0.045382 & -0.3824 & 0.648346 \tabularnewline
13 & -0.086769 & -0.7311 & 0.766447 \tabularnewline
14 & -0.107295 & -0.9041 & 0.815496 \tabularnewline
15 & -0.157479 & -1.3269 & 0.905611 \tabularnewline
16 & -0.160103 & -1.3491 & 0.909197 \tabularnewline
17 & 0.108316 & 0.9127 & 0.182248 \tabularnewline
18 & 0.115195 & 0.9707 & 0.167508 \tabularnewline
19 & 0.045741 & 0.3854 & 0.35054 \tabularnewline
20 & -0.093903 & -0.7912 & 0.784281 \tabularnewline
21 & -0.043852 & -0.3695 & 0.643574 \tabularnewline
22 & -0.045821 & -0.3861 & 0.64971 \tabularnewline
23 & -0.195752 & -1.6494 & 0.948262 \tabularnewline
24 & -0.151584 & -1.2773 & 0.897165 \tabularnewline
25 & -0.152833 & -1.2878 & 0.899 \tabularnewline
26 & -0.015977 & -0.1346 & 0.553354 \tabularnewline
27 & 0.070406 & 0.5933 & 0.277449 \tabularnewline
28 & 0.093603 & 0.7887 & 0.216452 \tabularnewline
29 & 0.065902 & 0.5553 & 0.290218 \tabularnewline
30 & -0.053343 & -0.4495 & 0.672772 \tabularnewline
31 & -0.07487 & -0.6309 & 0.734923 \tabularnewline
32 & -0.165117 & -1.3913 & 0.915761 \tabularnewline
33 & -0.191737 & -1.6156 & 0.944693 \tabularnewline
34 & -0.082811 & -0.6978 & 0.756203 \tabularnewline
35 & 0.003937 & 0.0332 & 0.486816 \tabularnewline
\hline
\end{tabular}
%Source: https://freestatistics.org/blog/index.php?pk=7619&T=1

[TABLE]
[ROW][C]Autocorrelation Function[/C][/ROW]
[ROW][C]Time lag k[/C][C]ACF(k)[/C][C]T-STAT[/C][C]P-value[/C][/ROW]
[ROW][C]0[/C][C]1[/C][C]8.4261[/C][C]0[/C][/ROW]
[ROW][C]1[/C][C]0.343616[/C][C]2.8954[/C][C]0.002515[/C][/ROW]
[ROW][C]2[/C][C]-0.094715[/C][C]-0.7981[/C][C]0.786259[/C][/ROW]
[ROW][C]3[/C][C]-0.175819[/C][C]-1.4815[/C][C]0.928548[/C][/ROW]
[ROW][C]4[/C][C]0.055289[/C][C]0.4659[/C][C]0.321366[/C][/ROW]
[ROW][C]5[/C][C]-0.007435[/C][C]-0.0626[/C][C]0.524887[/C][/ROW]
[ROW][C]6[/C][C]-0.156075[/C][C]-1.3151[/C][C]0.903648[/C][/ROW]
[ROW][C]7[/C][C]0.000678[/C][C]0.0057[/C][C]0.49773[/C][/ROW]
[ROW][C]8[/C][C]0.110928[/C][C]0.9347[/C][C]0.176558[/C][/ROW]
[ROW][C]9[/C][C]0.149661[/C][C]1.2611[/C][C]0.105706[/C][/ROW]
[ROW][C]10[/C][C]0.125832[/C][C]1.0603[/C][C]0.146306[/C][/ROW]
[ROW][C]11[/C][C]0.070229[/C][C]0.5918[/C][C]0.277944[/C][/ROW]
[ROW][C]12[/C][C]-0.045382[/C][C]-0.3824[/C][C]0.648346[/C][/ROW]
[ROW][C]13[/C][C]-0.086769[/C][C]-0.7311[/C][C]0.766447[/C][/ROW]
[ROW][C]14[/C][C]-0.107295[/C][C]-0.9041[/C][C]0.815496[/C][/ROW]
[ROW][C]15[/C][C]-0.157479[/C][C]-1.3269[/C][C]0.905611[/C][/ROW]
[ROW][C]16[/C][C]-0.160103[/C][C]-1.3491[/C][C]0.909197[/C][/ROW]
[ROW][C]17[/C][C]0.108316[/C][C]0.9127[/C][C]0.182248[/C][/ROW]
[ROW][C]18[/C][C]0.115195[/C][C]0.9707[/C][C]0.167508[/C][/ROW]
[ROW][C]19[/C][C]0.045741[/C][C]0.3854[/C][C]0.35054[/C][/ROW]
[ROW][C]20[/C][C]-0.093903[/C][C]-0.7912[/C][C]0.784281[/C][/ROW]
[ROW][C]21[/C][C]-0.043852[/C][C]-0.3695[/C][C]0.643574[/C][/ROW]
[ROW][C]22[/C][C]-0.045821[/C][C]-0.3861[/C][C]0.64971[/C][/ROW]
[ROW][C]23[/C][C]-0.195752[/C][C]-1.6494[/C][C]0.948262[/C][/ROW]
[ROW][C]24[/C][C]-0.151584[/C][C]-1.2773[/C][C]0.897165[/C][/ROW]
[ROW][C]25[/C][C]-0.152833[/C][C]-1.2878[/C][C]0.899[/C][/ROW]
[ROW][C]26[/C][C]-0.015977[/C][C]-0.1346[/C][C]0.553354[/C][/ROW]
[ROW][C]27[/C][C]0.070406[/C][C]0.5933[/C][C]0.277449[/C][/ROW]
[ROW][C]28[/C][C]0.093603[/C][C]0.7887[/C][C]0.216452[/C][/ROW]
[ROW][C]29[/C][C]0.065902[/C][C]0.5553[/C][C]0.290218[/C][/ROW]
[ROW][C]30[/C][C]-0.053343[/C][C]-0.4495[/C][C]0.672772[/C][/ROW]
[ROW][C]31[/C][C]-0.07487[/C][C]-0.6309[/C][C]0.734923[/C][/ROW]
[ROW][C]32[/C][C]-0.165117[/C][C]-1.3913[/C][C]0.915761[/C][/ROW]
[ROW][C]33[/C][C]-0.191737[/C][C]-1.6156[/C][C]0.944693[/C][/ROW]
[ROW][C]34[/C][C]-0.082811[/C][C]-0.6978[/C][C]0.756203[/C][/ROW]
[ROW][C]35[/C][C]0.003937[/C][C]0.0332[/C][C]0.486816[/C][/ROW]
[/TABLE]
Source: https://freestatistics.org/blog/index.php?pk=7619&T=1

Globally Unique Identifier (entire table): ba.freestatistics.org/blog/index.php?pk=7619&T=1

As an alternative you can also use a QR Code:  

The GUIDs for individual cells are displayed in the table below:

Autocorrelation Function
Time lag kACF(k)T-STATP-value
018.42610
10.3436162.89540.002515
2-0.094715-0.79810.786259
3-0.175819-1.48150.928548
40.0552890.46590.321366
5-0.007435-0.06260.524887
6-0.156075-1.31510.903648
70.0006780.00570.49773
80.1109280.93470.176558
90.1496611.26110.105706
100.1258321.06030.146306
110.0702290.59180.277944
12-0.045382-0.38240.648346
13-0.086769-0.73110.766447
14-0.107295-0.90410.815496
15-0.157479-1.32690.905611
16-0.160103-1.34910.909197
170.1083160.91270.182248
180.1151950.97070.167508
190.0457410.38540.35054
20-0.093903-0.79120.784281
21-0.043852-0.36950.643574
22-0.045821-0.38610.64971
23-0.195752-1.64940.948262
24-0.151584-1.27730.897165
25-0.152833-1.28780.899
26-0.015977-0.13460.553354
270.0704060.59330.277449
280.0936030.78870.216452
290.0659020.55530.290218
30-0.053343-0.44950.672772
31-0.07487-0.63090.734923
32-0.165117-1.39130.915761
33-0.191737-1.61560.944693
34-0.082811-0.69780.756203
350.0039370.03320.486816


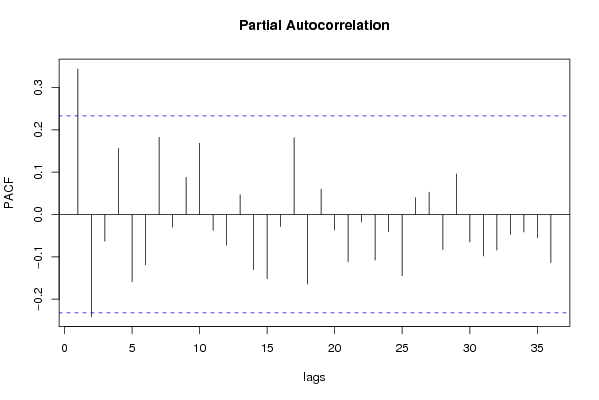
Partial Autocorrelation Function
Time lag kPACF(k)T-STATP-value
00.3436162.89540.002515
1-0.241275-2.0330.977105
2-0.063226-0.53280.702067
30.1559651.31420.096507
4-0.158803-1.33810.907433
5-0.118724-1.00040.83974
60.1823321.53640.064447
7-0.029654-0.24990.598296
80.0876750.73880.231244
90.1682611.41780.080312
10-0.037324-0.31450.622968
11-0.072641-0.61210.728781
120.0466340.39290.347767
13-0.130423-1.0990.862252
14-0.151617-1.27760.897215
15-0.028309-0.23850.593925
160.1812261.5270.065597
17-0.163945-1.38140.91426
180.0596160.50230.308493
19-0.036875-0.31070.621536
20-0.111851-0.94250.825427
21-0.018067-0.15220.560285
22-0.107718-0.90760.816433
23-0.040404-0.34050.63274
24-0.144434-1.2170.886187
250.039530.33310.370026
260.052520.44250.329721
27-0.082592-0.69590.755628
280.095740.80670.21126
29-0.065129-0.54880.707564
30-0.097815-0.82420.793707
31-0.083914-0.70710.759083
32-0.04732-0.39870.654353
33-0.041311-0.34810.635598
34-0.054988-0.46330.677729
35-0.113487-0.95630.828908

\begin{tabular}{lllllllll}
\hline
Partial Autocorrelation Function \tabularnewline
Time lag k & PACF(k) & T-STAT & P-value \tabularnewline
0 & 0.343616 & 2.8954 & 0.002515 \tabularnewline
1 & -0.241275 & -2.033 & 0.977105 \tabularnewline
2 & -0.063226 & -0.5328 & 0.702067 \tabularnewline
3 & 0.155965 & 1.3142 & 0.096507 \tabularnewline
4 & -0.158803 & -1.3381 & 0.907433 \tabularnewline
5 & -0.118724 & -1.0004 & 0.83974 \tabularnewline
6 & 0.182332 & 1.5364 & 0.064447 \tabularnewline
7 & -0.029654 & -0.2499 & 0.598296 \tabularnewline
8 & 0.087675 & 0.7388 & 0.231244 \tabularnewline
9 & 0.168261 & 1.4178 & 0.080312 \tabularnewline
10 & -0.037324 & -0.3145 & 0.622968 \tabularnewline
11 & -0.072641 & -0.6121 & 0.728781 \tabularnewline
12 & 0.046634 & 0.3929 & 0.347767 \tabularnewline
13 & -0.130423 & -1.099 & 0.862252 \tabularnewline
14 & -0.151617 & -1.2776 & 0.897215 \tabularnewline
15 & -0.028309 & -0.2385 & 0.593925 \tabularnewline
16 & 0.181226 & 1.527 & 0.065597 \tabularnewline
17 & -0.163945 & -1.3814 & 0.91426 \tabularnewline
18 & 0.059616 & 0.5023 & 0.308493 \tabularnewline
19 & -0.036875 & -0.3107 & 0.621536 \tabularnewline
20 & -0.111851 & -0.9425 & 0.825427 \tabularnewline
21 & -0.018067 & -0.1522 & 0.560285 \tabularnewline
22 & -0.107718 & -0.9076 & 0.816433 \tabularnewline
23 & -0.040404 & -0.3405 & 0.63274 \tabularnewline
24 & -0.144434 & -1.217 & 0.886187 \tabularnewline
25 & 0.03953 & 0.3331 & 0.370026 \tabularnewline
26 & 0.05252 & 0.4425 & 0.329721 \tabularnewline
27 & -0.082592 & -0.6959 & 0.755628 \tabularnewline
28 & 0.09574 & 0.8067 & 0.21126 \tabularnewline
29 & -0.065129 & -0.5488 & 0.707564 \tabularnewline
30 & -0.097815 & -0.8242 & 0.793707 \tabularnewline
31 & -0.083914 & -0.7071 & 0.759083 \tabularnewline
32 & -0.04732 & -0.3987 & 0.654353 \tabularnewline
33 & -0.041311 & -0.3481 & 0.635598 \tabularnewline
34 & -0.054988 & -0.4633 & 0.677729 \tabularnewline
35 & -0.113487 & -0.9563 & 0.828908 \tabularnewline
\hline
\end{tabular}
%Source: https://freestatistics.org/blog/index.php?pk=7619&T=2

[TABLE]
[ROW][C]Partial Autocorrelation Function[/C][/ROW]
[ROW][C]Time lag k[/C][C]PACF(k)[/C][C]T-STAT[/C][C]P-value[/C][/ROW]
[ROW][C]0[/C][C]0.343616[/C][C]2.8954[/C][C]0.002515[/C][/ROW]
[ROW][C]1[/C][C]-0.241275[/C][C]-2.033[/C][C]0.977105[/C][/ROW]
[ROW][C]2[/C][C]-0.063226[/C][C]-0.5328[/C][C]0.702067[/C][/ROW]
[ROW][C]3[/C][C]0.155965[/C][C]1.3142[/C][C]0.096507[/C][/ROW]
[ROW][C]4[/C][C]-0.158803[/C][C]-1.3381[/C][C]0.907433[/C][/ROW]
[ROW][C]5[/C][C]-0.118724[/C][C]-1.0004[/C][C]0.83974[/C][/ROW]
[ROW][C]6[/C][C]0.182332[/C][C]1.5364[/C][C]0.064447[/C][/ROW]
[ROW][C]7[/C][C]-0.029654[/C][C]-0.2499[/C][C]0.598296[/C][/ROW]
[ROW][C]8[/C][C]0.087675[/C][C]0.7388[/C][C]0.231244[/C][/ROW]
[ROW][C]9[/C][C]0.168261[/C][C]1.4178[/C][C]0.080312[/C][/ROW]
[ROW][C]10[/C][C]-0.037324[/C][C]-0.3145[/C][C]0.622968[/C][/ROW]
[ROW][C]11[/C][C]-0.072641[/C][C]-0.6121[/C][C]0.728781[/C][/ROW]
[ROW][C]12[/C][C]0.046634[/C][C]0.3929[/C][C]0.347767[/C][/ROW]
[ROW][C]13[/C][C]-0.130423[/C][C]-1.099[/C][C]0.862252[/C][/ROW]
[ROW][C]14[/C][C]-0.151617[/C][C]-1.2776[/C][C]0.897215[/C][/ROW]
[ROW][C]15[/C][C]-0.028309[/C][C]-0.2385[/C][C]0.593925[/C][/ROW]
[ROW][C]16[/C][C]0.181226[/C][C]1.527[/C][C]0.065597[/C][/ROW]
[ROW][C]17[/C][C]-0.163945[/C][C]-1.3814[/C][C]0.91426[/C][/ROW]
[ROW][C]18[/C][C]0.059616[/C][C]0.5023[/C][C]0.308493[/C][/ROW]
[ROW][C]19[/C][C]-0.036875[/C][C]-0.3107[/C][C]0.621536[/C][/ROW]
[ROW][C]20[/C][C]-0.111851[/C][C]-0.9425[/C][C]0.825427[/C][/ROW]
[ROW][C]21[/C][C]-0.018067[/C][C]-0.1522[/C][C]0.560285[/C][/ROW]
[ROW][C]22[/C][C]-0.107718[/C][C]-0.9076[/C][C]0.816433[/C][/ROW]
[ROW][C]23[/C][C]-0.040404[/C][C]-0.3405[/C][C]0.63274[/C][/ROW]
[ROW][C]24[/C][C]-0.144434[/C][C]-1.217[/C][C]0.886187[/C][/ROW]
[ROW][C]25[/C][C]0.03953[/C][C]0.3331[/C][C]0.370026[/C][/ROW]
[ROW][C]26[/C][C]0.05252[/C][C]0.4425[/C][C]0.329721[/C][/ROW]
[ROW][C]27[/C][C]-0.082592[/C][C]-0.6959[/C][C]0.755628[/C][/ROW]
[ROW][C]28[/C][C]0.09574[/C][C]0.8067[/C][C]0.21126[/C][/ROW]
[ROW][C]29[/C][C]-0.065129[/C][C]-0.5488[/C][C]0.707564[/C][/ROW]
[ROW][C]30[/C][C]-0.097815[/C][C]-0.8242[/C][C]0.793707[/C][/ROW]
[ROW][C]31[/C][C]-0.083914[/C][C]-0.7071[/C][C]0.759083[/C][/ROW]
[ROW][C]32[/C][C]-0.04732[/C][C]-0.3987[/C][C]0.654353[/C][/ROW]
[ROW][C]33[/C][C]-0.041311[/C][C]-0.3481[/C][C]0.635598[/C][/ROW]
[ROW][C]34[/C][C]-0.054988[/C][C]-0.4633[/C][C]0.677729[/C][/ROW]
[ROW][C]35[/C][C]-0.113487[/C][C]-0.9563[/C][C]0.828908[/C][/ROW]
[/TABLE]
Source: https://freestatistics.org/blog/index.php?pk=7619&T=2

Globally Unique Identifier (entire table): ba.freestatistics.org/blog/index.php?pk=7619&T=2

As an alternative you can also use a QR Code:  

The GUIDs for individual cells are displayed in the table below:

Partial Autocorrelation Function
Time lag kPACF(k)T-STATP-value
00.3436162.89540.002515
1-0.241275-2.0330.977105
2-0.063226-0.53280.702067
30.1559651.31420.096507
4-0.158803-1.33810.907433
5-0.118724-1.00040.83974
60.1823321.53640.064447
7-0.029654-0.24990.598296
80.0876750.73880.231244
90.1682611.41780.080312
10-0.037324-0.31450.622968
11-0.072641-0.61210.728781
120.0466340.39290.347767
13-0.130423-1.0990.862252
14-0.151617-1.27760.897215
15-0.028309-0.23850.593925
160.1812261.5270.065597
17-0.163945-1.38140.91426
180.0596160.50230.308493
19-0.036875-0.31070.621536
20-0.111851-0.94250.825427
21-0.018067-0.15220.560285
22-0.107718-0.90760.816433
23-0.040404-0.34050.63274
24-0.144434-1.2170.886187
250.039530.33310.370026
260.052520.44250.329721
27-0.082592-0.69590.755628
280.095740.80670.21126
29-0.065129-0.54880.707564
30-0.097815-0.82420.793707
31-0.083914-0.70710.759083
32-0.04732-0.39870.654353
33-0.041311-0.34810.635598
34-0.054988-0.46330.677729
35-0.113487-0.95630.828908


Parameters (Session):
par1 = 36 ; par2 = 0.0 ; par3 = 1 ; par4 = 0 ; par5 = 12 ;
Parameters (R input):
par1 = 36 ; par2 = 0.0 ; par3 = 1 ; par4 = 0 ; par5 = 12 ;
R code (references can be found in the software module):
if (par1 == 'Default') {
par1 = 10*log10(length(x))
} else {
par1 <- as.numeric(par1)
}
par2 <- as.numeric(par2)
par3 <- as.numeric(par3)
par4 <- as.numeric(par4)
par5 <- as.numeric(par5)
if (par2 == 0) {
x <- log(x)
} else {
x <- (x ^ par2 - 1) / par2
}
if (par3 > 0) x <- diff(x,lag=1,difference=par3)
if (par4 > 0) x <- diff(x,lag=par5,difference=par4)
bitmap(file='pic1.png')
racf <- acf(x,par1,main='Autocorrelation',xlab='lags',ylab='ACF')
dev.off()
bitmap(file='pic2.png')
rpacf <- pacf(x,par1,main='Partial Autocorrelation',xlab='lags',ylab='PACF')
dev.off()
(myacf <- c(racf$acf))
(mypacf <- c(rpacf$acf))
lengthx <- length(x)
sqrtn <- sqrt(lengthx)
load(file='createtable')
a<-table.start()
a<-table.row.start(a)
a<-table.element(a,'Autocorrelation Function',4,TRUE)
a<-table.row.end(a)
a<-table.row.start(a)
a<-table.element(a,'Time lag k',header=TRUE)
a<-table.element(a,hyperlink('basics.htm','ACF(k)','click here for more information about the Autocorrelation Function'),header=TRUE)
a<-table.element(a,'T-STAT',header=TRUE)
a<-table.element(a,'P-value',header=TRUE)
a<-table.row.end(a)
for (i in 1:par1) {
a<-table.row.start(a)
a<-table.element(a,i-1,header=TRUE)
a<-table.element(a,round(myacf[i],6))
mytstat <- myacf[i]*sqrtn
a<-table.element(a,round(mytstat,4))
a<-table.element(a,round(1-pt(mytstat,lengthx),6))
a<-table.row.end(a)
}
a<-table.end(a)
table.save(a,file='mytable.tab')
a<-table.start()
a<-table.row.start(a)
a<-table.element(a,'Partial Autocorrelation Function',4,TRUE)
a<-table.row.end(a)
a<-table.row.start(a)
a<-table.element(a,'Time lag k',header=TRUE)
a<-table.element(a,hyperlink('basics.htm','PACF(k)','click here for more information about the Partial Autocorrelation Function'),header=TRUE)
a<-table.element(a,'T-STAT',header=TRUE)
a<-table.element(a,'P-value',header=TRUE)
a<-table.row.end(a)
for (i in 1:par1) {
a<-table.row.start(a)
a<-table.element(a,i-1,header=TRUE)
a<-table.element(a,round(mypacf[i],6))
mytstat <- mypacf[i]*sqrtn
a<-table.element(a,round(mytstat,4))
a<-table.element(a,round(1-pt(mytstat,lengthx),6))
a<-table.row.end(a)
}
a<-table.end(a)
table.save(a,file='mytable1.tab')