Free Statistics

of Irreproducible Research!

Author's title

Author*Unverified author*
R Software Modulerwasp_cross.wasp
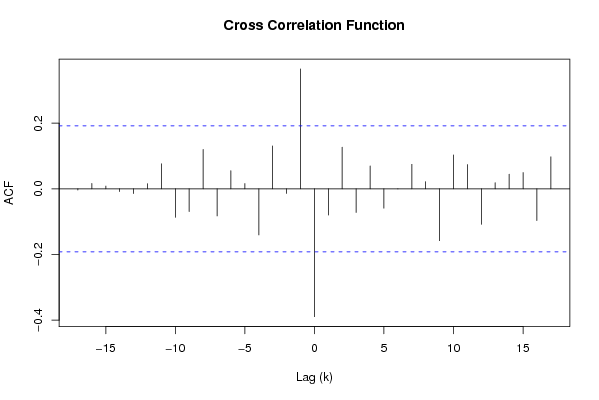
Title produced by softwareCross Correlation Function
Date of computationThu, 29 Nov 2007 10:42:51 -0700
Cite this page as followsStatistical Computations at FreeStatistics.org, Office for Research Development and Education, URL https://freestatistics.org/blog/index.php?v=date/2007/Nov/29/t1196359099a4gndgzfl8d79uj.htm/, Retrieved Fri, 03 May 2024 07:23:27 +0000
Statistical Computations at FreeStatistics.org, Office for Research Development and Education, URL https://freestatistics.org/blog/index.php?pk=7559, Retrieved Fri, 03 May 2024 07:23:27 +0000
QR Codes:

Original text written by user:
IsPrivate?No (this computation is public)
User-defined keywordsbridome
Estimated Impact214
Family? (F = Feedback message, R = changed R code, M = changed R Module, P = changed Parameters, D = changed Data)
-       [Cross Correlation Function] [workshop 3] [2007-11-29 17:42:51] [ff60737d3854dcb913eacf6907ce202b] [Current]
Feedback Forum

Post a new message
Dataseries X:
-29
-30
-34
-34
-35
-41
-32
-37
-36
-36
-31
-31
-26
-28
-32
-26
-21
-14
-14
-6
-8
-4
-11
12
18
7
11
9
15
22
18
19
25
33
15
10
16
38
41
43
42
40
48
46
51
52
55
55
46
38
43
43
44
45
35
36
36
25
31
35
46
47
40
29
28
29
29
30
26
27
18
15
1
1
2
2
1
-4
1
6
4
-1
-3
-8
-24
-29
-40
-32
-41
-48
-48
-62
-74
-65
-626
-620
-588
-566
-557
-561
-549
-532
-526
-511
-499
-555
Dataseries Y:
915
765
1119
476
812
-449
210
46
-1095
-146
-316
-474
-298
-355
-1216
-206
-417
245
173
-60
-386
3
-671
-138
284
-364
-107
-623
354
-1115
-1
-386
622
551
368
596
-423
298
638
587
-665
613
316
151
463
-262
56
138
399
211
932
1461
722
1348
-227
505
1415
126
48
189
894
753
-100
-672
521
-31
992
1750
31
240
1188
1070
120
491
1412
1577
565
813
-32
-415
-20
473
-214
-204
568
-319
-1086
-956
-742
-1036
-636
-1255
-487
-399
-4733
-5004
-5318,1
-4161,4
-4623,3
-4754,4
-4234,4
-4980,8
-4252,9
-4059,2
-5074,5
-4225,5


Summary of compuational transaction
Raw Inputview raw input (R code)
Raw Outputview raw output of R engine
Computing time2 seconds
R Server'Herman Ole Andreas Wold' @ 193.190.124.10:1001

\begin{tabular}{lllllllll}
\hline
Summary of compuational transaction \tabularnewline
Raw Input & view raw input (R code)  \tabularnewline
Raw Output & view raw output of R engine  \tabularnewline
Computing time & 2 seconds \tabularnewline
R Server & 'Herman Ole Andreas Wold' @ 193.190.124.10:1001 \tabularnewline
\hline
\end{tabular}
%Source: https://freestatistics.org/blog/index.php?pk=7559&T=0

[TABLE]
[ROW][C]Summary of compuational transaction[/C][/ROW]
[ROW][C]Raw Input[/C][C]view raw input (R code) [/C][/ROW]
[ROW][C]Raw Output[/C][C]view raw output of R engine [/C][/ROW]
[ROW][C]Computing time[/C][C]2 seconds[/C][/ROW]
[ROW][C]R Server[/C][C]'Herman Ole Andreas Wold' @ 193.190.124.10:1001[/C][/ROW]
[/TABLE]
Source: https://freestatistics.org/blog/index.php?pk=7559&T=0

Globally Unique Identifier (entire table): ba.freestatistics.org/blog/index.php?pk=7559&T=0

As an alternative you can also use a QR Code:  

The GUIDs for individual cells are displayed in the table below:

Summary of compuational transaction
Raw Inputview raw input (R code)
Raw Outputview raw output of R engine
Computing time2 seconds
R Server'Herman Ole Andreas Wold' @ 193.190.124.10:1001


Cross Correlation Function
ParameterValue
Box-Cox transformation parameter (lambda) of X series1
Degree of non-seasonal differencing (d) of X series1
Degree of seasonal differencing (D) of X series1
Seasonal Period (s)1
Box-Cox transformation parameter (lambda) of Y series1
Degree of non-seasonal differencing (d) of Y series1
Degree of seasonal differencing (D) of Y series0
krho(Y[t],X[t+k])
-17-0.00366265308375728
-160.016532742502103
-150.00851050819590983
-14-0.00804661421450987
-13-0.0142794866048821
-120.0158464222691698
-110.0763487314359315
-10-0.0866809286172738
-9-0.0691155445474056
-80.120097343098223
-7-0.0824530299998624
-60.0555474880255441
-50.0161147613157853
-4-0.140403136585730
-30.130760662129662
-2-0.0140371352556060
-10.36541686074011
0-0.389386671900984
1-0.0799640416936615
20.127054726526259
3-0.0719772801251113
40.069790545986345
5-0.058902634216028
6-6.89317776621108e-05
70.0746887111266381
80.0219977881317531
9-0.157877017231344
100.103514432561396
110.0739618905983962
12-0.108016106946926
130.0186702025605849
140.044576416723873
150.0497608656182034
16-0.0967405039578213
170.0976627948220988

\begin{tabular}{lllllllll}
\hline
Cross Correlation Function \tabularnewline
Parameter & Value \tabularnewline
Box-Cox transformation parameter (lambda) of X series & 1 \tabularnewline
Degree of non-seasonal differencing (d) of X series & 1 \tabularnewline
Degree of seasonal differencing (D) of X series & 1 \tabularnewline
Seasonal Period (s) & 1 \tabularnewline
Box-Cox transformation parameter (lambda) of Y series & 1 \tabularnewline
Degree of non-seasonal differencing (d) of Y series & 1 \tabularnewline
Degree of seasonal differencing (D) of Y series & 0 \tabularnewline
k & rho(Y[t],X[t+k]) \tabularnewline
-17 & -0.00366265308375728 \tabularnewline
-16 & 0.016532742502103 \tabularnewline
-15 & 0.00851050819590983 \tabularnewline
-14 & -0.00804661421450987 \tabularnewline
-13 & -0.0142794866048821 \tabularnewline
-12 & 0.0158464222691698 \tabularnewline
-11 & 0.0763487314359315 \tabularnewline
-10 & -0.0866809286172738 \tabularnewline
-9 & -0.0691155445474056 \tabularnewline
-8 & 0.120097343098223 \tabularnewline
-7 & -0.0824530299998624 \tabularnewline
-6 & 0.0555474880255441 \tabularnewline
-5 & 0.0161147613157853 \tabularnewline
-4 & -0.140403136585730 \tabularnewline
-3 & 0.130760662129662 \tabularnewline
-2 & -0.0140371352556060 \tabularnewline
-1 & 0.36541686074011 \tabularnewline
0 & -0.389386671900984 \tabularnewline
1 & -0.0799640416936615 \tabularnewline
2 & 0.127054726526259 \tabularnewline
3 & -0.0719772801251113 \tabularnewline
4 & 0.069790545986345 \tabularnewline
5 & -0.058902634216028 \tabularnewline
6 & -6.89317776621108e-05 \tabularnewline
7 & 0.0746887111266381 \tabularnewline
8 & 0.0219977881317531 \tabularnewline
9 & -0.157877017231344 \tabularnewline
10 & 0.103514432561396 \tabularnewline
11 & 0.0739618905983962 \tabularnewline
12 & -0.108016106946926 \tabularnewline
13 & 0.0186702025605849 \tabularnewline
14 & 0.044576416723873 \tabularnewline
15 & 0.0497608656182034 \tabularnewline
16 & -0.0967405039578213 \tabularnewline
17 & 0.0976627948220988 \tabularnewline
\hline
\end{tabular}
%Source: https://freestatistics.org/blog/index.php?pk=7559&T=1

[TABLE]
[ROW][C]Cross Correlation Function[/C][/ROW]
[ROW][C]Parameter[/C][C]Value[/C][/ROW]
[ROW][C]Box-Cox transformation parameter (lambda) of X series[/C][C]1[/C][/ROW]
[ROW][C]Degree of non-seasonal differencing (d) of X series[/C][C]1[/C][/ROW]
[ROW][C]Degree of seasonal differencing (D) of X series[/C][C]1[/C][/ROW]
[ROW][C]Seasonal Period (s)[/C][C]1[/C][/ROW]
[ROW][C]Box-Cox transformation parameter (lambda) of Y series[/C][C]1[/C][/ROW]
[ROW][C]Degree of non-seasonal differencing (d) of Y series[/C][C]1[/C][/ROW]
[ROW][C]Degree of seasonal differencing (D) of Y series[/C][C]0[/C][/ROW]
[ROW][C]k[/C][C]rho(Y[t],X[t+k])[/C][/ROW]
[ROW][C]-17[/C][C]-0.00366265308375728[/C][/ROW]
[ROW][C]-16[/C][C]0.016532742502103[/C][/ROW]
[ROW][C]-15[/C][C]0.00851050819590983[/C][/ROW]
[ROW][C]-14[/C][C]-0.00804661421450987[/C][/ROW]
[ROW][C]-13[/C][C]-0.0142794866048821[/C][/ROW]
[ROW][C]-12[/C][C]0.0158464222691698[/C][/ROW]
[ROW][C]-11[/C][C]0.0763487314359315[/C][/ROW]
[ROW][C]-10[/C][C]-0.0866809286172738[/C][/ROW]
[ROW][C]-9[/C][C]-0.0691155445474056[/C][/ROW]
[ROW][C]-8[/C][C]0.120097343098223[/C][/ROW]
[ROW][C]-7[/C][C]-0.0824530299998624[/C][/ROW]
[ROW][C]-6[/C][C]0.0555474880255441[/C][/ROW]
[ROW][C]-5[/C][C]0.0161147613157853[/C][/ROW]
[ROW][C]-4[/C][C]-0.140403136585730[/C][/ROW]
[ROW][C]-3[/C][C]0.130760662129662[/C][/ROW]
[ROW][C]-2[/C][C]-0.0140371352556060[/C][/ROW]
[ROW][C]-1[/C][C]0.36541686074011[/C][/ROW]
[ROW][C]0[/C][C]-0.389386671900984[/C][/ROW]
[ROW][C]1[/C][C]-0.0799640416936615[/C][/ROW]
[ROW][C]2[/C][C]0.127054726526259[/C][/ROW]
[ROW][C]3[/C][C]-0.0719772801251113[/C][/ROW]
[ROW][C]4[/C][C]0.069790545986345[/C][/ROW]
[ROW][C]5[/C][C]-0.058902634216028[/C][/ROW]
[ROW][C]6[/C][C]-6.89317776621108e-05[/C][/ROW]
[ROW][C]7[/C][C]0.0746887111266381[/C][/ROW]
[ROW][C]8[/C][C]0.0219977881317531[/C][/ROW]
[ROW][C]9[/C][C]-0.157877017231344[/C][/ROW]
[ROW][C]10[/C][C]0.103514432561396[/C][/ROW]
[ROW][C]11[/C][C]0.0739618905983962[/C][/ROW]
[ROW][C]12[/C][C]-0.108016106946926[/C][/ROW]
[ROW][C]13[/C][C]0.0186702025605849[/C][/ROW]
[ROW][C]14[/C][C]0.044576416723873[/C][/ROW]
[ROW][C]15[/C][C]0.0497608656182034[/C][/ROW]
[ROW][C]16[/C][C]-0.0967405039578213[/C][/ROW]
[ROW][C]17[/C][C]0.0976627948220988[/C][/ROW]
[/TABLE]
Source: https://freestatistics.org/blog/index.php?pk=7559&T=1

Globally Unique Identifier (entire table): ba.freestatistics.org/blog/index.php?pk=7559&T=1

As an alternative you can also use a QR Code:  

The GUIDs for individual cells are displayed in the table below:

Cross Correlation Function
ParameterValue
Box-Cox transformation parameter (lambda) of X series1
Degree of non-seasonal differencing (d) of X series1
Degree of seasonal differencing (D) of X series1
Seasonal Period (s)1
Box-Cox transformation parameter (lambda) of Y series1
Degree of non-seasonal differencing (d) of Y series1
Degree of seasonal differencing (D) of Y series0
krho(Y[t],X[t+k])
-17-0.00366265308375728
-160.016532742502103
-150.00851050819590983
-14-0.00804661421450987
-13-0.0142794866048821
-120.0158464222691698
-110.0763487314359315
-10-0.0866809286172738
-9-0.0691155445474056
-80.120097343098223
-7-0.0824530299998624
-60.0555474880255441
-50.0161147613157853
-4-0.140403136585730
-30.130760662129662
-2-0.0140371352556060
-10.36541686074011
0-0.389386671900984
1-0.0799640416936615
20.127054726526259
3-0.0719772801251113
40.069790545986345
5-0.058902634216028
6-6.89317776621108e-05
70.0746887111266381
80.0219977881317531
9-0.157877017231344
100.103514432561396
110.0739618905983962
12-0.108016106946926
130.0186702025605849
140.044576416723873
150.0497608656182034
16-0.0967405039578213
170.0976627948220988


Parameters (Session):
par1 = 1 ; par2 = 1 ; par3 = 1 ; par4 = 1 ; par5 = 1 ; par6 = 1 ; par7 = 0 ;
Parameters (R input):
par1 = 1 ; par2 = 1 ; par3 = 1 ; par4 = 1 ; par5 = 1 ; par6 = 1 ; par7 = 0 ;
R code (references can be found in the software module):
par1 <- as.numeric(par1)
par2 <- as.numeric(par2)
par3 <- as.numeric(par3)
par4 <- as.numeric(par4)
par5 <- as.numeric(par5)
par6 <- as.numeric(par6)
par7 <- as.numeric(par7)
if (par1 == 0) {
x <- log(x)
} else {
x <- (x ^ par1 - 1) / par1
}
if (par5 == 0) {
y <- log(y)
} else {
y <- (y ^ par5 - 1) / par5
}
if (par2 > 0) x <- diff(x,lag=1,difference=par2)
if (par6 > 0) y <- diff(y,lag=1,difference=par6)
if (par3 > 0) x <- diff(x,lag=par4,difference=par3)
if (par7 > 0) x <- diff(y,lag=par4,difference=par7)
x
y
bitmap(file='test1.png')
(r <- ccf(x,y,main='Cross Correlation Function',xlab='Lag (k)'))
dev.off()
load(file='createtable')
a<-table.start()
a<-table.row.start(a)
a<-table.element(a,'Cross Correlation Function',2,TRUE)
a<-table.row.end(a)
a<-table.row.start(a)
a<-table.element(a,'Parameter',header=TRUE)
a<-table.element(a,'Value',header=TRUE)
a<-table.row.end(a)
a<-table.row.start(a)
a<-table.element(a,'Box-Cox transformation parameter (lambda) of X series',header=TRUE)
a<-table.element(a,par1)
a<-table.row.end(a)
a<-table.row.start(a)
a<-table.element(a,'Degree of non-seasonal differencing (d) of X series',header=TRUE)
a<-table.element(a,par2)
a<-table.row.end(a)
a<-table.row.start(a)
a<-table.element(a,'Degree of seasonal differencing (D) of X series',header=TRUE)
a<-table.element(a,par3)
a<-table.row.end(a)
a<-table.row.start(a)
a<-table.element(a,'Seasonal Period (s)',header=TRUE)
a<-table.element(a,par4)
a<-table.row.end(a)
a<-table.row.start(a)
a<-table.element(a,'Box-Cox transformation parameter (lambda) of Y series',header=TRUE)
a<-table.element(a,par5)
a<-table.row.end(a)
a<-table.row.start(a)
a<-table.element(a,'Degree of non-seasonal differencing (d) of Y series',header=TRUE)
a<-table.element(a,par6)
a<-table.row.end(a)
a<-table.row.start(a)
a<-table.element(a,'Degree of seasonal differencing (D) of Y series',header=TRUE)
a<-table.element(a,par7)
a<-table.row.end(a)
a<-table.row.start(a)
a<-table.element(a,'k',header=TRUE)
a<-table.element(a,'rho(Y[t],X[t+k])',header=TRUE)
a<-table.row.end(a)
mylength <- length(r$acf)
myhalf <- floor((mylength-1)/2)
for (i in 1:mylength) {
a<-table.row.start(a)
a<-table.element(a,i-myhalf-1,header=TRUE)
a<-table.element(a,r$acf[i])
a<-table.row.end(a)
}
a<-table.end(a)
table.save(a,file='mytable.tab')