Free Statistics

of Irreproducible Research!

Author's title

Author*Unverified author*
R Software Modulerwasp_autocorrelation.wasp
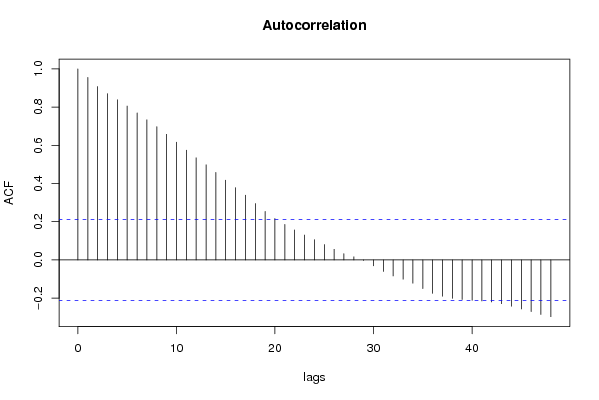
Title produced by software(Partial) Autocorrelation Function
Date of computationThu, 29 Nov 2007 09:45:21 -0700
Cite this page as followsStatistical Computations at FreeStatistics.org, Office for Research Development and Education, URL https://freestatistics.org/blog/index.php?v=date/2007/Nov/29/t1196354096z0fuvogrnthr526.htm/, Retrieved Fri, 03 May 2024 14:49:17 +0000
Statistical Computations at FreeStatistics.org, Office for Research Development and Education, URL https://freestatistics.org/blog/index.php?pk=7545, Retrieved Fri, 03 May 2024 14:49:17 +0000
QR Codes:

Original text written by user:
IsPrivate?No (this computation is public)
User-defined keywords
Estimated Impact172
Family? (F = Feedback message, R = changed R code, M = changed R Module, P = changed Parameters, D = changed Data)
-       [(Partial) Autocorrelation Function] [acf dollar koers ...] [2007-11-29 16:45:21] [6c82e325b196f1aec5740f38b2795d46] [Current]
Feedback Forum

Post a new message
Dataseries X:
0.8552
0.8564
0.8973
0.9383
0.9217
0.9095
0.892
0.8742
0.8532
0.8607
0.9005
0.9111
0.9059
0.8883
0.8924
0.8833
0.87
0.8758
0.8858
0.917
0.9554
0.9922
0.9778
0.9808
0.9811
1.0014
1.0183
1.0622
1.0773
1.0807
1.0848
1.1582
1.1663
1.1372
1.1139
1.1222
1.1692
1.1702
1.2286
1.2613
1.2646
1.2262
1.1985
1.2007
1.2138
1.2266
1.2176
1.2218
1.249
1.2991
1.3408
1.3119
1.3014
1.3201
1.2938
1.2694
1.2165
1.2037
1.2292
1.2256
1.2015
1.1786
1.1856
1.2103
1.1938
1.202
1.2271
1.277
1.265
1.2684
1.2811
1.2727
1.2611
1.2881
1.3213
1.2999
1.3074
1.3242
1.3516
1.3511
1.3419
1.3716
1.3622
1.3896
1.4227


Summary of compuational transaction
Raw Inputview raw input (R code)
Raw Outputview raw output of R engine
Computing time2 seconds
R Server'Gwilym Jenkins' @ 72.249.127.135

\begin{tabular}{lllllllll}
\hline
Summary of compuational transaction \tabularnewline
Raw Input & view raw input (R code)  \tabularnewline
Raw Output & view raw output of R engine  \tabularnewline
Computing time & 2 seconds \tabularnewline
R Server & 'Gwilym Jenkins' @ 72.249.127.135 \tabularnewline
\hline
\end{tabular}
%Source: https://freestatistics.org/blog/index.php?pk=7545&T=0

[TABLE]
[ROW][C]Summary of compuational transaction[/C][/ROW]
[ROW][C]Raw Input[/C][C]view raw input (R code) [/C][/ROW]
[ROW][C]Raw Output[/C][C]view raw output of R engine [/C][/ROW]
[ROW][C]Computing time[/C][C]2 seconds[/C][/ROW]
[ROW][C]R Server[/C][C]'Gwilym Jenkins' @ 72.249.127.135[/C][/ROW]
[/TABLE]
Source: https://freestatistics.org/blog/index.php?pk=7545&T=0

Globally Unique Identifier (entire table): ba.freestatistics.org/blog/index.php?pk=7545&T=0

As an alternative you can also use a QR Code:  

The GUIDs for individual cells are displayed in the table below:

Summary of compuational transaction
Raw Inputview raw input (R code)
Raw Outputview raw output of R engine
Computing time2 seconds
R Server'Gwilym Jenkins' @ 72.249.127.135


Autocorrelation Function
Time lag kACF(k)T-STATP-value
019.21950
10.9554388.80870
20.9078768.37020
30.8703048.02380
40.8383577.72930
50.8057377.42850
60.7695857.09520
70.7338756.7660
80.6974276.430
90.6574876.06170
100.6163765.68270
110.5743495.29520
120.5348214.93082e-06
130.497914.59058e-06
140.4583294.22563e-05
150.4175363.84950.000114
160.3781143.4860.000389
170.3388413.1240.00122
180.295282.72230.003932
190.2541272.34290.010734
200.2167711.99850.024428
210.1857171.71220.045251
220.1569881.44740.075737
230.1300251.19880.116974
240.1060940.97810.165392
250.0802760.74010.230637
260.055620.51280.304713
270.0325020.29970.382585
280.0165830.15290.439423
29-0.002675-0.02470.509809
30-0.030874-0.28460.611694
31-0.060386-0.55670.710414
32-0.083655-0.77130.778655
33-0.101139-0.93250.82313
34-0.121738-1.12240.867566
35-0.149979-1.38270.914817
36-0.174725-1.61090.944543
37-0.189806-1.74990.95813
38-0.200746-1.85080.966163
39-0.206813-1.90670.970033
40-0.211731-1.95210.972889
41-0.214892-1.98120.974599
42-0.219883-2.02720.977114
43-0.228989-2.11120.981153
44-0.242164-2.23260.9859
45-0.256723-2.36690.989894
46-0.270562-2.49450.992725
47-0.285204-2.62940.994925

\begin{tabular}{lllllllll}
\hline
Autocorrelation Function \tabularnewline
Time lag k & ACF(k) & T-STAT & P-value \tabularnewline
0 & 1 & 9.2195 & 0 \tabularnewline
1 & 0.955438 & 8.8087 & 0 \tabularnewline
2 & 0.907876 & 8.3702 & 0 \tabularnewline
3 & 0.870304 & 8.0238 & 0 \tabularnewline
4 & 0.838357 & 7.7293 & 0 \tabularnewline
5 & 0.805737 & 7.4285 & 0 \tabularnewline
6 & 0.769585 & 7.0952 & 0 \tabularnewline
7 & 0.733875 & 6.766 & 0 \tabularnewline
8 & 0.697427 & 6.43 & 0 \tabularnewline
9 & 0.657487 & 6.0617 & 0 \tabularnewline
10 & 0.616376 & 5.6827 & 0 \tabularnewline
11 & 0.574349 & 5.2952 & 0 \tabularnewline
12 & 0.534821 & 4.9308 & 2e-06 \tabularnewline
13 & 0.49791 & 4.5905 & 8e-06 \tabularnewline
14 & 0.458329 & 4.2256 & 3e-05 \tabularnewline
15 & 0.417536 & 3.8495 & 0.000114 \tabularnewline
16 & 0.378114 & 3.486 & 0.000389 \tabularnewline
17 & 0.338841 & 3.124 & 0.00122 \tabularnewline
18 & 0.29528 & 2.7223 & 0.003932 \tabularnewline
19 & 0.254127 & 2.3429 & 0.010734 \tabularnewline
20 & 0.216771 & 1.9985 & 0.024428 \tabularnewline
21 & 0.185717 & 1.7122 & 0.045251 \tabularnewline
22 & 0.156988 & 1.4474 & 0.075737 \tabularnewline
23 & 0.130025 & 1.1988 & 0.116974 \tabularnewline
24 & 0.106094 & 0.9781 & 0.165392 \tabularnewline
25 & 0.080276 & 0.7401 & 0.230637 \tabularnewline
26 & 0.05562 & 0.5128 & 0.304713 \tabularnewline
27 & 0.032502 & 0.2997 & 0.382585 \tabularnewline
28 & 0.016583 & 0.1529 & 0.439423 \tabularnewline
29 & -0.002675 & -0.0247 & 0.509809 \tabularnewline
30 & -0.030874 & -0.2846 & 0.611694 \tabularnewline
31 & -0.060386 & -0.5567 & 0.710414 \tabularnewline
32 & -0.083655 & -0.7713 & 0.778655 \tabularnewline
33 & -0.101139 & -0.9325 & 0.82313 \tabularnewline
34 & -0.121738 & -1.1224 & 0.867566 \tabularnewline
35 & -0.149979 & -1.3827 & 0.914817 \tabularnewline
36 & -0.174725 & -1.6109 & 0.944543 \tabularnewline
37 & -0.189806 & -1.7499 & 0.95813 \tabularnewline
38 & -0.200746 & -1.8508 & 0.966163 \tabularnewline
39 & -0.206813 & -1.9067 & 0.970033 \tabularnewline
40 & -0.211731 & -1.9521 & 0.972889 \tabularnewline
41 & -0.214892 & -1.9812 & 0.974599 \tabularnewline
42 & -0.219883 & -2.0272 & 0.977114 \tabularnewline
43 & -0.228989 & -2.1112 & 0.981153 \tabularnewline
44 & -0.242164 & -2.2326 & 0.9859 \tabularnewline
45 & -0.256723 & -2.3669 & 0.989894 \tabularnewline
46 & -0.270562 & -2.4945 & 0.992725 \tabularnewline
47 & -0.285204 & -2.6294 & 0.994925 \tabularnewline
\hline
\end{tabular}
%Source: https://freestatistics.org/blog/index.php?pk=7545&T=1

[TABLE]
[ROW][C]Autocorrelation Function[/C][/ROW]
[ROW][C]Time lag k[/C][C]ACF(k)[/C][C]T-STAT[/C][C]P-value[/C][/ROW]
[ROW][C]0[/C][C]1[/C][C]9.2195[/C][C]0[/C][/ROW]
[ROW][C]1[/C][C]0.955438[/C][C]8.8087[/C][C]0[/C][/ROW]
[ROW][C]2[/C][C]0.907876[/C][C]8.3702[/C][C]0[/C][/ROW]
[ROW][C]3[/C][C]0.870304[/C][C]8.0238[/C][C]0[/C][/ROW]
[ROW][C]4[/C][C]0.838357[/C][C]7.7293[/C][C]0[/C][/ROW]
[ROW][C]5[/C][C]0.805737[/C][C]7.4285[/C][C]0[/C][/ROW]
[ROW][C]6[/C][C]0.769585[/C][C]7.0952[/C][C]0[/C][/ROW]
[ROW][C]7[/C][C]0.733875[/C][C]6.766[/C][C]0[/C][/ROW]
[ROW][C]8[/C][C]0.697427[/C][C]6.43[/C][C]0[/C][/ROW]
[ROW][C]9[/C][C]0.657487[/C][C]6.0617[/C][C]0[/C][/ROW]
[ROW][C]10[/C][C]0.616376[/C][C]5.6827[/C][C]0[/C][/ROW]
[ROW][C]11[/C][C]0.574349[/C][C]5.2952[/C][C]0[/C][/ROW]
[ROW][C]12[/C][C]0.534821[/C][C]4.9308[/C][C]2e-06[/C][/ROW]
[ROW][C]13[/C][C]0.49791[/C][C]4.5905[/C][C]8e-06[/C][/ROW]
[ROW][C]14[/C][C]0.458329[/C][C]4.2256[/C][C]3e-05[/C][/ROW]
[ROW][C]15[/C][C]0.417536[/C][C]3.8495[/C][C]0.000114[/C][/ROW]
[ROW][C]16[/C][C]0.378114[/C][C]3.486[/C][C]0.000389[/C][/ROW]
[ROW][C]17[/C][C]0.338841[/C][C]3.124[/C][C]0.00122[/C][/ROW]
[ROW][C]18[/C][C]0.29528[/C][C]2.7223[/C][C]0.003932[/C][/ROW]
[ROW][C]19[/C][C]0.254127[/C][C]2.3429[/C][C]0.010734[/C][/ROW]
[ROW][C]20[/C][C]0.216771[/C][C]1.9985[/C][C]0.024428[/C][/ROW]
[ROW][C]21[/C][C]0.185717[/C][C]1.7122[/C][C]0.045251[/C][/ROW]
[ROW][C]22[/C][C]0.156988[/C][C]1.4474[/C][C]0.075737[/C][/ROW]
[ROW][C]23[/C][C]0.130025[/C][C]1.1988[/C][C]0.116974[/C][/ROW]
[ROW][C]24[/C][C]0.106094[/C][C]0.9781[/C][C]0.165392[/C][/ROW]
[ROW][C]25[/C][C]0.080276[/C][C]0.7401[/C][C]0.230637[/C][/ROW]
[ROW][C]26[/C][C]0.05562[/C][C]0.5128[/C][C]0.304713[/C][/ROW]
[ROW][C]27[/C][C]0.032502[/C][C]0.2997[/C][C]0.382585[/C][/ROW]
[ROW][C]28[/C][C]0.016583[/C][C]0.1529[/C][C]0.439423[/C][/ROW]
[ROW][C]29[/C][C]-0.002675[/C][C]-0.0247[/C][C]0.509809[/C][/ROW]
[ROW][C]30[/C][C]-0.030874[/C][C]-0.2846[/C][C]0.611694[/C][/ROW]
[ROW][C]31[/C][C]-0.060386[/C][C]-0.5567[/C][C]0.710414[/C][/ROW]
[ROW][C]32[/C][C]-0.083655[/C][C]-0.7713[/C][C]0.778655[/C][/ROW]
[ROW][C]33[/C][C]-0.101139[/C][C]-0.9325[/C][C]0.82313[/C][/ROW]
[ROW][C]34[/C][C]-0.121738[/C][C]-1.1224[/C][C]0.867566[/C][/ROW]
[ROW][C]35[/C][C]-0.149979[/C][C]-1.3827[/C][C]0.914817[/C][/ROW]
[ROW][C]36[/C][C]-0.174725[/C][C]-1.6109[/C][C]0.944543[/C][/ROW]
[ROW][C]37[/C][C]-0.189806[/C][C]-1.7499[/C][C]0.95813[/C][/ROW]
[ROW][C]38[/C][C]-0.200746[/C][C]-1.8508[/C][C]0.966163[/C][/ROW]
[ROW][C]39[/C][C]-0.206813[/C][C]-1.9067[/C][C]0.970033[/C][/ROW]
[ROW][C]40[/C][C]-0.211731[/C][C]-1.9521[/C][C]0.972889[/C][/ROW]
[ROW][C]41[/C][C]-0.214892[/C][C]-1.9812[/C][C]0.974599[/C][/ROW]
[ROW][C]42[/C][C]-0.219883[/C][C]-2.0272[/C][C]0.977114[/C][/ROW]
[ROW][C]43[/C][C]-0.228989[/C][C]-2.1112[/C][C]0.981153[/C][/ROW]
[ROW][C]44[/C][C]-0.242164[/C][C]-2.2326[/C][C]0.9859[/C][/ROW]
[ROW][C]45[/C][C]-0.256723[/C][C]-2.3669[/C][C]0.989894[/C][/ROW]
[ROW][C]46[/C][C]-0.270562[/C][C]-2.4945[/C][C]0.992725[/C][/ROW]
[ROW][C]47[/C][C]-0.285204[/C][C]-2.6294[/C][C]0.994925[/C][/ROW]
[/TABLE]
Source: https://freestatistics.org/blog/index.php?pk=7545&T=1

Globally Unique Identifier (entire table): ba.freestatistics.org/blog/index.php?pk=7545&T=1

As an alternative you can also use a QR Code:  

The GUIDs for individual cells are displayed in the table below:

Autocorrelation Function
Time lag kACF(k)T-STATP-value
019.21950
10.9554388.80870
20.9078768.37020
30.8703048.02380
40.8383577.72930
50.8057377.42850
60.7695857.09520
70.7338756.7660
80.6974276.430
90.6574876.06170
100.6163765.68270
110.5743495.29520
120.5348214.93082e-06
130.497914.59058e-06
140.4583294.22563e-05
150.4175363.84950.000114
160.3781143.4860.000389
170.3388413.1240.00122
180.295282.72230.003932
190.2541272.34290.010734
200.2167711.99850.024428
210.1857171.71220.045251
220.1569881.44740.075737
230.1300251.19880.116974
240.1060940.97810.165392
250.0802760.74010.230637
260.055620.51280.304713
270.0325020.29970.382585
280.0165830.15290.439423
29-0.002675-0.02470.509809
30-0.030874-0.28460.611694
31-0.060386-0.55670.710414
32-0.083655-0.77130.778655
33-0.101139-0.93250.82313
34-0.121738-1.12240.867566
35-0.149979-1.38270.914817
36-0.174725-1.61090.944543
37-0.189806-1.74990.95813
38-0.200746-1.85080.966163
39-0.206813-1.90670.970033
40-0.211731-1.95210.972889
41-0.214892-1.98120.974599
42-0.219883-2.02720.977114
43-0.228989-2.11120.981153
44-0.242164-2.23260.9859
45-0.256723-2.36690.989894
46-0.270562-2.49450.992725
47-0.285204-2.62940.994925


Partial Autocorrelation Function
Time lag kPACF(k)T-STATP-value
00.9554388.80870
1-0.057225-0.52760.70042
20.0911990.84080.201406
30.0367190.33850.367899
4-0.017385-0.16030.563481
5-0.045889-0.42310.663347
6-0.010029-0.09250.536727
7-0.037215-0.34310.633815
8-0.063568-0.58610.720308
9-0.036662-0.3380.631905
10-0.044492-0.41020.658653
11-0.004533-0.04180.51662
12-0.000658-0.00610.502412
13-0.051848-0.4780.683065
14-0.030224-0.27870.609405
15-0.012985-0.11970.547505
16-0.032889-0.30320.61877
17-0.077937-0.71850.762802
180.0025620.02360.490605
19-0.002478-0.02280.509085
200.0392830.36220.359063
210.0087280.08050.468026
220.0164060.15130.440065
230.0227510.20980.41718
24-0.039062-0.36010.64018
25-0.001626-0.0150.505962
26-0.010653-0.09820.539005
270.057330.52860.299245
28-0.073414-0.67680.749827
29-0.113812-1.04930.851492
30-0.04273-0.3940.652698
310.0164430.15160.439933
320.0180950.16680.433951
33-0.057513-0.53020.701337
34-0.09557-0.88110.809629
350.0026870.02480.490146
360.0596380.54980.291937
370.0184920.17050.432514
380.0692220.63820.262531
390.0187930.17330.431429
400.0103840.09570.461977
41-0.025845-0.23830.593882
42-0.044237-0.40780.657793
43-0.064192-0.59180.722231
44-0.069654-0.64220.738756
45-0.043807-0.40390.656343
46-0.052098-0.48030.683883
470.012960.11950.452586

\begin{tabular}{lllllllll}
\hline
Partial Autocorrelation Function \tabularnewline
Time lag k & PACF(k) & T-STAT & P-value \tabularnewline
0 & 0.955438 & 8.8087 & 0 \tabularnewline
1 & -0.057225 & -0.5276 & 0.70042 \tabularnewline
2 & 0.091199 & 0.8408 & 0.201406 \tabularnewline
3 & 0.036719 & 0.3385 & 0.367899 \tabularnewline
4 & -0.017385 & -0.1603 & 0.563481 \tabularnewline
5 & -0.045889 & -0.4231 & 0.663347 \tabularnewline
6 & -0.010029 & -0.0925 & 0.536727 \tabularnewline
7 & -0.037215 & -0.3431 & 0.633815 \tabularnewline
8 & -0.063568 & -0.5861 & 0.720308 \tabularnewline
9 & -0.036662 & -0.338 & 0.631905 \tabularnewline
10 & -0.044492 & -0.4102 & 0.658653 \tabularnewline
11 & -0.004533 & -0.0418 & 0.51662 \tabularnewline
12 & -0.000658 & -0.0061 & 0.502412 \tabularnewline
13 & -0.051848 & -0.478 & 0.683065 \tabularnewline
14 & -0.030224 & -0.2787 & 0.609405 \tabularnewline
15 & -0.012985 & -0.1197 & 0.547505 \tabularnewline
16 & -0.032889 & -0.3032 & 0.61877 \tabularnewline
17 & -0.077937 & -0.7185 & 0.762802 \tabularnewline
18 & 0.002562 & 0.0236 & 0.490605 \tabularnewline
19 & -0.002478 & -0.0228 & 0.509085 \tabularnewline
20 & 0.039283 & 0.3622 & 0.359063 \tabularnewline
21 & 0.008728 & 0.0805 & 0.468026 \tabularnewline
22 & 0.016406 & 0.1513 & 0.440065 \tabularnewline
23 & 0.022751 & 0.2098 & 0.41718 \tabularnewline
24 & -0.039062 & -0.3601 & 0.64018 \tabularnewline
25 & -0.001626 & -0.015 & 0.505962 \tabularnewline
26 & -0.010653 & -0.0982 & 0.539005 \tabularnewline
27 & 0.05733 & 0.5286 & 0.299245 \tabularnewline
28 & -0.073414 & -0.6768 & 0.749827 \tabularnewline
29 & -0.113812 & -1.0493 & 0.851492 \tabularnewline
30 & -0.04273 & -0.394 & 0.652698 \tabularnewline
31 & 0.016443 & 0.1516 & 0.439933 \tabularnewline
32 & 0.018095 & 0.1668 & 0.433951 \tabularnewline
33 & -0.057513 & -0.5302 & 0.701337 \tabularnewline
34 & -0.09557 & -0.8811 & 0.809629 \tabularnewline
35 & 0.002687 & 0.0248 & 0.490146 \tabularnewline
36 & 0.059638 & 0.5498 & 0.291937 \tabularnewline
37 & 0.018492 & 0.1705 & 0.432514 \tabularnewline
38 & 0.069222 & 0.6382 & 0.262531 \tabularnewline
39 & 0.018793 & 0.1733 & 0.431429 \tabularnewline
40 & 0.010384 & 0.0957 & 0.461977 \tabularnewline
41 & -0.025845 & -0.2383 & 0.593882 \tabularnewline
42 & -0.044237 & -0.4078 & 0.657793 \tabularnewline
43 & -0.064192 & -0.5918 & 0.722231 \tabularnewline
44 & -0.069654 & -0.6422 & 0.738756 \tabularnewline
45 & -0.043807 & -0.4039 & 0.656343 \tabularnewline
46 & -0.052098 & -0.4803 & 0.683883 \tabularnewline
47 & 0.01296 & 0.1195 & 0.452586 \tabularnewline
\hline
\end{tabular}
%Source: https://freestatistics.org/blog/index.php?pk=7545&T=2

[TABLE]
[ROW][C]Partial Autocorrelation Function[/C][/ROW]
[ROW][C]Time lag k[/C][C]PACF(k)[/C][C]T-STAT[/C][C]P-value[/C][/ROW]
[ROW][C]0[/C][C]0.955438[/C][C]8.8087[/C][C]0[/C][/ROW]
[ROW][C]1[/C][C]-0.057225[/C][C]-0.5276[/C][C]0.70042[/C][/ROW]
[ROW][C]2[/C][C]0.091199[/C][C]0.8408[/C][C]0.201406[/C][/ROW]
[ROW][C]3[/C][C]0.036719[/C][C]0.3385[/C][C]0.367899[/C][/ROW]
[ROW][C]4[/C][C]-0.017385[/C][C]-0.1603[/C][C]0.563481[/C][/ROW]
[ROW][C]5[/C][C]-0.045889[/C][C]-0.4231[/C][C]0.663347[/C][/ROW]
[ROW][C]6[/C][C]-0.010029[/C][C]-0.0925[/C][C]0.536727[/C][/ROW]
[ROW][C]7[/C][C]-0.037215[/C][C]-0.3431[/C][C]0.633815[/C][/ROW]
[ROW][C]8[/C][C]-0.063568[/C][C]-0.5861[/C][C]0.720308[/C][/ROW]
[ROW][C]9[/C][C]-0.036662[/C][C]-0.338[/C][C]0.631905[/C][/ROW]
[ROW][C]10[/C][C]-0.044492[/C][C]-0.4102[/C][C]0.658653[/C][/ROW]
[ROW][C]11[/C][C]-0.004533[/C][C]-0.0418[/C][C]0.51662[/C][/ROW]
[ROW][C]12[/C][C]-0.000658[/C][C]-0.0061[/C][C]0.502412[/C][/ROW]
[ROW][C]13[/C][C]-0.051848[/C][C]-0.478[/C][C]0.683065[/C][/ROW]
[ROW][C]14[/C][C]-0.030224[/C][C]-0.2787[/C][C]0.609405[/C][/ROW]
[ROW][C]15[/C][C]-0.012985[/C][C]-0.1197[/C][C]0.547505[/C][/ROW]
[ROW][C]16[/C][C]-0.032889[/C][C]-0.3032[/C][C]0.61877[/C][/ROW]
[ROW][C]17[/C][C]-0.077937[/C][C]-0.7185[/C][C]0.762802[/C][/ROW]
[ROW][C]18[/C][C]0.002562[/C][C]0.0236[/C][C]0.490605[/C][/ROW]
[ROW][C]19[/C][C]-0.002478[/C][C]-0.0228[/C][C]0.509085[/C][/ROW]
[ROW][C]20[/C][C]0.039283[/C][C]0.3622[/C][C]0.359063[/C][/ROW]
[ROW][C]21[/C][C]0.008728[/C][C]0.0805[/C][C]0.468026[/C][/ROW]
[ROW][C]22[/C][C]0.016406[/C][C]0.1513[/C][C]0.440065[/C][/ROW]
[ROW][C]23[/C][C]0.022751[/C][C]0.2098[/C][C]0.41718[/C][/ROW]
[ROW][C]24[/C][C]-0.039062[/C][C]-0.3601[/C][C]0.64018[/C][/ROW]
[ROW][C]25[/C][C]-0.001626[/C][C]-0.015[/C][C]0.505962[/C][/ROW]
[ROW][C]26[/C][C]-0.010653[/C][C]-0.0982[/C][C]0.539005[/C][/ROW]
[ROW][C]27[/C][C]0.05733[/C][C]0.5286[/C][C]0.299245[/C][/ROW]
[ROW][C]28[/C][C]-0.073414[/C][C]-0.6768[/C][C]0.749827[/C][/ROW]
[ROW][C]29[/C][C]-0.113812[/C][C]-1.0493[/C][C]0.851492[/C][/ROW]
[ROW][C]30[/C][C]-0.04273[/C][C]-0.394[/C][C]0.652698[/C][/ROW]
[ROW][C]31[/C][C]0.016443[/C][C]0.1516[/C][C]0.439933[/C][/ROW]
[ROW][C]32[/C][C]0.018095[/C][C]0.1668[/C][C]0.433951[/C][/ROW]
[ROW][C]33[/C][C]-0.057513[/C][C]-0.5302[/C][C]0.701337[/C][/ROW]
[ROW][C]34[/C][C]-0.09557[/C][C]-0.8811[/C][C]0.809629[/C][/ROW]
[ROW][C]35[/C][C]0.002687[/C][C]0.0248[/C][C]0.490146[/C][/ROW]
[ROW][C]36[/C][C]0.059638[/C][C]0.5498[/C][C]0.291937[/C][/ROW]
[ROW][C]37[/C][C]0.018492[/C][C]0.1705[/C][C]0.432514[/C][/ROW]
[ROW][C]38[/C][C]0.069222[/C][C]0.6382[/C][C]0.262531[/C][/ROW]
[ROW][C]39[/C][C]0.018793[/C][C]0.1733[/C][C]0.431429[/C][/ROW]
[ROW][C]40[/C][C]0.010384[/C][C]0.0957[/C][C]0.461977[/C][/ROW]
[ROW][C]41[/C][C]-0.025845[/C][C]-0.2383[/C][C]0.593882[/C][/ROW]
[ROW][C]42[/C][C]-0.044237[/C][C]-0.4078[/C][C]0.657793[/C][/ROW]
[ROW][C]43[/C][C]-0.064192[/C][C]-0.5918[/C][C]0.722231[/C][/ROW]
[ROW][C]44[/C][C]-0.069654[/C][C]-0.6422[/C][C]0.738756[/C][/ROW]
[ROW][C]45[/C][C]-0.043807[/C][C]-0.4039[/C][C]0.656343[/C][/ROW]
[ROW][C]46[/C][C]-0.052098[/C][C]-0.4803[/C][C]0.683883[/C][/ROW]
[ROW][C]47[/C][C]0.01296[/C][C]0.1195[/C][C]0.452586[/C][/ROW]
[/TABLE]
Source: https://freestatistics.org/blog/index.php?pk=7545&T=2

Globally Unique Identifier (entire table): ba.freestatistics.org/blog/index.php?pk=7545&T=2

As an alternative you can also use a QR Code:  

The GUIDs for individual cells are displayed in the table below:

Partial Autocorrelation Function
Time lag kPACF(k)T-STATP-value
00.9554388.80870
1-0.057225-0.52760.70042
20.0911990.84080.201406
30.0367190.33850.367899
4-0.017385-0.16030.563481
5-0.045889-0.42310.663347
6-0.010029-0.09250.536727
7-0.037215-0.34310.633815
8-0.063568-0.58610.720308
9-0.036662-0.3380.631905
10-0.044492-0.41020.658653
11-0.004533-0.04180.51662
12-0.000658-0.00610.502412
13-0.051848-0.4780.683065
14-0.030224-0.27870.609405
15-0.012985-0.11970.547505
16-0.032889-0.30320.61877
17-0.077937-0.71850.762802
180.0025620.02360.490605
19-0.002478-0.02280.509085
200.0392830.36220.359063
210.0087280.08050.468026
220.0164060.15130.440065
230.0227510.20980.41718
24-0.039062-0.36010.64018
25-0.001626-0.0150.505962
26-0.010653-0.09820.539005
270.057330.52860.299245
28-0.073414-0.67680.749827
29-0.113812-1.04930.851492
30-0.04273-0.3940.652698
310.0164430.15160.439933
320.0180950.16680.433951
33-0.057513-0.53020.701337
34-0.09557-0.88110.809629
350.0026870.02480.490146
360.0596380.54980.291937
370.0184920.17050.432514
380.0692220.63820.262531
390.0187930.17330.431429
400.0103840.09570.461977
41-0.025845-0.23830.593882
42-0.044237-0.40780.657793
43-0.064192-0.59180.722231
44-0.069654-0.64220.738756
45-0.043807-0.40390.656343
46-0.052098-0.48030.683883
470.012960.11950.452586


Parameters (Session):
par1 = 48 ; par2 = 1 ; par3 = 0 ; par4 = 0 ; par5 = 12 ;
Parameters (R input):
par1 = 48 ; par2 = 1 ; par3 = 0 ; par4 = 0 ; par5 = 12 ;
R code (references can be found in the software module):
if (par1 == 'Default') {
par1 = 10*log10(length(x))
} else {
par1 <- as.numeric(par1)
}
par2 <- as.numeric(par2)
par3 <- as.numeric(par3)
par4 <- as.numeric(par4)
par5 <- as.numeric(par5)
if (par2 == 0) {
x <- log(x)
} else {
x <- (x ^ par2 - 1) / par2
}
if (par3 > 0) x <- diff(x,lag=1,difference=par3)
if (par4 > 0) x <- diff(x,lag=par5,difference=par4)
bitmap(file='pic1.png')
racf <- acf(x,par1,main='Autocorrelation',xlab='lags',ylab='ACF')
dev.off()
bitmap(file='pic2.png')
rpacf <- pacf(x,par1,main='Partial Autocorrelation',xlab='lags',ylab='PACF')
dev.off()
(myacf <- c(racf$acf))
(mypacf <- c(rpacf$acf))
lengthx <- length(x)
sqrtn <- sqrt(lengthx)
load(file='createtable')
a<-table.start()
a<-table.row.start(a)
a<-table.element(a,'Autocorrelation Function',4,TRUE)
a<-table.row.end(a)
a<-table.row.start(a)
a<-table.element(a,'Time lag k',header=TRUE)
a<-table.element(a,hyperlink('basics.htm','ACF(k)','click here for more information about the Autocorrelation Function'),header=TRUE)
a<-table.element(a,'T-STAT',header=TRUE)
a<-table.element(a,'P-value',header=TRUE)
a<-table.row.end(a)
for (i in 1:par1) {
a<-table.row.start(a)
a<-table.element(a,i-1,header=TRUE)
a<-table.element(a,round(myacf[i],6))
mytstat <- myacf[i]*sqrtn
a<-table.element(a,round(mytstat,4))
a<-table.element(a,round(1-pt(mytstat,lengthx),6))
a<-table.row.end(a)
}
a<-table.end(a)
table.save(a,file='mytable.tab')
a<-table.start()
a<-table.row.start(a)
a<-table.element(a,'Partial Autocorrelation Function',4,TRUE)
a<-table.row.end(a)
a<-table.row.start(a)
a<-table.element(a,'Time lag k',header=TRUE)
a<-table.element(a,hyperlink('basics.htm','PACF(k)','click here for more information about the Partial Autocorrelation Function'),header=TRUE)
a<-table.element(a,'T-STAT',header=TRUE)
a<-table.element(a,'P-value',header=TRUE)
a<-table.row.end(a)
for (i in 1:par1) {
a<-table.row.start(a)
a<-table.element(a,i-1,header=TRUE)
a<-table.element(a,round(mypacf[i],6))
mytstat <- mypacf[i]*sqrtn
a<-table.element(a,round(mytstat,4))
a<-table.element(a,round(1-pt(mytstat,lengthx),6))
a<-table.row.end(a)
}
a<-table.end(a)
table.save(a,file='mytable1.tab')