Free Statistics

of Irreproducible Research!

Author's title

Author*Unverified author*
R Software Modulerwasp_pairs.wasp
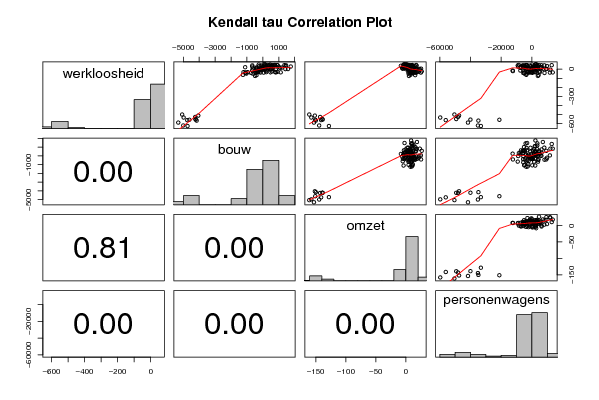
Title produced by softwareKendall tau Correlation Matrix
Date of computationThu, 29 Nov 2007 09:15:23 -0700
Cite this page as followsStatistical Computations at FreeStatistics.org, Office for Research Development and Education, URL https://freestatistics.org/blog/index.php?v=date/2007/Nov/29/t11963525810735sekeoxgu4pg.htm/, Retrieved Fri, 03 May 2024 12:17:17 +0000
Statistical Computations at FreeStatistics.org, Office for Research Development and Education, URL https://freestatistics.org/blog/index.php?pk=7537, Retrieved Fri, 03 May 2024 12:17:17 +0000
QR Codes:

Original text written by user:
IsPrivate?No (this computation is public)
User-defined keywordsbridome
Estimated Impact173
Family? (F = Feedback message, R = changed R code, M = changed R Module, P = changed Parameters, D = changed Data)
-       [Kendall tau Correlation Matrix] [workshop 3] [2007-11-29 16:15:23] [ff60737d3854dcb913eacf6907ce202b] [Current]
Feedback Forum

Post a new message
Dataseries X:
-29	915	3,9	-962
-30	765	6,6	1464
-34	1119	9,7	2220
-34	476	8,6	-996
-35	812	17,6	13555
-41	-449	15,2	8199
-32	210	8,1	5231
-37	46	24,8	11708
-36	-1095	9,5	-5027
-36	-146	10,5	-1843
-31	-316	8,8	376
-31	-474	11,6	-3018
-26	-298	15,8	2044
-28	-355	18,5	-67
-32	-1216	9,8	-2725
-26	-206	21,3	-364
-21	-417	7,2	-12384
-14	245	7,6	-12577
-14	173	7,7	-7550
-6	-60	4,4	-5554
-8	-386	8,1	587
-4	3	8,6	3879
-11	-671	4,1	1425
12	-138	0	-1422
18	284	-1,2	1651
7	-364	-5,1	34
11	-107	-6,2	414
9	-623	-5,4	-2187
15	354	-3,3	6287
22	-1115	-4	2158
18	-1	6	6173
19	-386	-2	-5752
25	622	-3,5	-7111
33	551	5,4	-5921
15	368	-1,5	-7381
10	596	6,5	622
16	-423	2,1	-4595
38	298	10,4	-6091
41	638	8,5	-3151
43	587	3,6	-5865
42	-665	5,6	-9251
40	613	2,4	-4964
48	316	-0,8	-8509
46	151	-4,6	-3922
51	463	2,5	2086
52	-262	-1,9	183
55	56	-3,2	2613
55	138	0,3	2568
46	399	5,2	4568
38	211	-8,5	2772
43	932	2,3	8064
43	1461	-2,4	-3096
44	722	-0,6	6203
45	1348	10	12893
35	-227	3,9	9827
36	505	7,9	1945
36	1415	11	3538
25	126	5,1	-4008
31	48	11,7	869
35	189	10,9	-643
46	894	10,3	-3478
47	753	16,9	3396
40	-100	17,6	-1357
29	-672	9,8	3982
28	521	11,6	-4510
29	-31	7,4	-8947
29	992	15,6	-5162
30	1750	8,5	2268
26	31	12,2	5690
27	240	7,2	1266
18	1188	12,8	3483
15	1070	11	1803
1	120	-0,3	-2086
1	491	11,5	1979
2	1412	8,7	-4122
2	1577	18,2	7110
1	565	16,8	9361
-4	813	23	12022
1	-32	8,2	3006
6	-415	25,1	9400
4	-20	22,1	-2944
-1	473	15,8	2957
-3	-214	14,6	-126
-8	-204	9,9	-452
-24	568	26,2	4634
-29	-319	14,3	-816
-40	-1086	11	238
-32	-956	11,2	-2426
-41	-742	7,9	-5634
-48	-1036	4,3	-4817
-48	-636	8,6	-3467
-62	-1255	7,4	-3673
-74	-487	4,9	3856
-65	-399	15,3	4355
-626	-4733	-128,1	-33253
-620	-5004	-144,3	-35193
-588	-5318,1	-153	-41668
-566	-4161,4	-149,9	-34865
-557	-4623,3	-150,9	-21210
-561	-4754,4	-141	-56126
-549	-4234,4	-138,9	-49321
-532	-4980,8	-157,4	-59723
-526	-4252,9	-142,7	-48103
-511	-4059,2	-151,5	-47472
-499	-5074,5	-160,8	-50497
-555	-4225,5	-138,6	-40059


Summary of compuational transaction
Raw Inputview raw input (R code)
Raw Outputview raw output of R engine
Computing time3 seconds
R Server'Herman Ole Andreas Wold' @ 193.190.124.10:1001

\begin{tabular}{lllllllll}
\hline
Summary of compuational transaction \tabularnewline
Raw Input & view raw input (R code)  \tabularnewline
Raw Output & view raw output of R engine  \tabularnewline
Computing time & 3 seconds \tabularnewline
R Server & 'Herman Ole Andreas Wold' @ 193.190.124.10:1001 \tabularnewline
\hline
\end{tabular}
%Source: https://freestatistics.org/blog/index.php?pk=7537&T=0

[TABLE]
[ROW][C]Summary of compuational transaction[/C][/ROW]
[ROW][C]Raw Input[/C][C]view raw input (R code) [/C][/ROW]
[ROW][C]Raw Output[/C][C]view raw output of R engine [/C][/ROW]
[ROW][C]Computing time[/C][C]3 seconds[/C][/ROW]
[ROW][C]R Server[/C][C]'Herman Ole Andreas Wold' @ 193.190.124.10:1001[/C][/ROW]
[/TABLE]
Source: https://freestatistics.org/blog/index.php?pk=7537&T=0

Globally Unique Identifier (entire table): ba.freestatistics.org/blog/index.php?pk=7537&T=0

As an alternative you can also use a QR Code:  

The GUIDs for individual cells are displayed in the table below:

Summary of compuational transaction
Raw Inputview raw input (R code)
Raw Outputview raw output of R engine
Computing time3 seconds
R Server'Herman Ole Andreas Wold' @ 193.190.124.10:1001


Kendall tau rank correlations for all pairs of data series
pairtaup-value
tau( werkloosheid , bouw )0.4457099709696241.50939261089889e-11
tau( werkloosheid , omzet )0.01625579867863240.805870151199646
tau( werkloosheid , personenwagens )0.1976747211625480.00276625511961526
tau( bouw , omzet )0.2411592226512390.000253777378239617
tau( bouw , personenwagens )0.3098211891382462.52011070211999e-06
tau( omzet , personenwagens )0.3543282419293197.62985690183626e-08

\begin{tabular}{lllllllll}
\hline
Kendall tau rank correlations for all pairs of data series \tabularnewline
pair & tau & p-value \tabularnewline
tau( werkloosheid , bouw ) & 0.445709970969624 & 1.50939261089889e-11 \tabularnewline
tau( werkloosheid , omzet ) & 0.0162557986786324 & 0.805870151199646 \tabularnewline
tau( werkloosheid , personenwagens ) & 0.197674721162548 & 0.00276625511961526 \tabularnewline
tau( bouw , omzet ) & 0.241159222651239 & 0.000253777378239617 \tabularnewline
tau( bouw , personenwagens ) & 0.309821189138246 & 2.52011070211999e-06 \tabularnewline
tau( omzet , personenwagens ) & 0.354328241929319 & 7.62985690183626e-08 \tabularnewline
\hline
\end{tabular}
%Source: https://freestatistics.org/blog/index.php?pk=7537&T=1

[TABLE]
[ROW][C]Kendall tau rank correlations for all pairs of data series[/C][/ROW]
[ROW][C]pair[/C][C]tau[/C][C]p-value[/C][/ROW]
[ROW][C]tau( werkloosheid , bouw )[/C][C]0.445709970969624[/C][C]1.50939261089889e-11[/C][/ROW]
[ROW][C]tau( werkloosheid , omzet )[/C][C]0.0162557986786324[/C][C]0.805870151199646[/C][/ROW]
[ROW][C]tau( werkloosheid , personenwagens )[/C][C]0.197674721162548[/C][C]0.00276625511961526[/C][/ROW]
[ROW][C]tau( bouw , omzet )[/C][C]0.241159222651239[/C][C]0.000253777378239617[/C][/ROW]
[ROW][C]tau( bouw , personenwagens )[/C][C]0.309821189138246[/C][C]2.52011070211999e-06[/C][/ROW]
[ROW][C]tau( omzet , personenwagens )[/C][C]0.354328241929319[/C][C]7.62985690183626e-08[/C][/ROW]
[/TABLE]
Source: https://freestatistics.org/blog/index.php?pk=7537&T=1

Globally Unique Identifier (entire table): ba.freestatistics.org/blog/index.php?pk=7537&T=1

As an alternative you can also use a QR Code:  

The GUIDs for individual cells are displayed in the table below:

Kendall tau rank correlations for all pairs of data series
pairtaup-value
tau( werkloosheid , bouw )0.4457099709696241.50939261089889e-11
tau( werkloosheid , omzet )0.01625579867863240.805870151199646
tau( werkloosheid , personenwagens )0.1976747211625480.00276625511961526
tau( bouw , omzet )0.2411592226512390.000253777378239617
tau( bouw , personenwagens )0.3098211891382462.52011070211999e-06
tau( omzet , personenwagens )0.3543282419293197.62985690183626e-08


Parameters (Session):
Parameters (R input):
R code (references can be found in the software module):
panel.tau <- function(x, y, digits=2, prefix='', cex.cor)
{
usr <- par('usr'); on.exit(par(usr))
par(usr = c(0, 1, 0, 1))
rr <- cor.test(x, y, method='kendall')
r <- round(rr$p.value,2)
txt <- format(c(r, 0.123456789), digits=digits)[1]
txt <- paste(prefix, txt, sep='')
if(missing(cex.cor)) cex <- 0.5/strwidth(txt)
text(0.5, 0.5, txt, cex = cex)
}
panel.hist <- function(x, ...)
{
usr <- par('usr'); on.exit(par(usr))
par(usr = c(usr[1:2], 0, 1.5) )
h <- hist(x, plot = FALSE)
breaks <- h$breaks; nB <- length(breaks)
y <- h$counts; y <- y/max(y)
rect(breaks[-nB], 0, breaks[-1], y, col='grey', ...)
}
bitmap(file='test1.png')
pairs(t(y),diag.panel=panel.hist, upper.panel=panel.smooth, lower.panel=panel.tau, main=main)
dev.off()
load(file='createtable')
a<-table.start()
a<-table.row.start(a)
a<-table.element(a,'Kendall tau rank correlations for all pairs of data series',3,TRUE)
a<-table.row.end(a)
a<-table.row.start(a)
a<-table.element(a,'pair',1,TRUE)
a<-table.element(a,'tau',1,TRUE)
a<-table.element(a,'p-value',1,TRUE)
a<-table.row.end(a)
n <- length(y[,1])
n
cor.test(y[1,],y[2,],method='kendall')
for (i in 1:(n-1))
{
for (j in (i+1):n)
{
a<-table.row.start(a)
dum <- paste('tau(',dimnames(t(x))[[2]][i])
dum <- paste(dum,',')
dum <- paste(dum,dimnames(t(x))[[2]][j])
dum <- paste(dum,')')
a<-table.element(a,dum,header=TRUE)
r <- cor.test(y[i,],y[j,],method='kendall')
a<-table.element(a,r$estimate)
a<-table.element(a,r$p.value)
a<-table.row.end(a)
}
}
a<-table.end(a)
table.save(a,file='mytable.tab')