Free Statistics

of Irreproducible Research!

Author's title

Author*Unverified author*
R Software Modulerwasp_autocorrelation.wasp
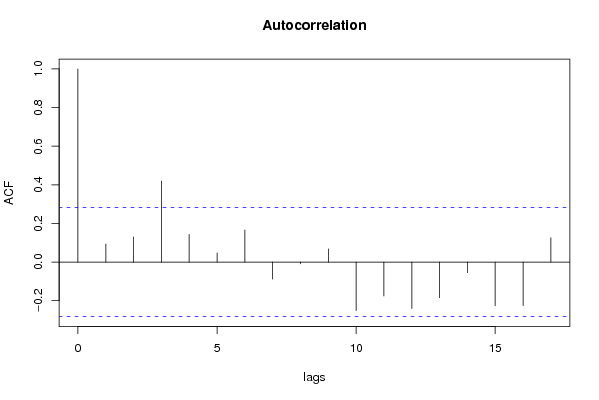
Title produced by software(Partial) Autocorrelation Function
Date of computationThu, 29 Nov 2007 05:15:01 -0700
Cite this page as followsStatistical Computations at FreeStatistics.org, Office for Research Development and Education, URL https://freestatistics.org/blog/index.php?v=date/2007/Nov/29/t1196337869qqp5haop7hksre9.htm/, Retrieved Fri, 03 May 2024 06:33:26 +0000
Statistical Computations at FreeStatistics.org, Office for Research Development and Education, URL https://freestatistics.org/blog/index.php?pk=7449, Retrieved Fri, 03 May 2024 06:33:26 +0000
QR Codes:

Original text written by user:
IsPrivate?No (this computation is public)
User-defined keywords
Estimated Impact162
Family? (F = Feedback message, R = changed R code, M = changed R Module, P = changed Parameters, D = changed Data)
-       [(Partial) Autocorrelation Function] [tot industriële p...] [2007-11-29 12:15:01] [dd38921fafddee0dfc20da83e9650a2a] [Current]
Feedback Forum

Post a new message
Dataseries X:
359
304.6
297.7
303.3
304.7
331.3
318.8
306.8
331.1
284.1
259.7
335.8
338.5
310.3
322.1
289.3
300.8
360.6
327.3
304.1
362
287.8
286.1
358.2
346
329.9
334.3
303.7
307.6
351.7
324.6
311.9
361.5
271.1
286.5
352.8
322.4
335
322.2
313.6
323.3
379.1
315.6
353.6
371.7
282.9
298.8
361.8
365.9
357.6
335.4
340.1
337.8
389.6
342.5
354.6
391.6
317.7
312.8
356.2


Summary of compuational transaction
Raw Inputview raw input (R code)
Raw Outputview raw output of R engine
Computing time3 seconds
R Server'Herman Ole Andreas Wold' @ 193.190.124.10:1001

\begin{tabular}{lllllllll}
\hline
Summary of compuational transaction \tabularnewline
Raw Input & view raw input (R code)  \tabularnewline
Raw Output & view raw output of R engine  \tabularnewline
Computing time & 3 seconds \tabularnewline
R Server & 'Herman Ole Andreas Wold' @ 193.190.124.10:1001 \tabularnewline
\hline
\end{tabular}
%Source: https://freestatistics.org/blog/index.php?pk=7449&T=0

[TABLE]
[ROW][C]Summary of compuational transaction[/C][/ROW]
[ROW][C]Raw Input[/C][C]view raw input (R code) [/C][/ROW]
[ROW][C]Raw Output[/C][C]view raw output of R engine [/C][/ROW]
[ROW][C]Computing time[/C][C]3 seconds[/C][/ROW]
[ROW][C]R Server[/C][C]'Herman Ole Andreas Wold' @ 193.190.124.10:1001[/C][/ROW]
[/TABLE]
Source: https://freestatistics.org/blog/index.php?pk=7449&T=0

Globally Unique Identifier (entire table): ba.freestatistics.org/blog/index.php?pk=7449&T=0

As an alternative you can also use a QR Code:  

The GUIDs for individual cells are displayed in the table below:

Summary of compuational transaction
Raw Inputview raw input (R code)
Raw Outputview raw output of R engine
Computing time3 seconds
R Server'Herman Ole Andreas Wold' @ 193.190.124.10:1001


Autocorrelation Function
Time lag kACF(k)T-STATP-value
016.92820
10.0930150.64440.261183
20.1301920.9020.185782
30.4196752.90760.00275
40.1428880.990.16358
50.0471070.32640.372784
60.165811.14880.128173
7-0.088048-0.610.727635
8-0.009373-0.06490.525753
90.0679220.47060.320038
10-0.251437-1.7420.956044
11-0.175376-1.2150.884854
12-0.240532-1.66650.948932
13-0.18496-1.28140.896903
14-0.055476-0.38430.648791
15-0.226843-1.57160.938695
16-0.225468-1.56210.937582

\begin{tabular}{lllllllll}
\hline
Autocorrelation Function \tabularnewline
Time lag k & ACF(k) & T-STAT & P-value \tabularnewline
0 & 1 & 6.9282 & 0 \tabularnewline
1 & 0.093015 & 0.6444 & 0.261183 \tabularnewline
2 & 0.130192 & 0.902 & 0.185782 \tabularnewline
3 & 0.419675 & 2.9076 & 0.00275 \tabularnewline
4 & 0.142888 & 0.99 & 0.16358 \tabularnewline
5 & 0.047107 & 0.3264 & 0.372784 \tabularnewline
6 & 0.16581 & 1.1488 & 0.128173 \tabularnewline
7 & -0.088048 & -0.61 & 0.727635 \tabularnewline
8 & -0.009373 & -0.0649 & 0.525753 \tabularnewline
9 & 0.067922 & 0.4706 & 0.320038 \tabularnewline
10 & -0.251437 & -1.742 & 0.956044 \tabularnewline
11 & -0.175376 & -1.215 & 0.884854 \tabularnewline
12 & -0.240532 & -1.6665 & 0.948932 \tabularnewline
13 & -0.18496 & -1.2814 & 0.896903 \tabularnewline
14 & -0.055476 & -0.3843 & 0.648791 \tabularnewline
15 & -0.226843 & -1.5716 & 0.938695 \tabularnewline
16 & -0.225468 & -1.5621 & 0.937582 \tabularnewline
\hline
\end{tabular}
%Source: https://freestatistics.org/blog/index.php?pk=7449&T=1

[TABLE]
[ROW][C]Autocorrelation Function[/C][/ROW]
[ROW][C]Time lag k[/C][C]ACF(k)[/C][C]T-STAT[/C][C]P-value[/C][/ROW]
[ROW][C]0[/C][C]1[/C][C]6.9282[/C][C]0[/C][/ROW]
[ROW][C]1[/C][C]0.093015[/C][C]0.6444[/C][C]0.261183[/C][/ROW]
[ROW][C]2[/C][C]0.130192[/C][C]0.902[/C][C]0.185782[/C][/ROW]
[ROW][C]3[/C][C]0.419675[/C][C]2.9076[/C][C]0.00275[/C][/ROW]
[ROW][C]4[/C][C]0.142888[/C][C]0.99[/C][C]0.16358[/C][/ROW]
[ROW][C]5[/C][C]0.047107[/C][C]0.3264[/C][C]0.372784[/C][/ROW]
[ROW][C]6[/C][C]0.16581[/C][C]1.1488[/C][C]0.128173[/C][/ROW]
[ROW][C]7[/C][C]-0.088048[/C][C]-0.61[/C][C]0.727635[/C][/ROW]
[ROW][C]8[/C][C]-0.009373[/C][C]-0.0649[/C][C]0.525753[/C][/ROW]
[ROW][C]9[/C][C]0.067922[/C][C]0.4706[/C][C]0.320038[/C][/ROW]
[ROW][C]10[/C][C]-0.251437[/C][C]-1.742[/C][C]0.956044[/C][/ROW]
[ROW][C]11[/C][C]-0.175376[/C][C]-1.215[/C][C]0.884854[/C][/ROW]
[ROW][C]12[/C][C]-0.240532[/C][C]-1.6665[/C][C]0.948932[/C][/ROW]
[ROW][C]13[/C][C]-0.18496[/C][C]-1.2814[/C][C]0.896903[/C][/ROW]
[ROW][C]14[/C][C]-0.055476[/C][C]-0.3843[/C][C]0.648791[/C][/ROW]
[ROW][C]15[/C][C]-0.226843[/C][C]-1.5716[/C][C]0.938695[/C][/ROW]
[ROW][C]16[/C][C]-0.225468[/C][C]-1.5621[/C][C]0.937582[/C][/ROW]
[/TABLE]
Source: https://freestatistics.org/blog/index.php?pk=7449&T=1

Globally Unique Identifier (entire table): ba.freestatistics.org/blog/index.php?pk=7449&T=1

As an alternative you can also use a QR Code:  

The GUIDs for individual cells are displayed in the table below:

Autocorrelation Function
Time lag kACF(k)T-STATP-value
016.92820
10.0930150.64440.261183
20.1301920.9020.185782
30.4196752.90760.00275
40.1428880.990.16358
50.0471070.32640.372784
60.165811.14880.128173
7-0.088048-0.610.727635
8-0.009373-0.06490.525753
90.0679220.47060.320038
10-0.251437-1.7420.956044
11-0.175376-1.2150.884854
12-0.240532-1.66650.948932
13-0.18496-1.28140.896903
14-0.055476-0.38430.648791
15-0.226843-1.57160.938695
16-0.225468-1.56210.937582


Partial Autocorrelation Function
Time lag kPACF(k)T-STATP-value
00.0930150.64440.261183
10.1226010.84940.199937
20.4072382.82140.003467
30.0983130.68110.249531
4-0.058608-0.4060.656743
5-0.034624-0.23990.594278
6-0.229792-1.5920.941031
7-0.046321-0.32090.62517
80.0549010.38040.352676
9-0.179252-1.24190.889845
10-0.156386-1.08350.857994
11-0.328505-2.2760.986325
12-0.007696-0.05330.52115
130.2538331.75860.042509
140.0890.61660.270204
15-0.081355-0.56360.71219
160.092880.64350.261485

\begin{tabular}{lllllllll}
\hline
Partial Autocorrelation Function \tabularnewline
Time lag k & PACF(k) & T-STAT & P-value \tabularnewline
0 & 0.093015 & 0.6444 & 0.261183 \tabularnewline
1 & 0.122601 & 0.8494 & 0.199937 \tabularnewline
2 & 0.407238 & 2.8214 & 0.003467 \tabularnewline
3 & 0.098313 & 0.6811 & 0.249531 \tabularnewline
4 & -0.058608 & -0.406 & 0.656743 \tabularnewline
5 & -0.034624 & -0.2399 & 0.594278 \tabularnewline
6 & -0.229792 & -1.592 & 0.941031 \tabularnewline
7 & -0.046321 & -0.3209 & 0.62517 \tabularnewline
8 & 0.054901 & 0.3804 & 0.352676 \tabularnewline
9 & -0.179252 & -1.2419 & 0.889845 \tabularnewline
10 & -0.156386 & -1.0835 & 0.857994 \tabularnewline
11 & -0.328505 & -2.276 & 0.986325 \tabularnewline
12 & -0.007696 & -0.0533 & 0.52115 \tabularnewline
13 & 0.253833 & 1.7586 & 0.042509 \tabularnewline
14 & 0.089 & 0.6166 & 0.270204 \tabularnewline
15 & -0.081355 & -0.5636 & 0.71219 \tabularnewline
16 & 0.09288 & 0.6435 & 0.261485 \tabularnewline
\hline
\end{tabular}
%Source: https://freestatistics.org/blog/index.php?pk=7449&T=2

[TABLE]
[ROW][C]Partial Autocorrelation Function[/C][/ROW]
[ROW][C]Time lag k[/C][C]PACF(k)[/C][C]T-STAT[/C][C]P-value[/C][/ROW]
[ROW][C]0[/C][C]0.093015[/C][C]0.6444[/C][C]0.261183[/C][/ROW]
[ROW][C]1[/C][C]0.122601[/C][C]0.8494[/C][C]0.199937[/C][/ROW]
[ROW][C]2[/C][C]0.407238[/C][C]2.8214[/C][C]0.003467[/C][/ROW]
[ROW][C]3[/C][C]0.098313[/C][C]0.6811[/C][C]0.249531[/C][/ROW]
[ROW][C]4[/C][C]-0.058608[/C][C]-0.406[/C][C]0.656743[/C][/ROW]
[ROW][C]5[/C][C]-0.034624[/C][C]-0.2399[/C][C]0.594278[/C][/ROW]
[ROW][C]6[/C][C]-0.229792[/C][C]-1.592[/C][C]0.941031[/C][/ROW]
[ROW][C]7[/C][C]-0.046321[/C][C]-0.3209[/C][C]0.62517[/C][/ROW]
[ROW][C]8[/C][C]0.054901[/C][C]0.3804[/C][C]0.352676[/C][/ROW]
[ROW][C]9[/C][C]-0.179252[/C][C]-1.2419[/C][C]0.889845[/C][/ROW]
[ROW][C]10[/C][C]-0.156386[/C][C]-1.0835[/C][C]0.857994[/C][/ROW]
[ROW][C]11[/C][C]-0.328505[/C][C]-2.276[/C][C]0.986325[/C][/ROW]
[ROW][C]12[/C][C]-0.007696[/C][C]-0.0533[/C][C]0.52115[/C][/ROW]
[ROW][C]13[/C][C]0.253833[/C][C]1.7586[/C][C]0.042509[/C][/ROW]
[ROW][C]14[/C][C]0.089[/C][C]0.6166[/C][C]0.270204[/C][/ROW]
[ROW][C]15[/C][C]-0.081355[/C][C]-0.5636[/C][C]0.71219[/C][/ROW]
[ROW][C]16[/C][C]0.09288[/C][C]0.6435[/C][C]0.261485[/C][/ROW]
[/TABLE]
Source: https://freestatistics.org/blog/index.php?pk=7449&T=2

Globally Unique Identifier (entire table): ba.freestatistics.org/blog/index.php?pk=7449&T=2

As an alternative you can also use a QR Code:  

The GUIDs for individual cells are displayed in the table below:

Partial Autocorrelation Function
Time lag kPACF(k)T-STATP-value
00.0930150.64440.261183
10.1226010.84940.199937
20.4072382.82140.003467
30.0983130.68110.249531
4-0.058608-0.4060.656743
5-0.034624-0.23990.594278
6-0.229792-1.5920.941031
7-0.046321-0.32090.62517
80.0549010.38040.352676
9-0.179252-1.24190.889845
10-0.156386-1.08350.857994
11-0.328505-2.2760.986325
12-0.007696-0.05330.52115
130.2538331.75860.042509
140.0890.61660.270204
15-0.081355-0.56360.71219
160.092880.64350.261485


Parameters (Session):
par1 = Default ; par2 = 1 ; par3 = 1 ; par4 = 1 ; par5 = 12 ;
Parameters (R input):
par1 = Default ; par2 = 1 ; par3 = 0 ; par4 = 1 ; par5 = 12 ;
R code (references can be found in the software module):
if (par1 == 'Default') {
par1 = 10*log10(length(x))
} else {
par1 <- as.numeric(par1)
}
par2 <- as.numeric(par2)
par3 <- as.numeric(par3)
par4 <- as.numeric(par4)
par5 <- as.numeric(par5)
if (par2 == 0) {
x <- log(x)
} else {
x <- (x ^ par2 - 1) / par2
}
if (par3 > 0) x <- diff(x,lag=1,difference=par3)
if (par4 > 0) x <- diff(x,lag=par5,difference=par4)
bitmap(file='pic1.png')
racf <- acf(x,par1,main='Autocorrelation',xlab='lags',ylab='ACF')
dev.off()
bitmap(file='pic2.png')
rpacf <- pacf(x,par1,main='Partial Autocorrelation',xlab='lags',ylab='PACF')
dev.off()
(myacf <- c(racf$acf))
(mypacf <- c(rpacf$acf))
lengthx <- length(x)
sqrtn <- sqrt(lengthx)
load(file='createtable')
a<-table.start()
a<-table.row.start(a)
a<-table.element(a,'Autocorrelation Function',4,TRUE)
a<-table.row.end(a)
a<-table.row.start(a)
a<-table.element(a,'Time lag k',header=TRUE)
a<-table.element(a,hyperlink('basics.htm','ACF(k)','click here for more information about the Autocorrelation Function'),header=TRUE)
a<-table.element(a,'T-STAT',header=TRUE)
a<-table.element(a,'P-value',header=TRUE)
a<-table.row.end(a)
for (i in 1:par1) {
a<-table.row.start(a)
a<-table.element(a,i-1,header=TRUE)
a<-table.element(a,round(myacf[i],6))
mytstat <- myacf[i]*sqrtn
a<-table.element(a,round(mytstat,4))
a<-table.element(a,round(1-pt(mytstat,lengthx),6))
a<-table.row.end(a)
}
a<-table.end(a)
table.save(a,file='mytable.tab')
a<-table.start()
a<-table.row.start(a)
a<-table.element(a,'Partial Autocorrelation Function',4,TRUE)
a<-table.row.end(a)
a<-table.row.start(a)
a<-table.element(a,'Time lag k',header=TRUE)
a<-table.element(a,hyperlink('basics.htm','PACF(k)','click here for more information about the Partial Autocorrelation Function'),header=TRUE)
a<-table.element(a,'T-STAT',header=TRUE)
a<-table.element(a,'P-value',header=TRUE)
a<-table.row.end(a)
for (i in 1:par1) {
a<-table.row.start(a)
a<-table.element(a,i-1,header=TRUE)
a<-table.element(a,round(mypacf[i],6))
mytstat <- mypacf[i]*sqrtn
a<-table.element(a,round(mytstat,4))
a<-table.element(a,round(1-pt(mytstat,lengthx),6))
a<-table.row.end(a)
}
a<-table.end(a)
table.save(a,file='mytable1.tab')