Free Statistics

of Irreproducible Research!

Author's title

Author*Unverified author*
R Software Modulerwasp_autocorrelation.wasp
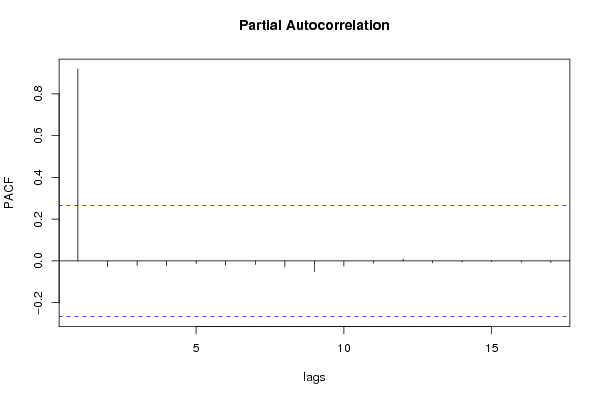
Title produced by software(Partial) Autocorrelation Function
Date of computationThu, 29 Nov 2007 04:45:52 -0700
Cite this page as followsStatistical Computations at FreeStatistics.org, Office for Research Development and Education, URL https://freestatistics.org/blog/index.php?v=date/2007/Nov/29/t11963361454ym05ctkghcvy6k.htm/, Retrieved Fri, 03 May 2024 13:14:48 +0000
Statistical Computations at FreeStatistics.org, Office for Research Development and Education, URL https://freestatistics.org/blog/index.php?pk=7438, Retrieved Fri, 03 May 2024 13:14:48 +0000
QR Codes:

Original text written by user:
IsPrivate?No (this computation is public)
User-defined keywords
Estimated Impact150
Family? (F = Feedback message, R = changed R code, M = changed R Module, P = changed Parameters, D = changed Data)
-       [(Partial) Autocorrelation Function] [autocorr tot. bev...] [2007-11-29 11:45:52] [dd38921fafddee0dfc20da83e9650a2a] [Current]
Feedback Forum

Post a new message
Dataseries X:
8.798
8.841
8.896
8.951
9.027
9.079
9.129
9.178
9.190
9.251
9.328
9.428
9.499
9.556
9.606
9.632
9.660
9.651
9.695
9.727
9.757
9.788
9.813
9.823
9.837
9.842
9.855
9.863
9.855
9.858
9.853
9.858
9.859
9.865
9.876
9.928
9.948
9.987
10.022
10.068
10.101
10.131
10.143
10.170
10.192
10.214
10.239
10.263
10.310
10.355
10.396
10.446
10.511
10.585


Summary of compuational transaction
Raw Inputview raw input (R code)
Raw Outputview raw output of R engine
Computing time3 seconds
R Server'Herman Ole Andreas Wold' @ 193.190.124.10:1001

\begin{tabular}{lllllllll}
\hline
Summary of compuational transaction \tabularnewline
Raw Input & view raw input (R code)  \tabularnewline
Raw Output & view raw output of R engine  \tabularnewline
Computing time & 3 seconds \tabularnewline
R Server & 'Herman Ole Andreas Wold' @ 193.190.124.10:1001 \tabularnewline
\hline
\end{tabular}
%Source: https://freestatistics.org/blog/index.php?pk=7438&T=0

[TABLE]
[ROW][C]Summary of compuational transaction[/C][/ROW]
[ROW][C]Raw Input[/C][C]view raw input (R code) [/C][/ROW]
[ROW][C]Raw Output[/C][C]view raw output of R engine [/C][/ROW]
[ROW][C]Computing time[/C][C]3 seconds[/C][/ROW]
[ROW][C]R Server[/C][C]'Herman Ole Andreas Wold' @ 193.190.124.10:1001[/C][/ROW]
[/TABLE]
Source: https://freestatistics.org/blog/index.php?pk=7438&T=0

Globally Unique Identifier (entire table): ba.freestatistics.org/blog/index.php?pk=7438&T=0

As an alternative you can also use a QR Code:  

The GUIDs for individual cells are displayed in the table below:

Summary of compuational transaction
Raw Inputview raw input (R code)
Raw Outputview raw output of R engine
Computing time3 seconds
R Server'Herman Ole Andreas Wold' @ 193.190.124.10:1001


Autocorrelation Function
Time lag kACF(k)T-STATP-value
017.34850
10.9195326.75720
20.8413086.18230
30.7663215.63130
40.6942275.10152e-06
50.6267744.60581.3e-05
60.5624444.13316.3e-05
70.501583.68580.000265
80.4423473.25060.000993
90.3813482.80230.003515
100.3230872.37420.010586
110.2696621.98160.026312
120.2240181.64620.052767
130.1826511.34220.092572
140.1458711.07190.144259
150.1134510.83370.204063
160.0843950.62020.268875

\begin{tabular}{lllllllll}
\hline
Autocorrelation Function \tabularnewline
Time lag k & ACF(k) & T-STAT & P-value \tabularnewline
0 & 1 & 7.3485 & 0 \tabularnewline
1 & 0.919532 & 6.7572 & 0 \tabularnewline
2 & 0.841308 & 6.1823 & 0 \tabularnewline
3 & 0.766321 & 5.6313 & 0 \tabularnewline
4 & 0.694227 & 5.1015 & 2e-06 \tabularnewline
5 & 0.626774 & 4.6058 & 1.3e-05 \tabularnewline
6 & 0.562444 & 4.1331 & 6.3e-05 \tabularnewline
7 & 0.50158 & 3.6858 & 0.000265 \tabularnewline
8 & 0.442347 & 3.2506 & 0.000993 \tabularnewline
9 & 0.381348 & 2.8023 & 0.003515 \tabularnewline
10 & 0.323087 & 2.3742 & 0.010586 \tabularnewline
11 & 0.269662 & 1.9816 & 0.026312 \tabularnewline
12 & 0.224018 & 1.6462 & 0.052767 \tabularnewline
13 & 0.182651 & 1.3422 & 0.092572 \tabularnewline
14 & 0.145871 & 1.0719 & 0.144259 \tabularnewline
15 & 0.113451 & 0.8337 & 0.204063 \tabularnewline
16 & 0.084395 & 0.6202 & 0.268875 \tabularnewline
\hline
\end{tabular}
%Source: https://freestatistics.org/blog/index.php?pk=7438&T=1

[TABLE]
[ROW][C]Autocorrelation Function[/C][/ROW]
[ROW][C]Time lag k[/C][C]ACF(k)[/C][C]T-STAT[/C][C]P-value[/C][/ROW]
[ROW][C]0[/C][C]1[/C][C]7.3485[/C][C]0[/C][/ROW]
[ROW][C]1[/C][C]0.919532[/C][C]6.7572[/C][C]0[/C][/ROW]
[ROW][C]2[/C][C]0.841308[/C][C]6.1823[/C][C]0[/C][/ROW]
[ROW][C]3[/C][C]0.766321[/C][C]5.6313[/C][C]0[/C][/ROW]
[ROW][C]4[/C][C]0.694227[/C][C]5.1015[/C][C]2e-06[/C][/ROW]
[ROW][C]5[/C][C]0.626774[/C][C]4.6058[/C][C]1.3e-05[/C][/ROW]
[ROW][C]6[/C][C]0.562444[/C][C]4.1331[/C][C]6.3e-05[/C][/ROW]
[ROW][C]7[/C][C]0.50158[/C][C]3.6858[/C][C]0.000265[/C][/ROW]
[ROW][C]8[/C][C]0.442347[/C][C]3.2506[/C][C]0.000993[/C][/ROW]
[ROW][C]9[/C][C]0.381348[/C][C]2.8023[/C][C]0.003515[/C][/ROW]
[ROW][C]10[/C][C]0.323087[/C][C]2.3742[/C][C]0.010586[/C][/ROW]
[ROW][C]11[/C][C]0.269662[/C][C]1.9816[/C][C]0.026312[/C][/ROW]
[ROW][C]12[/C][C]0.224018[/C][C]1.6462[/C][C]0.052767[/C][/ROW]
[ROW][C]13[/C][C]0.182651[/C][C]1.3422[/C][C]0.092572[/C][/ROW]
[ROW][C]14[/C][C]0.145871[/C][C]1.0719[/C][C]0.144259[/C][/ROW]
[ROW][C]15[/C][C]0.113451[/C][C]0.8337[/C][C]0.204063[/C][/ROW]
[ROW][C]16[/C][C]0.084395[/C][C]0.6202[/C][C]0.268875[/C][/ROW]
[/TABLE]
Source: https://freestatistics.org/blog/index.php?pk=7438&T=1

Globally Unique Identifier (entire table): ba.freestatistics.org/blog/index.php?pk=7438&T=1

As an alternative you can also use a QR Code:  

The GUIDs for individual cells are displayed in the table below:

Autocorrelation Function
Time lag kACF(k)T-STATP-value
017.34850
10.9195326.75720
20.8413086.18230
30.7663215.63130
40.6942275.10152e-06
50.6267744.60581.3e-05
60.5624444.13316.3e-05
70.501583.68580.000265
80.4423473.25060.000993
90.3813482.80230.003515
100.3230872.37420.010586
110.2696621.98160.026312
120.2240181.64620.052767
130.1826511.34220.092572
140.1458711.07190.144259
150.1134510.83370.204063
160.0843950.62020.268875


Partial Autocorrelation Function
Time lag kPACF(k)T-STATP-value
00.9195326.75720
1-0.027391-0.20130.579383
2-0.02133-0.15670.561985
3-0.023193-0.17040.567347
4-0.011674-0.08580.534023
5-0.02002-0.14710.558205
6-0.017151-0.1260.549913
7-0.02826-0.20770.581864
8-0.050644-0.37220.644384
9-0.024702-0.18150.571682
10-0.011132-0.08180.532448
110.0097670.07180.471525
12-0.009076-0.06670.526466
13-0.004488-0.0330.513093
14-0.00345-0.02540.510067
15-0.006484-0.04760.518913
16-0.007403-0.05440.521592

\begin{tabular}{lllllllll}
\hline
Partial Autocorrelation Function \tabularnewline
Time lag k & PACF(k) & T-STAT & P-value \tabularnewline
0 & 0.919532 & 6.7572 & 0 \tabularnewline
1 & -0.027391 & -0.2013 & 0.579383 \tabularnewline
2 & -0.02133 & -0.1567 & 0.561985 \tabularnewline
3 & -0.023193 & -0.1704 & 0.567347 \tabularnewline
4 & -0.011674 & -0.0858 & 0.534023 \tabularnewline
5 & -0.02002 & -0.1471 & 0.558205 \tabularnewline
6 & -0.017151 & -0.126 & 0.549913 \tabularnewline
7 & -0.02826 & -0.2077 & 0.581864 \tabularnewline
8 & -0.050644 & -0.3722 & 0.644384 \tabularnewline
9 & -0.024702 & -0.1815 & 0.571682 \tabularnewline
10 & -0.011132 & -0.0818 & 0.532448 \tabularnewline
11 & 0.009767 & 0.0718 & 0.471525 \tabularnewline
12 & -0.009076 & -0.0667 & 0.526466 \tabularnewline
13 & -0.004488 & -0.033 & 0.513093 \tabularnewline
14 & -0.00345 & -0.0254 & 0.510067 \tabularnewline
15 & -0.006484 & -0.0476 & 0.518913 \tabularnewline
16 & -0.007403 & -0.0544 & 0.521592 \tabularnewline
\hline
\end{tabular}
%Source: https://freestatistics.org/blog/index.php?pk=7438&T=2

[TABLE]
[ROW][C]Partial Autocorrelation Function[/C][/ROW]
[ROW][C]Time lag k[/C][C]PACF(k)[/C][C]T-STAT[/C][C]P-value[/C][/ROW]
[ROW][C]0[/C][C]0.919532[/C][C]6.7572[/C][C]0[/C][/ROW]
[ROW][C]1[/C][C]-0.027391[/C][C]-0.2013[/C][C]0.579383[/C][/ROW]
[ROW][C]2[/C][C]-0.02133[/C][C]-0.1567[/C][C]0.561985[/C][/ROW]
[ROW][C]3[/C][C]-0.023193[/C][C]-0.1704[/C][C]0.567347[/C][/ROW]
[ROW][C]4[/C][C]-0.011674[/C][C]-0.0858[/C][C]0.534023[/C][/ROW]
[ROW][C]5[/C][C]-0.02002[/C][C]-0.1471[/C][C]0.558205[/C][/ROW]
[ROW][C]6[/C][C]-0.017151[/C][C]-0.126[/C][C]0.549913[/C][/ROW]
[ROW][C]7[/C][C]-0.02826[/C][C]-0.2077[/C][C]0.581864[/C][/ROW]
[ROW][C]8[/C][C]-0.050644[/C][C]-0.3722[/C][C]0.644384[/C][/ROW]
[ROW][C]9[/C][C]-0.024702[/C][C]-0.1815[/C][C]0.571682[/C][/ROW]
[ROW][C]10[/C][C]-0.011132[/C][C]-0.0818[/C][C]0.532448[/C][/ROW]
[ROW][C]11[/C][C]0.009767[/C][C]0.0718[/C][C]0.471525[/C][/ROW]
[ROW][C]12[/C][C]-0.009076[/C][C]-0.0667[/C][C]0.526466[/C][/ROW]
[ROW][C]13[/C][C]-0.004488[/C][C]-0.033[/C][C]0.513093[/C][/ROW]
[ROW][C]14[/C][C]-0.00345[/C][C]-0.0254[/C][C]0.510067[/C][/ROW]
[ROW][C]15[/C][C]-0.006484[/C][C]-0.0476[/C][C]0.518913[/C][/ROW]
[ROW][C]16[/C][C]-0.007403[/C][C]-0.0544[/C][C]0.521592[/C][/ROW]
[/TABLE]
Source: https://freestatistics.org/blog/index.php?pk=7438&T=2

Globally Unique Identifier (entire table): ba.freestatistics.org/blog/index.php?pk=7438&T=2

As an alternative you can also use a QR Code:  

The GUIDs for individual cells are displayed in the table below:

Partial Autocorrelation Function
Time lag kPACF(k)T-STATP-value
00.9195326.75720
1-0.027391-0.20130.579383
2-0.02133-0.15670.561985
3-0.023193-0.17040.567347
4-0.011674-0.08580.534023
5-0.02002-0.14710.558205
6-0.017151-0.1260.549913
7-0.02826-0.20770.581864
8-0.050644-0.37220.644384
9-0.024702-0.18150.571682
10-0.011132-0.08180.532448
110.0097670.07180.471525
12-0.009076-0.06670.526466
13-0.004488-0.0330.513093
14-0.00345-0.02540.510067
15-0.006484-0.04760.518913
16-0.007403-0.05440.521592


Parameters (Session):
par1 = Default ; par2 = 1 ; par3 = 0 ; par4 = 0 ; par5 = 12 ;
Parameters (R input):
par1 = Default ; par2 = 1 ; par3 = 0 ; par4 = 0 ; par5 = 12 ;
R code (references can be found in the software module):
if (par1 == 'Default') {
par1 = 10*log10(length(x))
} else {
par1 <- as.numeric(par1)
}
par2 <- as.numeric(par2)
par3 <- as.numeric(par3)
par4 <- as.numeric(par4)
par5 <- as.numeric(par5)
if (par2 == 0) {
x <- log(x)
} else {
x <- (x ^ par2 - 1) / par2
}
if (par3 > 0) x <- diff(x,lag=1,difference=par3)
if (par4 > 0) x <- diff(x,lag=par5,difference=par4)
bitmap(file='pic1.png')
racf <- acf(x,par1,main='Autocorrelation',xlab='lags',ylab='ACF')
dev.off()
bitmap(file='pic2.png')
rpacf <- pacf(x,par1,main='Partial Autocorrelation',xlab='lags',ylab='PACF')
dev.off()
(myacf <- c(racf$acf))
(mypacf <- c(rpacf$acf))
lengthx <- length(x)
sqrtn <- sqrt(lengthx)
load(file='createtable')
a<-table.start()
a<-table.row.start(a)
a<-table.element(a,'Autocorrelation Function',4,TRUE)
a<-table.row.end(a)
a<-table.row.start(a)
a<-table.element(a,'Time lag k',header=TRUE)
a<-table.element(a,hyperlink('basics.htm','ACF(k)','click here for more information about the Autocorrelation Function'),header=TRUE)
a<-table.element(a,'T-STAT',header=TRUE)
a<-table.element(a,'P-value',header=TRUE)
a<-table.row.end(a)
for (i in 1:par1) {
a<-table.row.start(a)
a<-table.element(a,i-1,header=TRUE)
a<-table.element(a,round(myacf[i],6))
mytstat <- myacf[i]*sqrtn
a<-table.element(a,round(mytstat,4))
a<-table.element(a,round(1-pt(mytstat,lengthx),6))
a<-table.row.end(a)
}
a<-table.end(a)
table.save(a,file='mytable.tab')
a<-table.start()
a<-table.row.start(a)
a<-table.element(a,'Partial Autocorrelation Function',4,TRUE)
a<-table.row.end(a)
a<-table.row.start(a)
a<-table.element(a,'Time lag k',header=TRUE)
a<-table.element(a,hyperlink('basics.htm','PACF(k)','click here for more information about the Partial Autocorrelation Function'),header=TRUE)
a<-table.element(a,'T-STAT',header=TRUE)
a<-table.element(a,'P-value',header=TRUE)
a<-table.row.end(a)
for (i in 1:par1) {
a<-table.row.start(a)
a<-table.element(a,i-1,header=TRUE)
a<-table.element(a,round(mypacf[i],6))
mytstat <- mypacf[i]*sqrtn
a<-table.element(a,round(mytstat,4))
a<-table.element(a,round(1-pt(mytstat,lengthx),6))
a<-table.row.end(a)
}
a<-table.end(a)
table.save(a,file='mytable1.tab')