Free Statistics

of Irreproducible Research!

Author's title

Author*Unverified author*
R Software Modulerwasp_arimabackwardselection.wasp
Title produced by softwareARIMA Backward Selection
Date of computationWed, 28 Nov 2007 13:13:07 -0700
Cite this page as followsStatistical Computations at FreeStatistics.org, Office for Research Development and Education, URL https://freestatistics.org/blog/index.php?v=date/2007/Nov/28/t11962801853d5hj3eaifskxuo.htm/, Retrieved Thu, 02 May 2024 11:30:03 +0000
Statistical Computations at FreeStatistics.org, Office for Research Development and Education, URL https://freestatistics.org/blog/index.php?pk=7269, Retrieved Thu, 02 May 2024 11:30:03 +0000
QR Codes:

Original text written by user:
IsPrivate?No (this computation is public)
User-defined keywords
Estimated Impact185
Family? (F = Feedback message, R = changed R code, M = changed R Module, P = changed Parameters, D = changed Data)
-       [ARIMA Backward Selection] [G3ARIMAEchtsch] [2007-11-28 20:13:07] [142ab5472309a9ae9a3b52678758dc4a] [Current]
Feedback Forum

Post a new message
Dataseries X:
2529
2196
3202
2718
2728
2354
2697
2651
2067
2641
2539
2294
2712
2314
3092
2677
2813
2668
2939
2617
2231
2481
2421
2408
2560
2100
3315
2801
2403
3024
2507
2980
2211
2471
2594
2452
2232
2373
3127
2802
2641
2787
2619
2806
2193
2323
2529
2412
2262
2154
3230
2295
2715
2733
2317
2730
1913
2390
2484
1960


Summary of compuational transaction
Raw Inputview raw input (R code)
Raw Outputview raw output of R engine
Computing time14 seconds
R Server'Herman Ole Andreas Wold' @ 193.190.124.10:1001

\begin{tabular}{lllllllll}
\hline
Summary of compuational transaction \tabularnewline
Raw Input & view raw input (R code)  \tabularnewline
Raw Output & view raw output of R engine  \tabularnewline
Computing time & 14 seconds \tabularnewline
R Server & 'Herman Ole Andreas Wold' @ 193.190.124.10:1001 \tabularnewline
\hline
\end{tabular}
%Source: https://freestatistics.org/blog/index.php?pk=7269&T=0

[TABLE]
[ROW][C]Summary of compuational transaction[/C][/ROW]
[ROW][C]Raw Input[/C][C]view raw input (R code) [/C][/ROW]
[ROW][C]Raw Output[/C][C]view raw output of R engine [/C][/ROW]
[ROW][C]Computing time[/C][C]14 seconds[/C][/ROW]
[ROW][C]R Server[/C][C]'Herman Ole Andreas Wold' @ 193.190.124.10:1001[/C][/ROW]
[/TABLE]
Source: https://freestatistics.org/blog/index.php?pk=7269&T=0

Globally Unique Identifier (entire table): ba.freestatistics.org/blog/index.php?pk=7269&T=0

As an alternative you can also use a QR Code:  

The GUIDs for individual cells are displayed in the table below:

Summary of compuational transaction
Raw Inputview raw input (R code)
Raw Outputview raw output of R engine
Computing time14 seconds
R Server'Herman Ole Andreas Wold' @ 193.190.124.10:1001


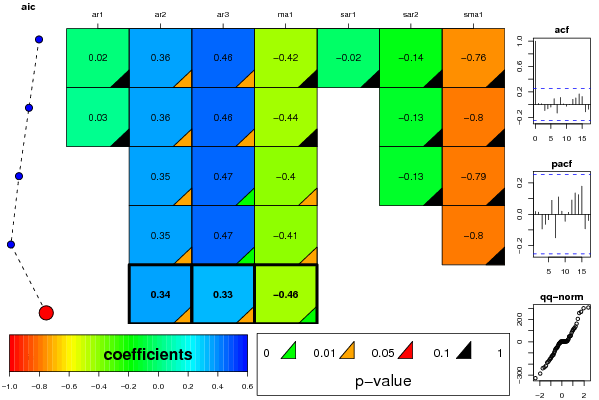
ARIMA Parameter Estimation and Backward Selection
Iterationar1ar2ar3ma1sar1sar2sma1
Estimates ( 1 )0.01920.35560.4649-0.4247-0.0183-0.1409-0.7642
(p-val)(0.9637 )(0.0312 )(0.0182 )(0.3773 )(0.9744 )(0.7163 )(0.4584 )
Estimates ( 2 )0.03020.35810.4614-0.43680-0.1299-0.7952
(p-val)(0.9371 )(0.0268 )(0.0129 )(0.3216 )(NA )(0.5424 )(0.1339 )
Estimates ( 3 )00.35210.4691-0.40410-0.1332-0.7907
(p-val)(NA )(0.0147 )(0.0018 )(0.012 )(NA )(0.5246 )(0.1243 )
Estimates ( 4 )00.3540.4697-0.406100-0.8049
(p-val)(NA )(0.0133 )(0.0015 )(0.0115 )(NA )(NA )(0.1068 )
Estimates ( 5 )00.34430.3316-0.4555000
(p-val)(NA )(0.0228 )(0.0155 )(0.0081 )(NA )(NA )(NA )
Estimates ( 6 )NANANANANANANA
(p-val)(NA )(NA )(NA )(NA )(NA )(NA )(NA )

\begin{tabular}{lllllllll}
\hline
ARIMA Parameter Estimation and Backward Selection \tabularnewline
Iteration & ar1 & ar2 & ar3 & ma1 & sar1 & sar2 & sma1 \tabularnewline
Estimates ( 1 ) & 0.0192 & 0.3556 & 0.4649 & -0.4247 & -0.0183 & -0.1409 & -0.7642 \tabularnewline
(p-val) & (0.9637 ) & (0.0312 ) & (0.0182 ) & (0.3773 ) & (0.9744 ) & (0.7163 ) & (0.4584 ) \tabularnewline
Estimates ( 2 ) & 0.0302 & 0.3581 & 0.4614 & -0.4368 & 0 & -0.1299 & -0.7952 \tabularnewline
(p-val) & (0.9371 ) & (0.0268 ) & (0.0129 ) & (0.3216 ) & (NA ) & (0.5424 ) & (0.1339 ) \tabularnewline
Estimates ( 3 ) & 0 & 0.3521 & 0.4691 & -0.4041 & 0 & -0.1332 & -0.7907 \tabularnewline
(p-val) & (NA ) & (0.0147 ) & (0.0018 ) & (0.012 ) & (NA ) & (0.5246 ) & (0.1243 ) \tabularnewline
Estimates ( 4 ) & 0 & 0.354 & 0.4697 & -0.4061 & 0 & 0 & -0.8049 \tabularnewline
(p-val) & (NA ) & (0.0133 ) & (0.0015 ) & (0.0115 ) & (NA ) & (NA ) & (0.1068 ) \tabularnewline
Estimates ( 5 ) & 0 & 0.3443 & 0.3316 & -0.4555 & 0 & 0 & 0 \tabularnewline
(p-val) & (NA ) & (0.0228 ) & (0.0155 ) & (0.0081 ) & (NA ) & (NA ) & (NA ) \tabularnewline
Estimates ( 6 ) & NA & NA & NA & NA & NA & NA & NA \tabularnewline
(p-val) & (NA ) & (NA ) & (NA ) & (NA ) & (NA ) & (NA ) & (NA ) \tabularnewline
\hline
\end{tabular}
%Source: https://freestatistics.org/blog/index.php?pk=7269&T=1

[TABLE]
[ROW][C]ARIMA Parameter Estimation and Backward Selection[/C][/ROW]
[ROW][C]Iteration[/C][C]ar1[/C][C]ar2[/C][C]ar3[/C][C]ma1[/C][C]sar1[/C][C]sar2[/C][C]sma1[/C][/ROW]
[ROW][C]Estimates ( 1 )[/C][C]0.0192[/C][C]0.3556[/C][C]0.4649[/C][C]-0.4247[/C][C]-0.0183[/C][C]-0.1409[/C][C]-0.7642[/C][/ROW]
[ROW][C](p-val)[/C][C](0.9637 )[/C][C](0.0312 )[/C][C](0.0182 )[/C][C](0.3773 )[/C][C](0.9744 )[/C][C](0.7163 )[/C][C](0.4584 )[/C][/ROW]
[ROW][C]Estimates ( 2 )[/C][C]0.0302[/C][C]0.3581[/C][C]0.4614[/C][C]-0.4368[/C][C]0[/C][C]-0.1299[/C][C]-0.7952[/C][/ROW]
[ROW][C](p-val)[/C][C](0.9371 )[/C][C](0.0268 )[/C][C](0.0129 )[/C][C](0.3216 )[/C][C](NA )[/C][C](0.5424 )[/C][C](0.1339 )[/C][/ROW]
[ROW][C]Estimates ( 3 )[/C][C]0[/C][C]0.3521[/C][C]0.4691[/C][C]-0.4041[/C][C]0[/C][C]-0.1332[/C][C]-0.7907[/C][/ROW]
[ROW][C](p-val)[/C][C](NA )[/C][C](0.0147 )[/C][C](0.0018 )[/C][C](0.012 )[/C][C](NA )[/C][C](0.5246 )[/C][C](0.1243 )[/C][/ROW]
[ROW][C]Estimates ( 4 )[/C][C]0[/C][C]0.354[/C][C]0.4697[/C][C]-0.4061[/C][C]0[/C][C]0[/C][C]-0.8049[/C][/ROW]
[ROW][C](p-val)[/C][C](NA )[/C][C](0.0133 )[/C][C](0.0015 )[/C][C](0.0115 )[/C][C](NA )[/C][C](NA )[/C][C](0.1068 )[/C][/ROW]
[ROW][C]Estimates ( 5 )[/C][C]0[/C][C]0.3443[/C][C]0.3316[/C][C]-0.4555[/C][C]0[/C][C]0[/C][C]0[/C][/ROW]
[ROW][C](p-val)[/C][C](NA )[/C][C](0.0228 )[/C][C](0.0155 )[/C][C](0.0081 )[/C][C](NA )[/C][C](NA )[/C][C](NA )[/C][/ROW]
[ROW][C]Estimates ( 6 )[/C][C]NA[/C][C]NA[/C][C]NA[/C][C]NA[/C][C]NA[/C][C]NA[/C][C]NA[/C][/ROW]
[ROW][C](p-val)[/C][C](NA )[/C][C](NA )[/C][C](NA )[/C][C](NA )[/C][C](NA )[/C][C](NA )[/C][C](NA )[/C][/ROW]
[/TABLE]
Source: https://freestatistics.org/blog/index.php?pk=7269&T=1

Globally Unique Identifier (entire table): ba.freestatistics.org/blog/index.php?pk=7269&T=1

As an alternative you can also use a QR Code:  

The GUIDs for individual cells are displayed in the table below:

ARIMA Parameter Estimation and Backward Selection
Iterationar1ar2ar3ma1sar1sar2sma1
Estimates ( 1 )0.01920.35560.4649-0.4247-0.0183-0.1409-0.7642
(p-val)(0.9637 )(0.0312 )(0.0182 )(0.3773 )(0.9744 )(0.7163 )(0.4584 )
Estimates ( 2 )0.03020.35810.4614-0.43680-0.1299-0.7952
(p-val)(0.9371 )(0.0268 )(0.0129 )(0.3216 )(NA )(0.5424 )(0.1339 )
Estimates ( 3 )00.35210.4691-0.40410-0.1332-0.7907
(p-val)(NA )(0.0147 )(0.0018 )(0.012 )(NA )(0.5246 )(0.1243 )
Estimates ( 4 )00.3540.4697-0.406100-0.8049
(p-val)(NA )(0.0133 )(0.0015 )(0.0115 )(NA )(NA )(0.1068 )
Estimates ( 5 )00.34430.3316-0.4555000
(p-val)(NA )(0.0228 )(0.0155 )(0.0081 )(NA )(NA )(NA )
Estimates ( 6 )NANANANANANANA
(p-val)(NA )(NA )(NA )(NA )(NA )(NA )(NA )


Estimated ARIMA Residuals
Value
2.29399481145773
117.756512664536
124.059383609613
-57.6311838256549
-148.480711735537
2.06740725280757
302.125274697316
308.993427623284
7.71101628372122
-53.0621880056421
-215.812108213031
-179.279392797553
-36.6671233443185
-7.30848173697318
-133.150099293929
93.7631418297819
206.619249033795
-229.534929625235
259.070856844980
-99.581265523019
269.966935274838
48.9148150240551
-29.1206299969013
-61.5094602984848
57.5987676969231
-327.243978809567
-50.229520215739
-13.6193010434483
163.686001787486
18.8933126326305
106.430272120857
-70.5684450277771
-12.8399485814215
6.9708963498898
-167.827562514715
-85.9425736697358
50.7890079353683
-117.691557585999
-155.60694843142
46.7315325248196
-286.127251738011
-17.531922173482
137.871308504314
-115.515967975109
-126.797593301475
-186.445163293887
24.2889482339631
80.133479314812
-238.244594194307

\begin{tabular}{lllllllll}
\hline
Estimated ARIMA Residuals \tabularnewline
Value \tabularnewline
2.29399481145773 \tabularnewline
117.756512664536 \tabularnewline
124.059383609613 \tabularnewline
-57.6311838256549 \tabularnewline
-148.480711735537 \tabularnewline
2.06740725280757 \tabularnewline
302.125274697316 \tabularnewline
308.993427623284 \tabularnewline
7.71101628372122 \tabularnewline
-53.0621880056421 \tabularnewline
-215.812108213031 \tabularnewline
-179.279392797553 \tabularnewline
-36.6671233443185 \tabularnewline
-7.30848173697318 \tabularnewline
-133.150099293929 \tabularnewline
93.7631418297819 \tabularnewline
206.619249033795 \tabularnewline
-229.534929625235 \tabularnewline
259.070856844980 \tabularnewline
-99.581265523019 \tabularnewline
269.966935274838 \tabularnewline
48.9148150240551 \tabularnewline
-29.1206299969013 \tabularnewline
-61.5094602984848 \tabularnewline
57.5987676969231 \tabularnewline
-327.243978809567 \tabularnewline
-50.229520215739 \tabularnewline
-13.6193010434483 \tabularnewline
163.686001787486 \tabularnewline
18.8933126326305 \tabularnewline
106.430272120857 \tabularnewline
-70.5684450277771 \tabularnewline
-12.8399485814215 \tabularnewline
6.9708963498898 \tabularnewline
-167.827562514715 \tabularnewline
-85.9425736697358 \tabularnewline
50.7890079353683 \tabularnewline
-117.691557585999 \tabularnewline
-155.60694843142 \tabularnewline
46.7315325248196 \tabularnewline
-286.127251738011 \tabularnewline
-17.531922173482 \tabularnewline
137.871308504314 \tabularnewline
-115.515967975109 \tabularnewline
-126.797593301475 \tabularnewline
-186.445163293887 \tabularnewline
24.2889482339631 \tabularnewline
80.133479314812 \tabularnewline
-238.244594194307 \tabularnewline
\hline
\end{tabular}
%Source: https://freestatistics.org/blog/index.php?pk=7269&T=2

[TABLE]
[ROW][C]Estimated ARIMA Residuals[/C][/ROW]
[ROW][C]Value[/C][/ROW]
[ROW][C]2.29399481145773[/C][/ROW]
[ROW][C]117.756512664536[/C][/ROW]
[ROW][C]124.059383609613[/C][/ROW]
[ROW][C]-57.6311838256549[/C][/ROW]
[ROW][C]-148.480711735537[/C][/ROW]
[ROW][C]2.06740725280757[/C][/ROW]
[ROW][C]302.125274697316[/C][/ROW]
[ROW][C]308.993427623284[/C][/ROW]
[ROW][C]7.71101628372122[/C][/ROW]
[ROW][C]-53.0621880056421[/C][/ROW]
[ROW][C]-215.812108213031[/C][/ROW]
[ROW][C]-179.279392797553[/C][/ROW]
[ROW][C]-36.6671233443185[/C][/ROW]
[ROW][C]-7.30848173697318[/C][/ROW]
[ROW][C]-133.150099293929[/C][/ROW]
[ROW][C]93.7631418297819[/C][/ROW]
[ROW][C]206.619249033795[/C][/ROW]
[ROW][C]-229.534929625235[/C][/ROW]
[ROW][C]259.070856844980[/C][/ROW]
[ROW][C]-99.581265523019[/C][/ROW]
[ROW][C]269.966935274838[/C][/ROW]
[ROW][C]48.9148150240551[/C][/ROW]
[ROW][C]-29.1206299969013[/C][/ROW]
[ROW][C]-61.5094602984848[/C][/ROW]
[ROW][C]57.5987676969231[/C][/ROW]
[ROW][C]-327.243978809567[/C][/ROW]
[ROW][C]-50.229520215739[/C][/ROW]
[ROW][C]-13.6193010434483[/C][/ROW]
[ROW][C]163.686001787486[/C][/ROW]
[ROW][C]18.8933126326305[/C][/ROW]
[ROW][C]106.430272120857[/C][/ROW]
[ROW][C]-70.5684450277771[/C][/ROW]
[ROW][C]-12.8399485814215[/C][/ROW]
[ROW][C]6.9708963498898[/C][/ROW]
[ROW][C]-167.827562514715[/C][/ROW]
[ROW][C]-85.9425736697358[/C][/ROW]
[ROW][C]50.7890079353683[/C][/ROW]
[ROW][C]-117.691557585999[/C][/ROW]
[ROW][C]-155.60694843142[/C][/ROW]
[ROW][C]46.7315325248196[/C][/ROW]
[ROW][C]-286.127251738011[/C][/ROW]
[ROW][C]-17.531922173482[/C][/ROW]
[ROW][C]137.871308504314[/C][/ROW]
[ROW][C]-115.515967975109[/C][/ROW]
[ROW][C]-126.797593301475[/C][/ROW]
[ROW][C]-186.445163293887[/C][/ROW]
[ROW][C]24.2889482339631[/C][/ROW]
[ROW][C]80.133479314812[/C][/ROW]
[ROW][C]-238.244594194307[/C][/ROW]
[/TABLE]
Source: https://freestatistics.org/blog/index.php?pk=7269&T=2

Globally Unique Identifier (entire table): ba.freestatistics.org/blog/index.php?pk=7269&T=2

As an alternative you can also use a QR Code:  

The GUIDs for individual cells are displayed in the table below:

Estimated ARIMA Residuals
Value
2.29399481145773
117.756512664536
124.059383609613
-57.6311838256549
-148.480711735537
2.06740725280757
302.125274697316
308.993427623284
7.71101628372122
-53.0621880056421
-215.812108213031
-179.279392797553
-36.6671233443185
-7.30848173697318
-133.150099293929
93.7631418297819
206.619249033795
-229.534929625235
259.070856844980
-99.581265523019
269.966935274838
48.9148150240551
-29.1206299969013
-61.5094602984848
57.5987676969231
-327.243978809567
-50.229520215739
-13.6193010434483
163.686001787486
18.8933126326305
106.430272120857
-70.5684450277771
-12.8399485814215
6.9708963498898
-167.827562514715
-85.9425736697358
50.7890079353683
-117.691557585999
-155.60694843142
46.7315325248196
-286.127251738011
-17.531922173482
137.871308504314
-115.515967975109
-126.797593301475
-186.445163293887
24.2889482339631
80.133479314812
-238.244594194307


Parameters (Session):
par1 = FALSE ; par2 = 1 ; par3 = 0 ; par4 = 1 ; par5 = 12 ; par6 = 3 ; par7 = 1 ; par8 = 2 ; par9 = 1 ;
Parameters (R input):
par1 = FALSE ; par2 = 1 ; par3 = 0 ; par4 = 1 ; par5 = 12 ; par6 = 3 ; par7 = 1 ; par8 = 2 ; par9 = 1 ;
R code (references can be found in the software module):
library(lattice)
if (par1 == 'TRUE') par1 <- TRUE
if (par1 == 'FALSE') par1 <- FALSE
par2 <- as.numeric(par2) #Box-Cox lambda transformation parameter
par3 <- as.numeric(par3) #degree of non-seasonal differencing
par4 <- as.numeric(par4) #degree of seasonal differencing
par5 <- as.numeric(par5) #seasonal period
par6 <- as.numeric(par6) #degree (p) of the non-seasonal AR(p) polynomial
par7 <- as.numeric(par7) #degree (q) of the non-seasonal MA(q) polynomial
par8 <- as.numeric(par8) #degree (P) of the seasonal AR(P) polynomial
par9 <- as.numeric(par9) #degree (Q) of the seasonal MA(Q) polynomial
armaGR <- function(arima.out, names, n){
try1 <- arima.out$coef
try2 <- sqrt(diag(arima.out$var.coef))
try.data.frame <- data.frame(matrix(NA,ncol=4,nrow=length(names)))
dimnames(try.data.frame) <- list(names,c('coef','std','tstat','pv'))
try.data.frame[,1] <- try1
for(i in 1:length(try2)) try.data.frame[which(rownames(try.data.frame)==names(try2)[i]),2] <- try2[i]
try.data.frame[,3] <- try.data.frame[,1] / try.data.frame[,2]
try.data.frame[,4] <- round((1-pt(abs(try.data.frame[,3]),df=n-(length(try2)+1)))*2,5)
vector <- rep(NA,length(names))
vector[is.na(try.data.frame[,4])] <- 0
maxi <- which.max(try.data.frame[,4])
continue <- max(try.data.frame[,4],na.rm=TRUE) > .05
vector[maxi] <- 0
list(summary=try.data.frame,next.vector=vector,continue=continue)
}
arimaSelect <- function(series, order=c(13,0,0), seasonal=list(order=c(2,0,0),period=12), include.mean=F){
nrc <- order[1]+order[3]+seasonal$order[1]+seasonal$order[3]
coeff <- matrix(NA, nrow=nrc, ncol=nrc)
pval <- matrix(NA, nrow=nrc, ncol=nrc)
mylist <- rep(list(NULL), nrc)
names <- NULL
if(order[1] > 0) names <- paste('ar',1:order[1],sep='')
if(order[3] > 0) names <- c( names , paste('ma',1:order[3],sep='') )
if(seasonal$order[1] > 0) names <- c(names, paste('sar',1:seasonal$order[1],sep=''))
if(seasonal$order[3] > 0) names <- c(names, paste('sma',1:seasonal$order[3],sep=''))
arima.out <- arima(series, order=order, seasonal=seasonal, include.mean=include.mean, method='ML')
mylist[[1]] <- arima.out
last.arma <- armaGR(arima.out, names, length(series))
mystop <- FALSE
i <- 1
coeff[i,] <- last.arma[[1]][,1]
pval [i,] <- last.arma[[1]][,4]
i <- 2
aic <- arima.out$aic
while(!mystop){
mylist[[i]] <- arima.out
arima.out <- arima(series, order=order, seasonal=seasonal, include.mean=include.mean, method='ML', fixed=last.arma$next.vector)
aic <- c(aic, arima.out$aic)
last.arma <- armaGR(arima.out, names, length(series))
mystop <- !last.arma$continue
coeff[i,] <- last.arma[[1]][,1]
pval [i,] <- last.arma[[1]][,4]
i <- i+1
}
list(coeff, pval, mylist, aic=aic)
}
arimaSelectplot <- function(arimaSelect.out,noms,choix){
noms <- names(arimaSelect.out[[3]][[1]]$coef)
coeff <- arimaSelect.out[[1]]
k <- min(which(is.na(coeff[,1])))-1
coeff <- coeff[1:k,]
pval <- arimaSelect.out[[2]][1:k,]
aic <- arimaSelect.out$aic[1:k]
coeff[coeff==0] <- NA
n <- ncol(coeff)
if(missing(choix)) choix <- k
layout(matrix(c(1,1,1,2,
3,3,3,2,
3,3,3,4,
5,6,7,7),nr=4),
widths=c(10,35,45,15),
heights=c(30,30,15,15))
couleurs <- rainbow(75)[1:50]#(50)
ticks <- pretty(coeff)
par(mar=c(1,1,3,1))
plot(aic,k:1-.5,type='o',pch=21,bg='blue',cex=2,axes=F,lty=2,xpd=NA)
points(aic[choix],k-choix+.5,pch=21,cex=4,bg=2,xpd=NA)
title('aic',line=2)
par(mar=c(3,0,0,0))
plot(0,axes=F,xlab='',ylab='',xlim=range(ticks),ylim=c(.1,1))
rect(xleft = min(ticks) + (0:49)/50*(max(ticks)-min(ticks)),
xright = min(ticks) + (1:50)/50*(max(ticks)-min(ticks)),
ytop = rep(1,50),
ybottom= rep(0,50),col=couleurs,border=NA)
axis(1,ticks)
rect(xleft=min(ticks),xright=max(ticks),ytop=1,ybottom=0)
text(mean(coeff,na.rm=T),.5,'coefficients',cex=2,font=2)
par(mar=c(1,1,3,1))
image(1:n,1:k,t(coeff[k:1,]),axes=F,col=couleurs,zlim=range(ticks))
for(i in 1:n) for(j in 1:k) if(!is.na(coeff[j,i])) {
if(pval[j,i]<.01) symb = 'green'
else if( (pval[j,i]<.05) & (pval[j,i]>=.01)) symb = 'orange'
else if( (pval[j,i]<.1) & (pval[j,i]>=.05)) symb = 'red'
else symb = 'black'
polygon(c(i+.5 ,i+.2 ,i+.5 ,i+.5),
c(k-j+0.5,k-j+0.5,k-j+0.8,k-j+0.5),
col=symb)
if(j==choix) {
rect(xleft=i-.5,
xright=i+.5,
ybottom=k-j+1.5,
ytop=k-j+.5,
lwd=4)
text(i,
k-j+1,
round(coeff[j,i],2),
cex=1.2,
font=2)
}
else{
rect(xleft=i-.5,xright=i+.5,ybottom=k-j+1.5,ytop=k-j+.5)
text(i,k-j+1,round(coeff[j,i],2),cex=1.2,font=1)
}
}
axis(3,1:n,noms)
par(mar=c(0.5,0,0,0.5))
plot(0,axes=F,xlab='',ylab='',type='n',xlim=c(0,8),ylim=c(-.2,.8))
cols <- c('green','orange','red','black')
niv <- c('0','0.01','0.05','0.1')
for(i in 0:3){
polygon(c(1+2*i ,1+2*i ,1+2*i-.5 ,1+2*i),
c(.4 ,.7 , .4 , .4),
col=cols[i+1])
text(2*i,0.5,niv[i+1],cex=1.5)
}
text(8,.5,1,cex=1.5)
text(4,0,'p-value',cex=2)
box()
residus <- arimaSelect.out[[3]][[choix]]$res
par(mar=c(1,2,4,1))
acf(residus,main='')
title('acf',line=.5)
par(mar=c(1,2,4,1))
pacf(residus,main='')
title('pacf',line=.5)
par(mar=c(2,2,4,1))
qqnorm(residus,main='')
title('qq-norm',line=.5)
residus
}
if (par2 == 0) x <- log(x)
if (par2 != 0) x <- x^par2
(selection <- arimaSelect(x, order=c(par6,par3,par7), seasonal=list(order=c(par8,par4,par9), period=par5)))
bitmap(file='test1.png')
resid <- arimaSelectplot(selection)
dev.off()
resid
bitmap(file='test2.png')
acf(resid,length(resid)/2, main='Residual Autocorrelation Function')
dev.off()
bitmap(file='test3.png')
pacf(resid,length(resid)/2, main='Residual Partial Autocorrelation Function')
dev.off()
bitmap(file='test4.png')
cpgram(resid, main='Residual Cumulative Periodogram')
dev.off()
bitmap(file='test5.png')
hist(resid, main='Residual Histogram', xlab='values of Residuals')
dev.off()
bitmap(file='test6.png')
densityplot(~resid,col='black',main='Residual Density Plot', xlab='values of Residuals')
dev.off()
bitmap(file='test7.png')
qqnorm(resid, main='Residual Normal Q-Q Plot')
dev.off()
ncols <- length(selection[[1]][1,])
nrows <- length(selection[[2]][,1])-1
load(file='createtable')
a<-table.start()
a<-table.row.start(a)
a<-table.element(a,'ARIMA Parameter Estimation and Backward Selection', ncols+1,TRUE)
a<-table.row.end(a)
a<-table.row.start(a)
a<-table.element(a,'Iteration', header=TRUE)
for (i in 1:ncols) {
a<-table.element(a,names(selection[[3]][[1]]$coef)[i],header=TRUE)
}
a<-table.row.end(a)
for (j in 1:nrows) {
a<-table.row.start(a)
mydum <- 'Estimates ('
mydum <- paste(mydum,j)
mydum <- paste(mydum,')')
a<-table.element(a,mydum, header=TRUE)
for (i in 1:ncols) {
a<-table.element(a,round(selection[[1]][j,i],4))
}
a<-table.row.end(a)
a<-table.row.start(a)
a<-table.element(a,'(p-val)', header=TRUE)
for (i in 1:ncols) {
mydum <- '('
mydum <- paste(mydum,round(selection[[2]][j,i],4),sep='')
mydum <- paste(mydum,')')
a<-table.element(a,mydum)
}
a<-table.row.end(a)
}
a<-table.end(a)
table.save(a,file='mytable.tab')
a<-table.start()
a<-table.row.start(a)
a<-table.element(a,'Estimated ARIMA Residuals', 1,TRUE)
a<-table.row.end(a)
a<-table.row.start(a)
a<-table.element(a,'Value', 1,TRUE)
a<-table.row.end(a)
for (i in (par4*par5+par3):length(resid)) {
a<-table.row.start(a)
a<-table.element(a,resid[i])
a<-table.row.end(a)
}
a<-table.end(a)
table.save(a,file='mytable1.tab')