Free Statistics

of Irreproducible Research!

Author's title

Author*Unverified author*
R Software Modulerwasp_arimabackwardselection.wasp
Title produced by softwareARIMA Backward Selection
Date of computationWed, 28 Nov 2007 13:10:21 -0700
Cite this page as followsStatistical Computations at FreeStatistics.org, Office for Research Development and Education, URL https://freestatistics.org/blog/index.php?v=date/2007/Nov/28/t11962800300rtgb2g832l2wul.htm/, Retrieved Thu, 02 May 2024 11:36:26 +0000
Statistical Computations at FreeStatistics.org, Office for Research Development and Education, URL https://freestatistics.org/blog/index.php?pk=7268, Retrieved Thu, 02 May 2024 11:36:26 +0000
QR Codes:

Original text written by user:
IsPrivate?No (this computation is public)
User-defined keywords
Estimated Impact198
Family? (F = Feedback message, R = changed R code, M = changed R Module, P = changed Parameters, D = changed Data)
-       [ARIMA Backward Selection] [] [2007-11-28 20:10:21] [142ab5472309a9ae9a3b52678758dc4a] [Current]
Feedback Forum

Post a new message
Dataseries X:
1178
2141
2238
2685
4341
5376
4478
6404
4617
3024
1897
2075
1351
2211
2453
3042
4765
4992
4601
6266
4812
3159
1916
2237
1595
2453
2226
3597
4706
4974
5756
5493
5004
3225
2006
2291
1588
2105
2191
3591
4668
4885
5822
5599
5340
3082
2010
2301
1514
1979
2480
3499
4676
5585
5610
5796
6199
3030
1930
2552


Summary of compuational transaction
Raw Inputview raw input (R code)
Raw Outputview raw output of R engine
Computing time7 seconds
R Server'Gwilym Jenkins' @ 72.249.127.135

\begin{tabular}{lllllllll}
\hline
Summary of compuational transaction \tabularnewline
Raw Input & view raw input (R code)  \tabularnewline
Raw Output & view raw output of R engine  \tabularnewline
Computing time & 7 seconds \tabularnewline
R Server & 'Gwilym Jenkins' @ 72.249.127.135 \tabularnewline
\hline
\end{tabular}
%Source: https://freestatistics.org/blog/index.php?pk=7268&T=0

[TABLE]
[ROW][C]Summary of compuational transaction[/C][/ROW]
[ROW][C]Raw Input[/C][C]view raw input (R code) [/C][/ROW]
[ROW][C]Raw Output[/C][C]view raw output of R engine [/C][/ROW]
[ROW][C]Computing time[/C][C]7 seconds[/C][/ROW]
[ROW][C]R Server[/C][C]'Gwilym Jenkins' @ 72.249.127.135[/C][/ROW]
[/TABLE]
Source: https://freestatistics.org/blog/index.php?pk=7268&T=0

Globally Unique Identifier (entire table): ba.freestatistics.org/blog/index.php?pk=7268&T=0

As an alternative you can also use a QR Code:  

The GUIDs for individual cells are displayed in the table below:

Summary of compuational transaction
Raw Inputview raw input (R code)
Raw Outputview raw output of R engine
Computing time7 seconds
R Server'Gwilym Jenkins' @ 72.249.127.135


ARIMA Parameter Estimation and Backward Selection
Iterationar1ar2ar3ma1sar1sar2sma1
Estimates ( 1 )0.24710.19290.3594-0.55370.35-0.2434-0.2724
(p-val)(0.5376 )(0.2433 )(0.0219 )(0.2102 )(0.7396 )(0.2913 )(0.8035 )
Estimates ( 2 )0.20810.18350.362-0.51170.0901-0.21640
(p-val)(0.5923 )(0.2521 )(0.0182 )(0.2319 )(0.6274 )(0.3247 )(NA )
Estimates ( 3 )0.16630.20290.3737-0.48020-0.22090
(p-val)(0.6915 )(0.2039 )(0.0159 )(0.3122 )(NA )(0.319 )(NA )
Estimates ( 4 )00.16970.3938-0.29890-0.19190
(p-val)(NA )(0.225 )(0.0035 )(0.0508 )(NA )(0.358 )(NA )
Estimates ( 5 )00.14040.3889-0.2913000
(p-val)(NA )(0.301 )(0.004 )(0.0514 )(NA )(NA )(NA )
Estimates ( 6 )000.3867-0.2546000
(p-val)(NA )(NA )(0.0053 )(0.0497 )(NA )(NA )(NA )

\begin{tabular}{lllllllll}
\hline
ARIMA Parameter Estimation and Backward Selection \tabularnewline
Iteration & ar1 & ar2 & ar3 & ma1 & sar1 & sar2 & sma1 \tabularnewline
Estimates ( 1 ) & 0.2471 & 0.1929 & 0.3594 & -0.5537 & 0.35 & -0.2434 & -0.2724 \tabularnewline
(p-val) & (0.5376 ) & (0.2433 ) & (0.0219 ) & (0.2102 ) & (0.7396 ) & (0.2913 ) & (0.8035 ) \tabularnewline
Estimates ( 2 ) & 0.2081 & 0.1835 & 0.362 & -0.5117 & 0.0901 & -0.2164 & 0 \tabularnewline
(p-val) & (0.5923 ) & (0.2521 ) & (0.0182 ) & (0.2319 ) & (0.6274 ) & (0.3247 ) & (NA ) \tabularnewline
Estimates ( 3 ) & 0.1663 & 0.2029 & 0.3737 & -0.4802 & 0 & -0.2209 & 0 \tabularnewline
(p-val) & (0.6915 ) & (0.2039 ) & (0.0159 ) & (0.3122 ) & (NA ) & (0.319 ) & (NA ) \tabularnewline
Estimates ( 4 ) & 0 & 0.1697 & 0.3938 & -0.2989 & 0 & -0.1919 & 0 \tabularnewline
(p-val) & (NA ) & (0.225 ) & (0.0035 ) & (0.0508 ) & (NA ) & (0.358 ) & (NA ) \tabularnewline
Estimates ( 5 ) & 0 & 0.1404 & 0.3889 & -0.2913 & 0 & 0 & 0 \tabularnewline
(p-val) & (NA ) & (0.301 ) & (0.004 ) & (0.0514 ) & (NA ) & (NA ) & (NA ) \tabularnewline
Estimates ( 6 ) & 0 & 0 & 0.3867 & -0.2546 & 0 & 0 & 0 \tabularnewline
(p-val) & (NA ) & (NA ) & (0.0053 ) & (0.0497 ) & (NA ) & (NA ) & (NA ) \tabularnewline
\hline
\end{tabular}
%Source: https://freestatistics.org/blog/index.php?pk=7268&T=1

[TABLE]
[ROW][C]ARIMA Parameter Estimation and Backward Selection[/C][/ROW]
[ROW][C]Iteration[/C][C]ar1[/C][C]ar2[/C][C]ar3[/C][C]ma1[/C][C]sar1[/C][C]sar2[/C][C]sma1[/C][/ROW]
[ROW][C]Estimates ( 1 )[/C][C]0.2471[/C][C]0.1929[/C][C]0.3594[/C][C]-0.5537[/C][C]0.35[/C][C]-0.2434[/C][C]-0.2724[/C][/ROW]
[ROW][C](p-val)[/C][C](0.5376 )[/C][C](0.2433 )[/C][C](0.0219 )[/C][C](0.2102 )[/C][C](0.7396 )[/C][C](0.2913 )[/C][C](0.8035 )[/C][/ROW]
[ROW][C]Estimates ( 2 )[/C][C]0.2081[/C][C]0.1835[/C][C]0.362[/C][C]-0.5117[/C][C]0.0901[/C][C]-0.2164[/C][C]0[/C][/ROW]
[ROW][C](p-val)[/C][C](0.5923 )[/C][C](0.2521 )[/C][C](0.0182 )[/C][C](0.2319 )[/C][C](0.6274 )[/C][C](0.3247 )[/C][C](NA )[/C][/ROW]
[ROW][C]Estimates ( 3 )[/C][C]0.1663[/C][C]0.2029[/C][C]0.3737[/C][C]-0.4802[/C][C]0[/C][C]-0.2209[/C][C]0[/C][/ROW]
[ROW][C](p-val)[/C][C](0.6915 )[/C][C](0.2039 )[/C][C](0.0159 )[/C][C](0.3122 )[/C][C](NA )[/C][C](0.319 )[/C][C](NA )[/C][/ROW]
[ROW][C]Estimates ( 4 )[/C][C]0[/C][C]0.1697[/C][C]0.3938[/C][C]-0.2989[/C][C]0[/C][C]-0.1919[/C][C]0[/C][/ROW]
[ROW][C](p-val)[/C][C](NA )[/C][C](0.225 )[/C][C](0.0035 )[/C][C](0.0508 )[/C][C](NA )[/C][C](0.358 )[/C][C](NA )[/C][/ROW]
[ROW][C]Estimates ( 5 )[/C][C]0[/C][C]0.1404[/C][C]0.3889[/C][C]-0.2913[/C][C]0[/C][C]0[/C][C]0[/C][/ROW]
[ROW][C](p-val)[/C][C](NA )[/C][C](0.301 )[/C][C](0.004 )[/C][C](0.0514 )[/C][C](NA )[/C][C](NA )[/C][C](NA )[/C][/ROW]
[ROW][C]Estimates ( 6 )[/C][C]0[/C][C]0[/C][C]0.3867[/C][C]-0.2546[/C][C]0[/C][C]0[/C][C]0[/C][/ROW]
[ROW][C](p-val)[/C][C](NA )[/C][C](NA )[/C][C](0.0053 )[/C][C](0.0497 )[/C][C](NA )[/C][C](NA )[/C][C](NA )[/C][/ROW]
[/TABLE]
Source: https://freestatistics.org/blog/index.php?pk=7268&T=1

Globally Unique Identifier (entire table): ba.freestatistics.org/blog/index.php?pk=7268&T=1

As an alternative you can also use a QR Code:  

The GUIDs for individual cells are displayed in the table below:

ARIMA Parameter Estimation and Backward Selection
Iterationar1ar2ar3ma1sar1sar2sma1
Estimates ( 1 )0.24710.19290.3594-0.55370.35-0.2434-0.2724
(p-val)(0.5376 )(0.2433 )(0.0219 )(0.2102 )(0.7396 )(0.2913 )(0.8035 )
Estimates ( 2 )0.20810.18350.362-0.51170.0901-0.21640
(p-val)(0.5923 )(0.2521 )(0.0182 )(0.2319 )(0.6274 )(0.3247 )(NA )
Estimates ( 3 )0.16630.20290.3737-0.48020-0.22090
(p-val)(0.6915 )(0.2039 )(0.0159 )(0.3122 )(NA )(0.319 )(NA )
Estimates ( 4 )00.16970.3938-0.29890-0.19190
(p-val)(NA )(0.225 )(0.0035 )(0.0508 )(NA )(0.358 )(NA )
Estimates ( 5 )00.14040.3889-0.2913000
(p-val)(NA )(0.301 )(0.004 )(0.0514 )(NA )(NA )(NA )
Estimates ( 6 )000.3867-0.2546000
(p-val)(NA )(NA )(0.0053 )(0.0497 )(NA )(NA )(NA )


Estimated ARIMA Residuals
Value
2.07499637734079
153.675517441929
103.419623762635
216.189803152609
335.382010451738
463.370543682255
-382.820070251666
-186.903140522640
-303.415413794258
238.674290066074
176.076176195619
96.5778356789821
95.3392188336864
216.60373476563
274.960742656616
-244.168173910860
354.989326442553
-17.8193942637513
-12.8538062127354
943.698908296033
-472.607381256773
-100.888252979811
-304.016474181599
275.092987823520
50.2014972680345
-30.6825960547155
-399.523719975333
-171.407448165688
-4.33915556164447
100.990368385169
-45.1250611081332
60.524272205952
150.909545634929
405.306656410578
-65.4800539151238
-103.487491889994
-130.737362685940
-57.0348319265543
-145.575463339584
253.094314834186
28.2061072575052
24.6319668588603
607.70263792905
-0.307703691212737
95.4911734363877
644.358106638274
190.496299237879
-221.756674923333
-140.369181621094

\begin{tabular}{lllllllll}
\hline
Estimated ARIMA Residuals \tabularnewline
Value \tabularnewline
2.07499637734079 \tabularnewline
153.675517441929 \tabularnewline
103.419623762635 \tabularnewline
216.189803152609 \tabularnewline
335.382010451738 \tabularnewline
463.370543682255 \tabularnewline
-382.820070251666 \tabularnewline
-186.903140522640 \tabularnewline
-303.415413794258 \tabularnewline
238.674290066074 \tabularnewline
176.076176195619 \tabularnewline
96.5778356789821 \tabularnewline
95.3392188336864 \tabularnewline
216.60373476563 \tabularnewline
274.960742656616 \tabularnewline
-244.168173910860 \tabularnewline
354.989326442553 \tabularnewline
-17.8193942637513 \tabularnewline
-12.8538062127354 \tabularnewline
943.698908296033 \tabularnewline
-472.607381256773 \tabularnewline
-100.888252979811 \tabularnewline
-304.016474181599 \tabularnewline
275.092987823520 \tabularnewline
50.2014972680345 \tabularnewline
-30.6825960547155 \tabularnewline
-399.523719975333 \tabularnewline
-171.407448165688 \tabularnewline
-4.33915556164447 \tabularnewline
100.990368385169 \tabularnewline
-45.1250611081332 \tabularnewline
60.524272205952 \tabularnewline
150.909545634929 \tabularnewline
405.306656410578 \tabularnewline
-65.4800539151238 \tabularnewline
-103.487491889994 \tabularnewline
-130.737362685940 \tabularnewline
-57.0348319265543 \tabularnewline
-145.575463339584 \tabularnewline
253.094314834186 \tabularnewline
28.2061072575052 \tabularnewline
24.6319668588603 \tabularnewline
607.70263792905 \tabularnewline
-0.307703691212737 \tabularnewline
95.4911734363877 \tabularnewline
644.358106638274 \tabularnewline
190.496299237879 \tabularnewline
-221.756674923333 \tabularnewline
-140.369181621094 \tabularnewline
\hline
\end{tabular}
%Source: https://freestatistics.org/blog/index.php?pk=7268&T=2

[TABLE]
[ROW][C]Estimated ARIMA Residuals[/C][/ROW]
[ROW][C]Value[/C][/ROW]
[ROW][C]2.07499637734079[/C][/ROW]
[ROW][C]153.675517441929[/C][/ROW]
[ROW][C]103.419623762635[/C][/ROW]
[ROW][C]216.189803152609[/C][/ROW]
[ROW][C]335.382010451738[/C][/ROW]
[ROW][C]463.370543682255[/C][/ROW]
[ROW][C]-382.820070251666[/C][/ROW]
[ROW][C]-186.903140522640[/C][/ROW]
[ROW][C]-303.415413794258[/C][/ROW]
[ROW][C]238.674290066074[/C][/ROW]
[ROW][C]176.076176195619[/C][/ROW]
[ROW][C]96.5778356789821[/C][/ROW]
[ROW][C]95.3392188336864[/C][/ROW]
[ROW][C]216.60373476563[/C][/ROW]
[ROW][C]274.960742656616[/C][/ROW]
[ROW][C]-244.168173910860[/C][/ROW]
[ROW][C]354.989326442553[/C][/ROW]
[ROW][C]-17.8193942637513[/C][/ROW]
[ROW][C]-12.8538062127354[/C][/ROW]
[ROW][C]943.698908296033[/C][/ROW]
[ROW][C]-472.607381256773[/C][/ROW]
[ROW][C]-100.888252979811[/C][/ROW]
[ROW][C]-304.016474181599[/C][/ROW]
[ROW][C]275.092987823520[/C][/ROW]
[ROW][C]50.2014972680345[/C][/ROW]
[ROW][C]-30.6825960547155[/C][/ROW]
[ROW][C]-399.523719975333[/C][/ROW]
[ROW][C]-171.407448165688[/C][/ROW]
[ROW][C]-4.33915556164447[/C][/ROW]
[ROW][C]100.990368385169[/C][/ROW]
[ROW][C]-45.1250611081332[/C][/ROW]
[ROW][C]60.524272205952[/C][/ROW]
[ROW][C]150.909545634929[/C][/ROW]
[ROW][C]405.306656410578[/C][/ROW]
[ROW][C]-65.4800539151238[/C][/ROW]
[ROW][C]-103.487491889994[/C][/ROW]
[ROW][C]-130.737362685940[/C][/ROW]
[ROW][C]-57.0348319265543[/C][/ROW]
[ROW][C]-145.575463339584[/C][/ROW]
[ROW][C]253.094314834186[/C][/ROW]
[ROW][C]28.2061072575052[/C][/ROW]
[ROW][C]24.6319668588603[/C][/ROW]
[ROW][C]607.70263792905[/C][/ROW]
[ROW][C]-0.307703691212737[/C][/ROW]
[ROW][C]95.4911734363877[/C][/ROW]
[ROW][C]644.358106638274[/C][/ROW]
[ROW][C]190.496299237879[/C][/ROW]
[ROW][C]-221.756674923333[/C][/ROW]
[ROW][C]-140.369181621094[/C][/ROW]
[/TABLE]
Source: https://freestatistics.org/blog/index.php?pk=7268&T=2

Globally Unique Identifier (entire table): ba.freestatistics.org/blog/index.php?pk=7268&T=2

As an alternative you can also use a QR Code:  

The GUIDs for individual cells are displayed in the table below:

Estimated ARIMA Residuals
Value
2.07499637734079
153.675517441929
103.419623762635
216.189803152609
335.382010451738
463.370543682255
-382.820070251666
-186.903140522640
-303.415413794258
238.674290066074
176.076176195619
96.5778356789821
95.3392188336864
216.60373476563
274.960742656616
-244.168173910860
354.989326442553
-17.8193942637513
-12.8538062127354
943.698908296033
-472.607381256773
-100.888252979811
-304.016474181599
275.092987823520
50.2014972680345
-30.6825960547155
-399.523719975333
-171.407448165688
-4.33915556164447
100.990368385169
-45.1250611081332
60.524272205952
150.909545634929
405.306656410578
-65.4800539151238
-103.487491889994
-130.737362685940
-57.0348319265543
-145.575463339584
253.094314834186
28.2061072575052
24.6319668588603
607.70263792905
-0.307703691212737
95.4911734363877
644.358106638274
190.496299237879
-221.756674923333
-140.369181621094


Parameters (Session):
par1 = FALSE ; par2 = 1 ; par3 = 0 ; par4 = 1 ; par5 = 12 ; par6 = 3 ; par7 = 1 ; par8 = 2 ; par9 = 1 ;
Parameters (R input):
par1 = FALSE ; par2 = 1 ; par3 = 0 ; par4 = 1 ; par5 = 12 ; par6 = 3 ; par7 = 1 ; par8 = 2 ; par9 = 1 ;
R code (references can be found in the software module):
library(lattice)
if (par1 == 'TRUE') par1 <- TRUE
if (par1 == 'FALSE') par1 <- FALSE
par2 <- as.numeric(par2) #Box-Cox lambda transformation parameter
par3 <- as.numeric(par3) #degree of non-seasonal differencing
par4 <- as.numeric(par4) #degree of seasonal differencing
par5 <- as.numeric(par5) #seasonal period
par6 <- as.numeric(par6) #degree (p) of the non-seasonal AR(p) polynomial
par7 <- as.numeric(par7) #degree (q) of the non-seasonal MA(q) polynomial
par8 <- as.numeric(par8) #degree (P) of the seasonal AR(P) polynomial
par9 <- as.numeric(par9) #degree (Q) of the seasonal MA(Q) polynomial
armaGR <- function(arima.out, names, n){
try1 <- arima.out$coef
try2 <- sqrt(diag(arima.out$var.coef))
try.data.frame <- data.frame(matrix(NA,ncol=4,nrow=length(names)))
dimnames(try.data.frame) <- list(names,c('coef','std','tstat','pv'))
try.data.frame[,1] <- try1
for(i in 1:length(try2)) try.data.frame[which(rownames(try.data.frame)==names(try2)[i]),2] <- try2[i]
try.data.frame[,3] <- try.data.frame[,1] / try.data.frame[,2]
try.data.frame[,4] <- round((1-pt(abs(try.data.frame[,3]),df=n-(length(try2)+1)))*2,5)
vector <- rep(NA,length(names))
vector[is.na(try.data.frame[,4])] <- 0
maxi <- which.max(try.data.frame[,4])
continue <- max(try.data.frame[,4],na.rm=TRUE) > .05
vector[maxi] <- 0
list(summary=try.data.frame,next.vector=vector,continue=continue)
}
arimaSelect <- function(series, order=c(13,0,0), seasonal=list(order=c(2,0,0),period=12), include.mean=F){
nrc <- order[1]+order[3]+seasonal$order[1]+seasonal$order[3]
coeff <- matrix(NA, nrow=nrc, ncol=nrc)
pval <- matrix(NA, nrow=nrc, ncol=nrc)
mylist <- rep(list(NULL), nrc)
names <- NULL
if(order[1] > 0) names <- paste('ar',1:order[1],sep='')
if(order[3] > 0) names <- c( names , paste('ma',1:order[3],sep='') )
if(seasonal$order[1] > 0) names <- c(names, paste('sar',1:seasonal$order[1],sep=''))
if(seasonal$order[3] > 0) names <- c(names, paste('sma',1:seasonal$order[3],sep=''))
arima.out <- arima(series, order=order, seasonal=seasonal, include.mean=include.mean, method='ML')
mylist[[1]] <- arima.out
last.arma <- armaGR(arima.out, names, length(series))
mystop <- FALSE
i <- 1
coeff[i,] <- last.arma[[1]][,1]
pval [i,] <- last.arma[[1]][,4]
i <- 2
aic <- arima.out$aic
while(!mystop){
mylist[[i]] <- arima.out
arima.out <- arima(series, order=order, seasonal=seasonal, include.mean=include.mean, method='ML', fixed=last.arma$next.vector)
aic <- c(aic, arima.out$aic)
last.arma <- armaGR(arima.out, names, length(series))
mystop <- !last.arma$continue
coeff[i,] <- last.arma[[1]][,1]
pval [i,] <- last.arma[[1]][,4]
i <- i+1
}
list(coeff, pval, mylist, aic=aic)
}
arimaSelectplot <- function(arimaSelect.out,noms,choix){
noms <- names(arimaSelect.out[[3]][[1]]$coef)
coeff <- arimaSelect.out[[1]]
k <- min(which(is.na(coeff[,1])))-1
coeff <- coeff[1:k,]
pval <- arimaSelect.out[[2]][1:k,]
aic <- arimaSelect.out$aic[1:k]
coeff[coeff==0] <- NA
n <- ncol(coeff)
if(missing(choix)) choix <- k
layout(matrix(c(1,1,1,2,
3,3,3,2,
3,3,3,4,
5,6,7,7),nr=4),
widths=c(10,35,45,15),
heights=c(30,30,15,15))
couleurs <- rainbow(75)[1:50]#(50)
ticks <- pretty(coeff)
par(mar=c(1,1,3,1))
plot(aic,k:1-.5,type='o',pch=21,bg='blue',cex=2,axes=F,lty=2,xpd=NA)
points(aic[choix],k-choix+.5,pch=21,cex=4,bg=2,xpd=NA)
title('aic',line=2)
par(mar=c(3,0,0,0))
plot(0,axes=F,xlab='',ylab='',xlim=range(ticks),ylim=c(.1,1))
rect(xleft = min(ticks) + (0:49)/50*(max(ticks)-min(ticks)),
xright = min(ticks) + (1:50)/50*(max(ticks)-min(ticks)),
ytop = rep(1,50),
ybottom= rep(0,50),col=couleurs,border=NA)
axis(1,ticks)
rect(xleft=min(ticks),xright=max(ticks),ytop=1,ybottom=0)
text(mean(coeff,na.rm=T),.5,'coefficients',cex=2,font=2)
par(mar=c(1,1,3,1))
image(1:n,1:k,t(coeff[k:1,]),axes=F,col=couleurs,zlim=range(ticks))
for(i in 1:n) for(j in 1:k) if(!is.na(coeff[j,i])) {
if(pval[j,i]<.01) symb = 'green'
else if( (pval[j,i]<.05) & (pval[j,i]>=.01)) symb = 'orange'
else if( (pval[j,i]<.1) & (pval[j,i]>=.05)) symb = 'red'
else symb = 'black'
polygon(c(i+.5 ,i+.2 ,i+.5 ,i+.5),
c(k-j+0.5,k-j+0.5,k-j+0.8,k-j+0.5),
col=symb)
if(j==choix) {
rect(xleft=i-.5,
xright=i+.5,
ybottom=k-j+1.5,
ytop=k-j+.5,
lwd=4)
text(i,
k-j+1,
round(coeff[j,i],2),
cex=1.2,
font=2)
}
else{
rect(xleft=i-.5,xright=i+.5,ybottom=k-j+1.5,ytop=k-j+.5)
text(i,k-j+1,round(coeff[j,i],2),cex=1.2,font=1)
}
}
axis(3,1:n,noms)
par(mar=c(0.5,0,0,0.5))
plot(0,axes=F,xlab='',ylab='',type='n',xlim=c(0,8),ylim=c(-.2,.8))
cols <- c('green','orange','red','black')
niv <- c('0','0.01','0.05','0.1')
for(i in 0:3){
polygon(c(1+2*i ,1+2*i ,1+2*i-.5 ,1+2*i),
c(.4 ,.7 , .4 , .4),
col=cols[i+1])
text(2*i,0.5,niv[i+1],cex=1.5)
}
text(8,.5,1,cex=1.5)
text(4,0,'p-value',cex=2)
box()
residus <- arimaSelect.out[[3]][[choix]]$res
par(mar=c(1,2,4,1))
acf(residus,main='')
title('acf',line=.5)
par(mar=c(1,2,4,1))
pacf(residus,main='')
title('pacf',line=.5)
par(mar=c(2,2,4,1))
qqnorm(residus,main='')
title('qq-norm',line=.5)
residus
}
if (par2 == 0) x <- log(x)
if (par2 != 0) x <- x^par2
(selection <- arimaSelect(x, order=c(par6,par3,par7), seasonal=list(order=c(par8,par4,par9), period=par5)))
bitmap(file='test1.png')
resid <- arimaSelectplot(selection)
dev.off()
resid
bitmap(file='test2.png')
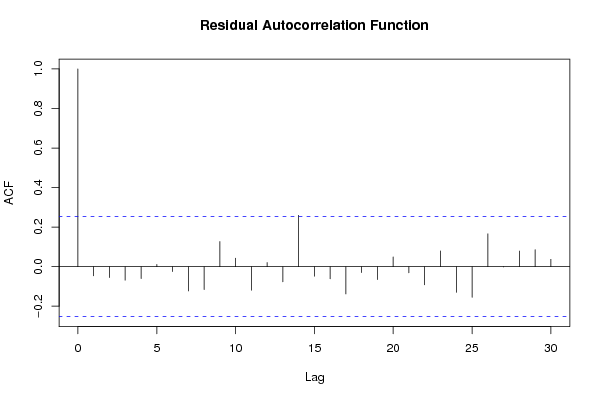
acf(resid,length(resid)/2, main='Residual Autocorrelation Function')
dev.off()
bitmap(file='test3.png')
pacf(resid,length(resid)/2, main='Residual Partial Autocorrelation Function')
dev.off()
bitmap(file='test4.png')
cpgram(resid, main='Residual Cumulative Periodogram')
dev.off()
bitmap(file='test5.png')
hist(resid, main='Residual Histogram', xlab='values of Residuals')
dev.off()
bitmap(file='test6.png')
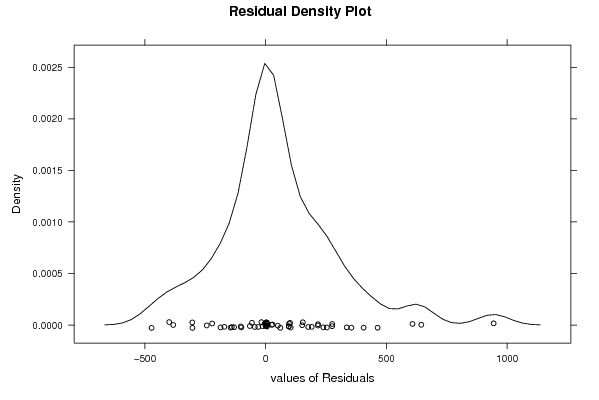
densityplot(~resid,col='black',main='Residual Density Plot', xlab='values of Residuals')
dev.off()
bitmap(file='test7.png')
qqnorm(resid, main='Residual Normal Q-Q Plot')
dev.off()
ncols <- length(selection[[1]][1,])
nrows <- length(selection[[2]][,1])-1
load(file='createtable')
a<-table.start()
a<-table.row.start(a)
a<-table.element(a,'ARIMA Parameter Estimation and Backward Selection', ncols+1,TRUE)
a<-table.row.end(a)
a<-table.row.start(a)
a<-table.element(a,'Iteration', header=TRUE)
for (i in 1:ncols) {
a<-table.element(a,names(selection[[3]][[1]]$coef)[i],header=TRUE)
}
a<-table.row.end(a)
for (j in 1:nrows) {
a<-table.row.start(a)
mydum <- 'Estimates ('
mydum <- paste(mydum,j)
mydum <- paste(mydum,')')
a<-table.element(a,mydum, header=TRUE)
for (i in 1:ncols) {
a<-table.element(a,round(selection[[1]][j,i],4))
}
a<-table.row.end(a)
a<-table.row.start(a)
a<-table.element(a,'(p-val)', header=TRUE)
for (i in 1:ncols) {
mydum <- '('
mydum <- paste(mydum,round(selection[[2]][j,i],4),sep='')
mydum <- paste(mydum,')')
a<-table.element(a,mydum)
}
a<-table.row.end(a)
}
a<-table.end(a)
table.save(a,file='mytable.tab')
a<-table.start()
a<-table.row.start(a)
a<-table.element(a,'Estimated ARIMA Residuals', 1,TRUE)
a<-table.row.end(a)
a<-table.row.start(a)
a<-table.element(a,'Value', 1,TRUE)
a<-table.row.end(a)
for (i in (par4*par5+par3):length(resid)) {
a<-table.row.start(a)
a<-table.element(a,resid[i])
a<-table.row.end(a)
}
a<-table.end(a)
table.save(a,file='mytable1.tab')