Free Statistics

of Irreproducible Research!

Author's title

Author*Unverified author*
R Software Modulerwasp_autocorrelation.wasp
Title produced by software(Partial) Autocorrelation Function
Date of computationWed, 28 Nov 2007 12:19:56 -0700
Cite this page as followsStatistical Computations at FreeStatistics.org, Office for Research Development and Education, URL https://freestatistics.org/blog/index.php?v=date/2007/Nov/28/t1196277026ombej7ii2xt5jrp.htm/, Retrieved Thu, 02 May 2024 00:03:40 +0000
Statistical Computations at FreeStatistics.org, Office for Research Development and Education, URL https://freestatistics.org/blog/index.php?pk=7239, Retrieved Thu, 02 May 2024 00:03:40 +0000
QR Codes:

Original text written by user:
IsPrivate?No (this computation is public)
User-defined keywords
Estimated Impact186
Family? (F = Feedback message, R = changed R code, M = changed R Module, P = changed Parameters, D = changed Data)
-       [(Partial) Autocorrelation Function] [workshop 7 Q2 I] [2007-11-28 19:19:56] [6bae8369195607c4cbc8a8485fed7b2f] [Current]
Feedback Forum

Post a new message
Dataseries X:
93.5
94.7
112.9
99.2
105.6
113
83.1
81.1
96.9
104.3
97.7
102.6
89.9
96
112.7
107.1
106.2
121
101.2
83.2
105.1
113.3
99.1
100.3
93.5
98.8
106.2
98.3
102.1
117.1
101.5
80.5
105.9
109.5
97.2
114.5
93.5
100.9
121.1
116.5
109.3
118.1
108.3
105.4
116.2
111.2
105.8
122.7
99.5
107.9
124.6
115
110.3
132.7
99.7
96.5
118.7
112.9
130.5
137.9
115
116.8
140.9
120.7
134.2
147.3
112.4
107.1
128.4
137.7
135
151
137.4
132.4
161.3
139.8
146
154.6
142.1
120.5


Summary of compuational transaction
Raw Inputview raw input (R code)
Raw Outputview raw output of R engine
Computing time1 seconds
R Server'Gwilym Jenkins' @ 72.249.127.135

\begin{tabular}{lllllllll}
\hline
Summary of compuational transaction \tabularnewline
Raw Input & view raw input (R code)  \tabularnewline
Raw Output & view raw output of R engine  \tabularnewline
Computing time & 1 seconds \tabularnewline
R Server & 'Gwilym Jenkins' @ 72.249.127.135 \tabularnewline
\hline
\end{tabular}
%Source: https://freestatistics.org/blog/index.php?pk=7239&T=0

[TABLE]
[ROW][C]Summary of compuational transaction[/C][/ROW]
[ROW][C]Raw Input[/C][C]view raw input (R code) [/C][/ROW]
[ROW][C]Raw Output[/C][C]view raw output of R engine [/C][/ROW]
[ROW][C]Computing time[/C][C]1 seconds[/C][/ROW]
[ROW][C]R Server[/C][C]'Gwilym Jenkins' @ 72.249.127.135[/C][/ROW]
[/TABLE]
Source: https://freestatistics.org/blog/index.php?pk=7239&T=0

Globally Unique Identifier (entire table): ba.freestatistics.org/blog/index.php?pk=7239&T=0

As an alternative you can also use a QR Code:  

The GUIDs for individual cells are displayed in the table below:

Summary of compuational transaction
Raw Inputview raw input (R code)
Raw Outputview raw output of R engine
Computing time1 seconds
R Server'Gwilym Jenkins' @ 72.249.127.135


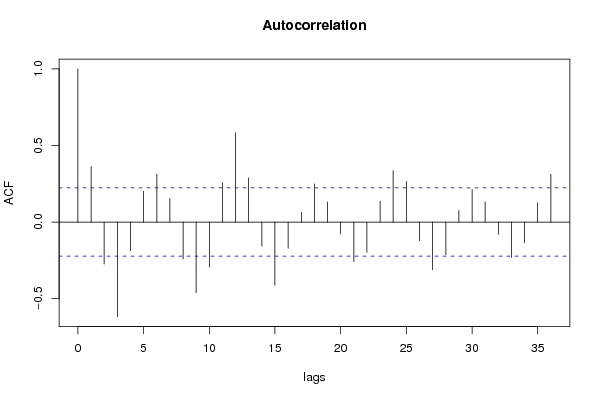
Autocorrelation Function
Time lag kACF(k)T-STATP-value
018.7750
10.3616263.17330.001083
2-0.274048-2.40480.990708
3-0.618236-5.4251
4-0.187875-1.64860.948348
50.201111.76470.040787
60.3141782.75690.003641
70.1534471.34650.091048
8-0.240869-2.11360.981107
9-0.462604-4.05930.999941
10-0.293262-2.57340.994004
110.2580922.26480.01317
120.5827955.1141e-06
130.2885162.53170.006694
14-0.157544-1.38240.914583
15-0.413523-3.62860.999745
16-0.172071-1.50990.932421
170.0635280.55750.289416
180.2487092.18240.016064
190.1311251.15060.126726
20-0.077698-0.68180.751293
21-0.259053-2.27320.987098
22-0.197917-1.73670.956781
230.1355461.18940.118966
240.3352252.94160.002156
250.2649992.32540.011344
26-0.122396-1.0740.856915
27-0.31249-2.74210.996206
28-0.21331-1.87180.967483
290.0752210.66010.255592
300.2121591.86170.033232
310.1322641.16060.124694
32-0.079994-0.70190.757584
33-0.230469-2.02240.976694
34-0.134912-1.18380.879943
350.1263271.10850.135545

\begin{tabular}{lllllllll}
\hline
Autocorrelation Function \tabularnewline
Time lag k & ACF(k) & T-STAT & P-value \tabularnewline
0 & 1 & 8.775 & 0 \tabularnewline
1 & 0.361626 & 3.1733 & 0.001083 \tabularnewline
2 & -0.274048 & -2.4048 & 0.990708 \tabularnewline
3 & -0.618236 & -5.425 & 1 \tabularnewline
4 & -0.187875 & -1.6486 & 0.948348 \tabularnewline
5 & 0.20111 & 1.7647 & 0.040787 \tabularnewline
6 & 0.314178 & 2.7569 & 0.003641 \tabularnewline
7 & 0.153447 & 1.3465 & 0.091048 \tabularnewline
8 & -0.240869 & -2.1136 & 0.981107 \tabularnewline
9 & -0.462604 & -4.0593 & 0.999941 \tabularnewline
10 & -0.293262 & -2.5734 & 0.994004 \tabularnewline
11 & 0.258092 & 2.2648 & 0.01317 \tabularnewline
12 & 0.582795 & 5.114 & 1e-06 \tabularnewline
13 & 0.288516 & 2.5317 & 0.006694 \tabularnewline
14 & -0.157544 & -1.3824 & 0.914583 \tabularnewline
15 & -0.413523 & -3.6286 & 0.999745 \tabularnewline
16 & -0.172071 & -1.5099 & 0.932421 \tabularnewline
17 & 0.063528 & 0.5575 & 0.289416 \tabularnewline
18 & 0.248709 & 2.1824 & 0.016064 \tabularnewline
19 & 0.131125 & 1.1506 & 0.126726 \tabularnewline
20 & -0.077698 & -0.6818 & 0.751293 \tabularnewline
21 & -0.259053 & -2.2732 & 0.987098 \tabularnewline
22 & -0.197917 & -1.7367 & 0.956781 \tabularnewline
23 & 0.135546 & 1.1894 & 0.118966 \tabularnewline
24 & 0.335225 & 2.9416 & 0.002156 \tabularnewline
25 & 0.264999 & 2.3254 & 0.011344 \tabularnewline
26 & -0.122396 & -1.074 & 0.856915 \tabularnewline
27 & -0.31249 & -2.7421 & 0.996206 \tabularnewline
28 & -0.21331 & -1.8718 & 0.967483 \tabularnewline
29 & 0.075221 & 0.6601 & 0.255592 \tabularnewline
30 & 0.212159 & 1.8617 & 0.033232 \tabularnewline
31 & 0.132264 & 1.1606 & 0.124694 \tabularnewline
32 & -0.079994 & -0.7019 & 0.757584 \tabularnewline
33 & -0.230469 & -2.0224 & 0.976694 \tabularnewline
34 & -0.134912 & -1.1838 & 0.879943 \tabularnewline
35 & 0.126327 & 1.1085 & 0.135545 \tabularnewline
\hline
\end{tabular}
%Source: https://freestatistics.org/blog/index.php?pk=7239&T=1

[TABLE]
[ROW][C]Autocorrelation Function[/C][/ROW]
[ROW][C]Time lag k[/C][C]ACF(k)[/C][C]T-STAT[/C][C]P-value[/C][/ROW]
[ROW][C]0[/C][C]1[/C][C]8.775[/C][C]0[/C][/ROW]
[ROW][C]1[/C][C]0.361626[/C][C]3.1733[/C][C]0.001083[/C][/ROW]
[ROW][C]2[/C][C]-0.274048[/C][C]-2.4048[/C][C]0.990708[/C][/ROW]
[ROW][C]3[/C][C]-0.618236[/C][C]-5.425[/C][C]1[/C][/ROW]
[ROW][C]4[/C][C]-0.187875[/C][C]-1.6486[/C][C]0.948348[/C][/ROW]
[ROW][C]5[/C][C]0.20111[/C][C]1.7647[/C][C]0.040787[/C][/ROW]
[ROW][C]6[/C][C]0.314178[/C][C]2.7569[/C][C]0.003641[/C][/ROW]
[ROW][C]7[/C][C]0.153447[/C][C]1.3465[/C][C]0.091048[/C][/ROW]
[ROW][C]8[/C][C]-0.240869[/C][C]-2.1136[/C][C]0.981107[/C][/ROW]
[ROW][C]9[/C][C]-0.462604[/C][C]-4.0593[/C][C]0.999941[/C][/ROW]
[ROW][C]10[/C][C]-0.293262[/C][C]-2.5734[/C][C]0.994004[/C][/ROW]
[ROW][C]11[/C][C]0.258092[/C][C]2.2648[/C][C]0.01317[/C][/ROW]
[ROW][C]12[/C][C]0.582795[/C][C]5.114[/C][C]1e-06[/C][/ROW]
[ROW][C]13[/C][C]0.288516[/C][C]2.5317[/C][C]0.006694[/C][/ROW]
[ROW][C]14[/C][C]-0.157544[/C][C]-1.3824[/C][C]0.914583[/C][/ROW]
[ROW][C]15[/C][C]-0.413523[/C][C]-3.6286[/C][C]0.999745[/C][/ROW]
[ROW][C]16[/C][C]-0.172071[/C][C]-1.5099[/C][C]0.932421[/C][/ROW]
[ROW][C]17[/C][C]0.063528[/C][C]0.5575[/C][C]0.289416[/C][/ROW]
[ROW][C]18[/C][C]0.248709[/C][C]2.1824[/C][C]0.016064[/C][/ROW]
[ROW][C]19[/C][C]0.131125[/C][C]1.1506[/C][C]0.126726[/C][/ROW]
[ROW][C]20[/C][C]-0.077698[/C][C]-0.6818[/C][C]0.751293[/C][/ROW]
[ROW][C]21[/C][C]-0.259053[/C][C]-2.2732[/C][C]0.987098[/C][/ROW]
[ROW][C]22[/C][C]-0.197917[/C][C]-1.7367[/C][C]0.956781[/C][/ROW]
[ROW][C]23[/C][C]0.135546[/C][C]1.1894[/C][C]0.118966[/C][/ROW]
[ROW][C]24[/C][C]0.335225[/C][C]2.9416[/C][C]0.002156[/C][/ROW]
[ROW][C]25[/C][C]0.264999[/C][C]2.3254[/C][C]0.011344[/C][/ROW]
[ROW][C]26[/C][C]-0.122396[/C][C]-1.074[/C][C]0.856915[/C][/ROW]
[ROW][C]27[/C][C]-0.31249[/C][C]-2.7421[/C][C]0.996206[/C][/ROW]
[ROW][C]28[/C][C]-0.21331[/C][C]-1.8718[/C][C]0.967483[/C][/ROW]
[ROW][C]29[/C][C]0.075221[/C][C]0.6601[/C][C]0.255592[/C][/ROW]
[ROW][C]30[/C][C]0.212159[/C][C]1.8617[/C][C]0.033232[/C][/ROW]
[ROW][C]31[/C][C]0.132264[/C][C]1.1606[/C][C]0.124694[/C][/ROW]
[ROW][C]32[/C][C]-0.079994[/C][C]-0.7019[/C][C]0.757584[/C][/ROW]
[ROW][C]33[/C][C]-0.230469[/C][C]-2.0224[/C][C]0.976694[/C][/ROW]
[ROW][C]34[/C][C]-0.134912[/C][C]-1.1838[/C][C]0.879943[/C][/ROW]
[ROW][C]35[/C][C]0.126327[/C][C]1.1085[/C][C]0.135545[/C][/ROW]
[/TABLE]
Source: https://freestatistics.org/blog/index.php?pk=7239&T=1

Globally Unique Identifier (entire table): ba.freestatistics.org/blog/index.php?pk=7239&T=1

As an alternative you can also use a QR Code:  

The GUIDs for individual cells are displayed in the table below:

Autocorrelation Function
Time lag kACF(k)T-STATP-value
018.7750
10.3616263.17330.001083
2-0.274048-2.40480.990708
3-0.618236-5.4251
4-0.187875-1.64860.948348
50.201111.76470.040787
60.3141782.75690.003641
70.1534471.34650.091048
8-0.240869-2.11360.981107
9-0.462604-4.05930.999941
10-0.293262-2.57340.994004
110.2580922.26480.01317
120.5827955.1141e-06
130.2885162.53170.006694
14-0.157544-1.38240.914583
15-0.413523-3.62860.999745
16-0.172071-1.50990.932421
170.0635280.55750.289416
180.2487092.18240.016064
190.1311251.15060.126726
20-0.077698-0.68180.751293
21-0.259053-2.27320.987098
22-0.197917-1.73670.956781
230.1355461.18940.118966
240.3352252.94160.002156
250.2649992.32540.011344
26-0.122396-1.0740.856915
27-0.31249-2.74210.996206
28-0.21331-1.87180.967483
290.0752210.66010.255592
300.2121591.86170.033232
310.1322641.16060.124694
32-0.079994-0.70190.757584
33-0.230469-2.02240.976694
34-0.134912-1.18380.879943
350.1263271.10850.135545


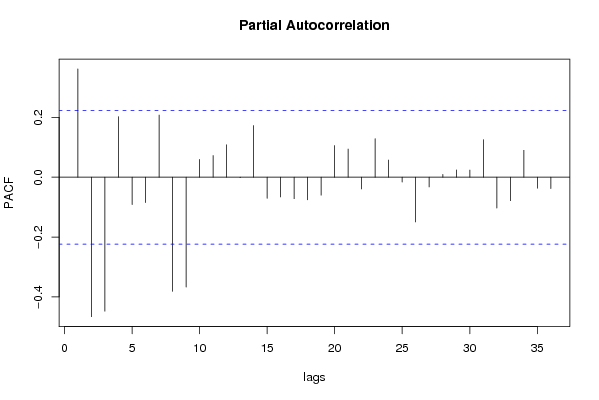
Partial Autocorrelation Function
Time lag kPACF(k)T-STATP-value
00.3616263.17330.001083
1-0.465726-4.08670.999947
2-0.447427-3.92620.999907
30.2023291.77540.039889
4-0.091524-0.80310.78781
5-0.084582-0.74220.769889
60.2074781.82060.036275
7-0.381092-3.34410.999361
8-0.366948-3.220.999061
90.0594470.52160.301707
100.0722760.63420.263909
110.1080850.94840.172936
12-0.001617-0.01420.505642
130.1724471.51320.06716
14-0.070426-0.6180.730795
15-0.065732-0.57680.717121
16-0.071613-0.62840.734198
17-0.075556-0.6630.745345
18-0.060008-0.52660.699997
190.1057330.92780.178205
200.094210.82670.205484
21-0.039308-0.34490.634455
220.1284991.12760.1315
230.0572090.5020.308548
24-0.016353-0.14350.556864
25-0.149186-1.30910.902803
26-0.03266-0.28660.612402
270.009170.08050.468039
280.0243810.21390.415577
290.0238950.20970.417235
300.1255341.10160.137044
31-0.103003-0.90380.815552
32-0.078466-0.68850.753408
330.0900470.79020.21593
34-0.036504-0.32030.625204
35-0.037723-0.3310.629237

\begin{tabular}{lllllllll}
\hline
Partial Autocorrelation Function \tabularnewline
Time lag k & PACF(k) & T-STAT & P-value \tabularnewline
0 & 0.361626 & 3.1733 & 0.001083 \tabularnewline
1 & -0.465726 & -4.0867 & 0.999947 \tabularnewline
2 & -0.447427 & -3.9262 & 0.999907 \tabularnewline
3 & 0.202329 & 1.7754 & 0.039889 \tabularnewline
4 & -0.091524 & -0.8031 & 0.78781 \tabularnewline
5 & -0.084582 & -0.7422 & 0.769889 \tabularnewline
6 & 0.207478 & 1.8206 & 0.036275 \tabularnewline
7 & -0.381092 & -3.3441 & 0.999361 \tabularnewline
8 & -0.366948 & -3.22 & 0.999061 \tabularnewline
9 & 0.059447 & 0.5216 & 0.301707 \tabularnewline
10 & 0.072276 & 0.6342 & 0.263909 \tabularnewline
11 & 0.108085 & 0.9484 & 0.172936 \tabularnewline
12 & -0.001617 & -0.0142 & 0.505642 \tabularnewline
13 & 0.172447 & 1.5132 & 0.06716 \tabularnewline
14 & -0.070426 & -0.618 & 0.730795 \tabularnewline
15 & -0.065732 & -0.5768 & 0.717121 \tabularnewline
16 & -0.071613 & -0.6284 & 0.734198 \tabularnewline
17 & -0.075556 & -0.663 & 0.745345 \tabularnewline
18 & -0.060008 & -0.5266 & 0.699997 \tabularnewline
19 & 0.105733 & 0.9278 & 0.178205 \tabularnewline
20 & 0.09421 & 0.8267 & 0.205484 \tabularnewline
21 & -0.039308 & -0.3449 & 0.634455 \tabularnewline
22 & 0.128499 & 1.1276 & 0.1315 \tabularnewline
23 & 0.057209 & 0.502 & 0.308548 \tabularnewline
24 & -0.016353 & -0.1435 & 0.556864 \tabularnewline
25 & -0.149186 & -1.3091 & 0.902803 \tabularnewline
26 & -0.03266 & -0.2866 & 0.612402 \tabularnewline
27 & 0.00917 & 0.0805 & 0.468039 \tabularnewline
28 & 0.024381 & 0.2139 & 0.415577 \tabularnewline
29 & 0.023895 & 0.2097 & 0.417235 \tabularnewline
30 & 0.125534 & 1.1016 & 0.137044 \tabularnewline
31 & -0.103003 & -0.9038 & 0.815552 \tabularnewline
32 & -0.078466 & -0.6885 & 0.753408 \tabularnewline
33 & 0.090047 & 0.7902 & 0.21593 \tabularnewline
34 & -0.036504 & -0.3203 & 0.625204 \tabularnewline
35 & -0.037723 & -0.331 & 0.629237 \tabularnewline
\hline
\end{tabular}
%Source: https://freestatistics.org/blog/index.php?pk=7239&T=2

[TABLE]
[ROW][C]Partial Autocorrelation Function[/C][/ROW]
[ROW][C]Time lag k[/C][C]PACF(k)[/C][C]T-STAT[/C][C]P-value[/C][/ROW]
[ROW][C]0[/C][C]0.361626[/C][C]3.1733[/C][C]0.001083[/C][/ROW]
[ROW][C]1[/C][C]-0.465726[/C][C]-4.0867[/C][C]0.999947[/C][/ROW]
[ROW][C]2[/C][C]-0.447427[/C][C]-3.9262[/C][C]0.999907[/C][/ROW]
[ROW][C]3[/C][C]0.202329[/C][C]1.7754[/C][C]0.039889[/C][/ROW]
[ROW][C]4[/C][C]-0.091524[/C][C]-0.8031[/C][C]0.78781[/C][/ROW]
[ROW][C]5[/C][C]-0.084582[/C][C]-0.7422[/C][C]0.769889[/C][/ROW]
[ROW][C]6[/C][C]0.207478[/C][C]1.8206[/C][C]0.036275[/C][/ROW]
[ROW][C]7[/C][C]-0.381092[/C][C]-3.3441[/C][C]0.999361[/C][/ROW]
[ROW][C]8[/C][C]-0.366948[/C][C]-3.22[/C][C]0.999061[/C][/ROW]
[ROW][C]9[/C][C]0.059447[/C][C]0.5216[/C][C]0.301707[/C][/ROW]
[ROW][C]10[/C][C]0.072276[/C][C]0.6342[/C][C]0.263909[/C][/ROW]
[ROW][C]11[/C][C]0.108085[/C][C]0.9484[/C][C]0.172936[/C][/ROW]
[ROW][C]12[/C][C]-0.001617[/C][C]-0.0142[/C][C]0.505642[/C][/ROW]
[ROW][C]13[/C][C]0.172447[/C][C]1.5132[/C][C]0.06716[/C][/ROW]
[ROW][C]14[/C][C]-0.070426[/C][C]-0.618[/C][C]0.730795[/C][/ROW]
[ROW][C]15[/C][C]-0.065732[/C][C]-0.5768[/C][C]0.717121[/C][/ROW]
[ROW][C]16[/C][C]-0.071613[/C][C]-0.6284[/C][C]0.734198[/C][/ROW]
[ROW][C]17[/C][C]-0.075556[/C][C]-0.663[/C][C]0.745345[/C][/ROW]
[ROW][C]18[/C][C]-0.060008[/C][C]-0.5266[/C][C]0.699997[/C][/ROW]
[ROW][C]19[/C][C]0.105733[/C][C]0.9278[/C][C]0.178205[/C][/ROW]
[ROW][C]20[/C][C]0.09421[/C][C]0.8267[/C][C]0.205484[/C][/ROW]
[ROW][C]21[/C][C]-0.039308[/C][C]-0.3449[/C][C]0.634455[/C][/ROW]
[ROW][C]22[/C][C]0.128499[/C][C]1.1276[/C][C]0.1315[/C][/ROW]
[ROW][C]23[/C][C]0.057209[/C][C]0.502[/C][C]0.308548[/C][/ROW]
[ROW][C]24[/C][C]-0.016353[/C][C]-0.1435[/C][C]0.556864[/C][/ROW]
[ROW][C]25[/C][C]-0.149186[/C][C]-1.3091[/C][C]0.902803[/C][/ROW]
[ROW][C]26[/C][C]-0.03266[/C][C]-0.2866[/C][C]0.612402[/C][/ROW]
[ROW][C]27[/C][C]0.00917[/C][C]0.0805[/C][C]0.468039[/C][/ROW]
[ROW][C]28[/C][C]0.024381[/C][C]0.2139[/C][C]0.415577[/C][/ROW]
[ROW][C]29[/C][C]0.023895[/C][C]0.2097[/C][C]0.417235[/C][/ROW]
[ROW][C]30[/C][C]0.125534[/C][C]1.1016[/C][C]0.137044[/C][/ROW]
[ROW][C]31[/C][C]-0.103003[/C][C]-0.9038[/C][C]0.815552[/C][/ROW]
[ROW][C]32[/C][C]-0.078466[/C][C]-0.6885[/C][C]0.753408[/C][/ROW]
[ROW][C]33[/C][C]0.090047[/C][C]0.7902[/C][C]0.21593[/C][/ROW]
[ROW][C]34[/C][C]-0.036504[/C][C]-0.3203[/C][C]0.625204[/C][/ROW]
[ROW][C]35[/C][C]-0.037723[/C][C]-0.331[/C][C]0.629237[/C][/ROW]
[/TABLE]
Source: https://freestatistics.org/blog/index.php?pk=7239&T=2

Globally Unique Identifier (entire table): ba.freestatistics.org/blog/index.php?pk=7239&T=2

As an alternative you can also use a QR Code:  

The GUIDs for individual cells are displayed in the table below:

Partial Autocorrelation Function
Time lag kPACF(k)T-STATP-value
00.3616263.17330.001083
1-0.465726-4.08670.999947
2-0.447427-3.92620.999907
30.2023291.77540.039889
4-0.091524-0.80310.78781
5-0.084582-0.74220.769889
60.2074781.82060.036275
7-0.381092-3.34410.999361
8-0.366948-3.220.999061
90.0594470.52160.301707
100.0722760.63420.263909
110.1080850.94840.172936
12-0.001617-0.01420.505642
130.1724471.51320.06716
14-0.070426-0.6180.730795
15-0.065732-0.57680.717121
16-0.071613-0.62840.734198
17-0.075556-0.6630.745345
18-0.060008-0.52660.699997
190.1057330.92780.178205
200.094210.82670.205484
21-0.039308-0.34490.634455
220.1284991.12760.1315
230.0572090.5020.308548
24-0.016353-0.14350.556864
25-0.149186-1.30910.902803
26-0.03266-0.28660.612402
270.009170.08050.468039
280.0243810.21390.415577
290.0238950.20970.417235
300.1255341.10160.137044
31-0.103003-0.90380.815552
32-0.078466-0.68850.753408
330.0900470.79020.21593
34-0.036504-0.32030.625204
35-0.037723-0.3310.629237


Parameters (Session):
par1 = 36 ; par2 = 1 ; par3 = 0 ; par4 = 1 ; par5 = 3 ;
Parameters (R input):
par1 = 36 ; par2 = 1 ; par3 = 0 ; par4 = 1 ; par5 = 3 ;
R code (references can be found in the software module):
if (par1 == 'Default') {
par1 = 10*log10(length(x))
} else {
par1 <- as.numeric(par1)
}
par2 <- as.numeric(par2)
par3 <- as.numeric(par3)
par4 <- as.numeric(par4)
par5 <- as.numeric(par5)
if (par2 == 0) {
x <- log(x)
} else {
x <- (x ^ par2 - 1) / par2
}
if (par3 > 0) x <- diff(x,lag=1,difference=par3)
if (par4 > 0) x <- diff(x,lag=par5,difference=par4)
bitmap(file='pic1.png')
racf <- acf(x,par1,main='Autocorrelation',xlab='lags',ylab='ACF')
dev.off()
bitmap(file='pic2.png')
rpacf <- pacf(x,par1,main='Partial Autocorrelation',xlab='lags',ylab='PACF')
dev.off()
(myacf <- c(racf$acf))
(mypacf <- c(rpacf$acf))
lengthx <- length(x)
sqrtn <- sqrt(lengthx)
load(file='createtable')
a<-table.start()
a<-table.row.start(a)
a<-table.element(a,'Autocorrelation Function',4,TRUE)
a<-table.row.end(a)
a<-table.row.start(a)
a<-table.element(a,'Time lag k',header=TRUE)
a<-table.element(a,hyperlink('basics.htm','ACF(k)','click here for more information about the Autocorrelation Function'),header=TRUE)
a<-table.element(a,'T-STAT',header=TRUE)
a<-table.element(a,'P-value',header=TRUE)
a<-table.row.end(a)
for (i in 1:par1) {
a<-table.row.start(a)
a<-table.element(a,i-1,header=TRUE)
a<-table.element(a,round(myacf[i],6))
mytstat <- myacf[i]*sqrtn
a<-table.element(a,round(mytstat,4))
a<-table.element(a,round(1-pt(mytstat,lengthx),6))
a<-table.row.end(a)
}
a<-table.end(a)
table.save(a,file='mytable.tab')
a<-table.start()
a<-table.row.start(a)
a<-table.element(a,'Partial Autocorrelation Function',4,TRUE)
a<-table.row.end(a)
a<-table.row.start(a)
a<-table.element(a,'Time lag k',header=TRUE)
a<-table.element(a,hyperlink('basics.htm','PACF(k)','click here for more information about the Partial Autocorrelation Function'),header=TRUE)
a<-table.element(a,'T-STAT',header=TRUE)
a<-table.element(a,'P-value',header=TRUE)
a<-table.row.end(a)
for (i in 1:par1) {
a<-table.row.start(a)
a<-table.element(a,i-1,header=TRUE)
a<-table.element(a,round(mypacf[i],6))
mytstat <- mypacf[i]*sqrtn
a<-table.element(a,round(mytstat,4))
a<-table.element(a,round(1-pt(mytstat,lengthx),6))
a<-table.row.end(a)
}
a<-table.end(a)
table.save(a,file='mytable1.tab')