Free Statistics
of Irreproducible Research!
Description of Statistical Computation | |||||||||||||||||||||||||||||||||||||||||||||||||||||||||||||||||||||
|---|---|---|---|---|---|---|---|---|---|---|---|---|---|---|---|---|---|---|---|---|---|---|---|---|---|---|---|---|---|---|---|---|---|---|---|---|---|---|---|---|---|---|---|---|---|---|---|---|---|---|---|---|---|---|---|---|---|---|---|---|---|---|---|---|---|---|---|---|---|
| Author's title | |||||||||||||||||||||||||||||||||||||||||||||||||||||||||||||||||||||
| Author | *Unverified author* | ||||||||||||||||||||||||||||||||||||||||||||||||||||||||||||||||||||
| R Software Module | rwasp_pairs.wasp | ||||||||||||||||||||||||||||||||||||||||||||||||||||||||||||||||||||
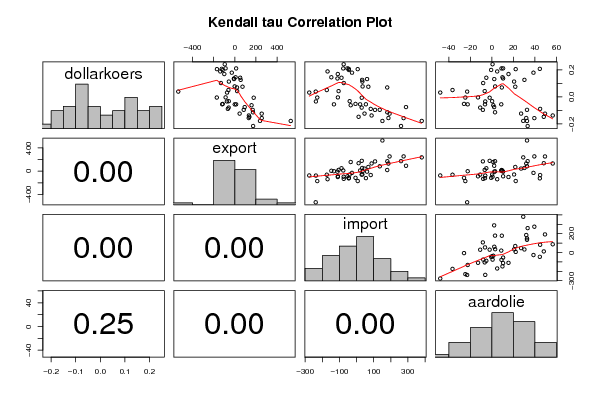
| Title produced by software | Kendall tau Correlation Matrix | ||||||||||||||||||||||||||||||||||||||||||||||||||||||||||||||||||||
| Date of computation | Wed, 28 Nov 2007 11:58:06 -0700 | ||||||||||||||||||||||||||||||||||||||||||||||||||||||||||||||||||||
| Cite this page as follows | Statistical Computations at FreeStatistics.org, Office for Research Development and Education, URL https://freestatistics.org/blog/index.php?v=date/2007/Nov/28/t11962756950of10i1pignqn01.htm/, Retrieved Thu, 02 May 2024 00:58:22 +0000 | ||||||||||||||||||||||||||||||||||||||||||||||||||||||||||||||||||||
| Statistical Computations at FreeStatistics.org, Office for Research Development and Education, URL https://freestatistics.org/blog/index.php?pk=7218, Retrieved Thu, 02 May 2024 00:58:22 +0000 | |||||||||||||||||||||||||||||||||||||||||||||||||||||||||||||||||||||
| QR Codes: | |||||||||||||||||||||||||||||||||||||||||||||||||||||||||||||||||||||
|
| |||||||||||||||||||||||||||||||||||||||||||||||||||||||||||||||||||||
| Original text written by user: | |||||||||||||||||||||||||||||||||||||||||||||||||||||||||||||||||||||
| IsPrivate? | No (this computation is public) | ||||||||||||||||||||||||||||||||||||||||||||||||||||||||||||||||||||
| User-defined keywords | |||||||||||||||||||||||||||||||||||||||||||||||||||||||||||||||||||||
| Estimated Impact | 165 | ||||||||||||||||||||||||||||||||||||||||||||||||||||||||||||||||||||
Tree of Dependent Computations | |||||||||||||||||||||||||||||||||||||||||||||||||||||||||||||||||||||
| Family? (F = Feedback message, R = changed R code, M = changed R Module, P = changed Parameters, D = changed Data) | |||||||||||||||||||||||||||||||||||||||||||||||||||||||||||||||||||||
| - [Kendall tau Correlation Matrix] [Kendall tau matri...] [2007-11-28 18:58:06] [cb51ec34031fa6f7825ad77351c1efd8] [Current] | |||||||||||||||||||||||||||||||||||||||||||||||||||||||||||||||||||||
| Feedback Forum | |||||||||||||||||||||||||||||||||||||||||||||||||||||||||||||||||||||
Post a new message | |||||||||||||||||||||||||||||||||||||||||||||||||||||||||||||||||||||
Dataset | |||||||||||||||||||||||||||||||||||||||||||||||||||||||||||||||||||||
| Dataseries X: | |||||||||||||||||||||||||||||||||||||||||||||||||||||||||||||||||||||
-0,1471 137,1 11,9 48,3 -0,1374 132,7 87,7 56,6 -0,124 254,1 192,7 49,4 -0,1234 45,1 46,4 27,2 -0,1568 254,6 274,6 39,5 -0,0886 -66,6 82,6 44,9 -0,0956 84,1 135,3 32,7 -0,1563 131,5 186 32 -0,178 529 150,8 32,7 -0,2154 172,9 259,6 33,3 -0,1774 238,1 380,6 29,2 -0,1137 171,3 179,5 3 -0,0754 93,1 288,8 2,2 -0,0617 158,1 -34,4 1,4 -0,0548 -120,1 54,6 -6,3 -0,055 12,2 20,6 8,8 -0,0318 -57,8 -40,3 0,3 -0,096 168,9 107,9 -8,3 -0,079 -58,6 29,8 -10,8 -0,0036 -87,7 -109,2 -12,8 0,039 -535,8 -238,6 -22,9 0,0507 -60,9 -173,9 -36,5 0,0319 -73,9 -276,4 -47,9 -0,0049 -170,9 -229,7 -24,6 -0,055 -0,8 -132,1 -22,4 -0,0517 -114,7 -6,3 -25,8 -0,0337 -75,3 -237,6 -6,1 -0,0062 178,4 30,4 -2 0,0428 21,9 -105 -6,6 0,1022 -131,9 -75 -8 0,1315 -8,3 61,2 2,3 0,0773 -2,1 35,2 3,1 0,0697 19,9 179 9,3 0,0752 72,3 68,7 21,8 0,1131 -57 33,8 20,7 0,1259 55,1 32,6 30,3 0,1789 -29,1 -26,8 38,7 0,2073 -123,8 -45,7 44,6 0,2049 -169,7 6,6 22,2 0,199 -115,3 -45,2 -0,6 0,2412 -95,7 -75,3 0,7 0,2109 -88 -53,4 10,5 0,145 6,6 -147,5 9,9 0,1361 -8,9 -111,8 10,5 0,1414 50,3 -88,1 -5,1 0,1881 -138,1 -169,5 5 0,1688 -100,1 -109,6 15,5 0,2103 12,1 -77,8 9 | |||||||||||||||||||||||||||||||||||||||||||||||||||||||||||||||||||||
Tables (Output of Computation) | |||||||||||||||||||||||||||||||||||||||||||||||||||||||||||||||||||||
| |||||||||||||||||||||||||||||||||||||||||||||||||||||||||||||||||||||
Figures (Output of Computation) | |||||||||||||||||||||||||||||||||||||||||||||||||||||||||||||||||||||
Input Parameters & R Code | |||||||||||||||||||||||||||||||||||||||||||||||||||||||||||||||||||||
| Parameters (Session): | |||||||||||||||||||||||||||||||||||||||||||||||||||||||||||||||||||||
| Parameters (R input): | |||||||||||||||||||||||||||||||||||||||||||||||||||||||||||||||||||||
| R code (references can be found in the software module): | |||||||||||||||||||||||||||||||||||||||||||||||||||||||||||||||||||||
panel.tau <- function(x, y, digits=2, prefix='', cex.cor) | |||||||||||||||||||||||||||||||||||||||||||||||||||||||||||||||||||||