Free Statistics

of Irreproducible Research!

Author's title

Author*Unverified author*
R Software Modulerwasp_autocorrelation.wasp
Title produced by software(Partial) Autocorrelation Function
Date of computationWed, 28 Nov 2007 11:27:56 -0700
Cite this page as followsStatistical Computations at FreeStatistics.org, Office for Research Development and Education, URL https://freestatistics.org/blog/index.php?v=date/2007/Nov/28/t1196273995q9n98vbedi58wik.htm/, Retrieved Thu, 02 May 2024 00:51:59 +0000
Statistical Computations at FreeStatistics.org, Office for Research Development and Education, URL https://freestatistics.org/blog/index.php?pk=7201, Retrieved Thu, 02 May 2024 00:51:59 +0000
QR Codes:

Original text written by user:
IsPrivate?No (this computation is public)
User-defined keywords
Estimated Impact200
Family? (F = Feedback message, R = changed R code, M = changed R Module, P = changed Parameters, D = changed Data)
-       [(Partial) Autocorrelation Function] [Totale uitvoer] [2007-11-28 18:27:56] [89d26cd0a44959d9c8b169f34617598a] [Current]
Feedback Forum

Post a new message
Dataseries X:
15023.6
12083
15761.3
16943
15070.3
13659.6
14768.9
14725.1
15998.1
15370.6
14956.9
15469.7
15101.8
11703.7
16283.6
16726.5
14968.9
14861
14583.3
15305.8
17903.9
16379.4
15420.3
17870.5
15912.8
13866.5
17823.2
17872
17420.4
16704.4
15991.2
16583.6
19123.5
17838.7
17209.4
18586.5
16258.1
15141.6
19202.1
17746.5
19090.1
18040.3
17515.5
17751.8
21072.4
17170
19439.5
19795.4
17574.9
16165.4
19464.6
19932.1
19961.2
17343.4
18924.2
18574.1
21350.6
18840.1
20304.8
21132.4
19753.9


Summary of compuational transaction
Raw Inputview raw input (R code)
Raw Outputview raw output of R engine
Computing time1 seconds
R Server'Gwilym Jenkins' @ 72.249.127.135

\begin{tabular}{lllllllll}
\hline
Summary of compuational transaction \tabularnewline
Raw Input & view raw input (R code)  \tabularnewline
Raw Output & view raw output of R engine  \tabularnewline
Computing time & 1 seconds \tabularnewline
R Server & 'Gwilym Jenkins' @ 72.249.127.135 \tabularnewline
\hline
\end{tabular}
%Source: https://freestatistics.org/blog/index.php?pk=7201&T=0

[TABLE]
[ROW][C]Summary of compuational transaction[/C][/ROW]
[ROW][C]Raw Input[/C][C]view raw input (R code) [/C][/ROW]
[ROW][C]Raw Output[/C][C]view raw output of R engine [/C][/ROW]
[ROW][C]Computing time[/C][C]1 seconds[/C][/ROW]
[ROW][C]R Server[/C][C]'Gwilym Jenkins' @ 72.249.127.135[/C][/ROW]
[/TABLE]
Source: https://freestatistics.org/blog/index.php?pk=7201&T=0

Globally Unique Identifier (entire table): ba.freestatistics.org/blog/index.php?pk=7201&T=0

As an alternative you can also use a QR Code:  

The GUIDs for individual cells are displayed in the table below:

Summary of compuational transaction
Raw Inputview raw input (R code)
Raw Outputview raw output of R engine
Computing time1 seconds
R Server'Gwilym Jenkins' @ 72.249.127.135


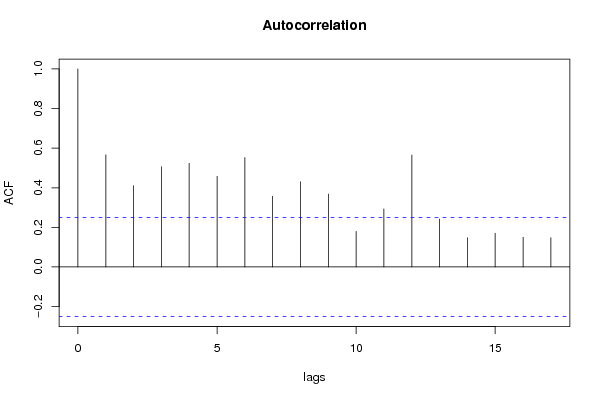
Autocorrelation Function
Time lag kACF(k)T-STATP-value
017.81020
10.5664464.42412e-05
20.4104653.20580.001072
30.5063423.95470.000101
40.52324.08636.5e-05
50.4575113.57330.000348
60.552644.31633e-05
70.3572482.79020.00351
80.4300893.35910.000676
90.3678992.87340.00279
100.1791121.39890.083452
110.2928412.28720.012835
120.5649354.41232.1e-05
130.2417841.88840.031866
140.147541.15230.126842
150.1703311.33030.094182
160.1505851.17610.122061

\begin{tabular}{lllllllll}
\hline
Autocorrelation Function \tabularnewline
Time lag k & ACF(k) & T-STAT & P-value \tabularnewline
0 & 1 & 7.8102 & 0 \tabularnewline
1 & 0.566446 & 4.4241 & 2e-05 \tabularnewline
2 & 0.410465 & 3.2058 & 0.001072 \tabularnewline
3 & 0.506342 & 3.9547 & 0.000101 \tabularnewline
4 & 0.5232 & 4.0863 & 6.5e-05 \tabularnewline
5 & 0.457511 & 3.5733 & 0.000348 \tabularnewline
6 & 0.55264 & 4.3163 & 3e-05 \tabularnewline
7 & 0.357248 & 2.7902 & 0.00351 \tabularnewline
8 & 0.430089 & 3.3591 & 0.000676 \tabularnewline
9 & 0.367899 & 2.8734 & 0.00279 \tabularnewline
10 & 0.179112 & 1.3989 & 0.083452 \tabularnewline
11 & 0.292841 & 2.2872 & 0.012835 \tabularnewline
12 & 0.564935 & 4.4123 & 2.1e-05 \tabularnewline
13 & 0.241784 & 1.8884 & 0.031866 \tabularnewline
14 & 0.14754 & 1.1523 & 0.126842 \tabularnewline
15 & 0.170331 & 1.3303 & 0.094182 \tabularnewline
16 & 0.150585 & 1.1761 & 0.122061 \tabularnewline
\hline
\end{tabular}
%Source: https://freestatistics.org/blog/index.php?pk=7201&T=1

[TABLE]
[ROW][C]Autocorrelation Function[/C][/ROW]
[ROW][C]Time lag k[/C][C]ACF(k)[/C][C]T-STAT[/C][C]P-value[/C][/ROW]
[ROW][C]0[/C][C]1[/C][C]7.8102[/C][C]0[/C][/ROW]
[ROW][C]1[/C][C]0.566446[/C][C]4.4241[/C][C]2e-05[/C][/ROW]
[ROW][C]2[/C][C]0.410465[/C][C]3.2058[/C][C]0.001072[/C][/ROW]
[ROW][C]3[/C][C]0.506342[/C][C]3.9547[/C][C]0.000101[/C][/ROW]
[ROW][C]4[/C][C]0.5232[/C][C]4.0863[/C][C]6.5e-05[/C][/ROW]
[ROW][C]5[/C][C]0.457511[/C][C]3.5733[/C][C]0.000348[/C][/ROW]
[ROW][C]6[/C][C]0.55264[/C][C]4.3163[/C][C]3e-05[/C][/ROW]
[ROW][C]7[/C][C]0.357248[/C][C]2.7902[/C][C]0.00351[/C][/ROW]
[ROW][C]8[/C][C]0.430089[/C][C]3.3591[/C][C]0.000676[/C][/ROW]
[ROW][C]9[/C][C]0.367899[/C][C]2.8734[/C][C]0.00279[/C][/ROW]
[ROW][C]10[/C][C]0.179112[/C][C]1.3989[/C][C]0.083452[/C][/ROW]
[ROW][C]11[/C][C]0.292841[/C][C]2.2872[/C][C]0.012835[/C][/ROW]
[ROW][C]12[/C][C]0.564935[/C][C]4.4123[/C][C]2.1e-05[/C][/ROW]
[ROW][C]13[/C][C]0.241784[/C][C]1.8884[/C][C]0.031866[/C][/ROW]
[ROW][C]14[/C][C]0.14754[/C][C]1.1523[/C][C]0.126842[/C][/ROW]
[ROW][C]15[/C][C]0.170331[/C][C]1.3303[/C][C]0.094182[/C][/ROW]
[ROW][C]16[/C][C]0.150585[/C][C]1.1761[/C][C]0.122061[/C][/ROW]
[/TABLE]
Source: https://freestatistics.org/blog/index.php?pk=7201&T=1

Globally Unique Identifier (entire table): ba.freestatistics.org/blog/index.php?pk=7201&T=1

As an alternative you can also use a QR Code:  

The GUIDs for individual cells are displayed in the table below:

Autocorrelation Function
Time lag kACF(k)T-STATP-value
017.81020
10.5664464.42412e-05
20.4104653.20580.001072
30.5063423.95470.000101
40.52324.08636.5e-05
50.4575113.57330.000348
60.552644.31633e-05
70.3572482.79020.00351
80.4300893.35910.000676
90.3678992.87340.00279
100.1791121.39890.083452
110.2928412.28720.012835
120.5649354.41232.1e-05
130.2417841.88840.031866
140.147541.15230.126842
150.1703311.33030.094182
160.1505851.17610.122061


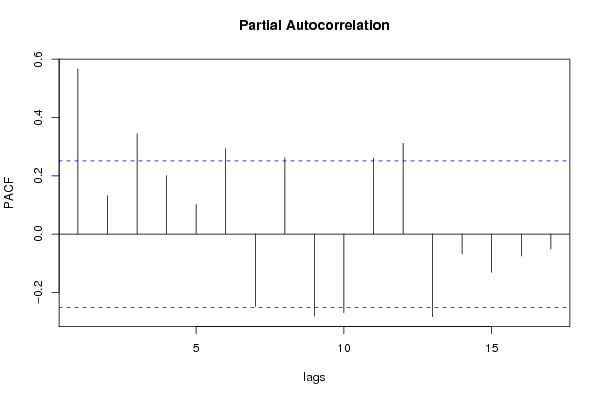
Partial Autocorrelation Function
Time lag kPACF(k)T-STATP-value
00.5664464.42412e-05
10.1319381.03050.153429
20.3443292.68930.004611
30.1998061.56050.061903
40.1013640.79170.215809
50.2932912.29070.012726
6-0.248276-1.93910.97144
70.2621242.04730.022474
8-0.281235-2.19650.984067
9-0.269301-2.10330.980215
100.260872.03750.022974
110.3114692.43270.008968
12-0.283189-2.21180.984631
13-0.068154-0.53230.701773
14-0.130898-1.02230.844673
15-0.07501-0.58580.719929
16-0.051057-0.39880.654272

\begin{tabular}{lllllllll}
\hline
Partial Autocorrelation Function \tabularnewline
Time lag k & PACF(k) & T-STAT & P-value \tabularnewline
0 & 0.566446 & 4.4241 & 2e-05 \tabularnewline
1 & 0.131938 & 1.0305 & 0.153429 \tabularnewline
2 & 0.344329 & 2.6893 & 0.004611 \tabularnewline
3 & 0.199806 & 1.5605 & 0.061903 \tabularnewline
4 & 0.101364 & 0.7917 & 0.215809 \tabularnewline
5 & 0.293291 & 2.2907 & 0.012726 \tabularnewline
6 & -0.248276 & -1.9391 & 0.97144 \tabularnewline
7 & 0.262124 & 2.0473 & 0.022474 \tabularnewline
8 & -0.281235 & -2.1965 & 0.984067 \tabularnewline
9 & -0.269301 & -2.1033 & 0.980215 \tabularnewline
10 & 0.26087 & 2.0375 & 0.022974 \tabularnewline
11 & 0.311469 & 2.4327 & 0.008968 \tabularnewline
12 & -0.283189 & -2.2118 & 0.984631 \tabularnewline
13 & -0.068154 & -0.5323 & 0.701773 \tabularnewline
14 & -0.130898 & -1.0223 & 0.844673 \tabularnewline
15 & -0.07501 & -0.5858 & 0.719929 \tabularnewline
16 & -0.051057 & -0.3988 & 0.654272 \tabularnewline
\hline
\end{tabular}
%Source: https://freestatistics.org/blog/index.php?pk=7201&T=2

[TABLE]
[ROW][C]Partial Autocorrelation Function[/C][/ROW]
[ROW][C]Time lag k[/C][C]PACF(k)[/C][C]T-STAT[/C][C]P-value[/C][/ROW]
[ROW][C]0[/C][C]0.566446[/C][C]4.4241[/C][C]2e-05[/C][/ROW]
[ROW][C]1[/C][C]0.131938[/C][C]1.0305[/C][C]0.153429[/C][/ROW]
[ROW][C]2[/C][C]0.344329[/C][C]2.6893[/C][C]0.004611[/C][/ROW]
[ROW][C]3[/C][C]0.199806[/C][C]1.5605[/C][C]0.061903[/C][/ROW]
[ROW][C]4[/C][C]0.101364[/C][C]0.7917[/C][C]0.215809[/C][/ROW]
[ROW][C]5[/C][C]0.293291[/C][C]2.2907[/C][C]0.012726[/C][/ROW]
[ROW][C]6[/C][C]-0.248276[/C][C]-1.9391[/C][C]0.97144[/C][/ROW]
[ROW][C]7[/C][C]0.262124[/C][C]2.0473[/C][C]0.022474[/C][/ROW]
[ROW][C]8[/C][C]-0.281235[/C][C]-2.1965[/C][C]0.984067[/C][/ROW]
[ROW][C]9[/C][C]-0.269301[/C][C]-2.1033[/C][C]0.980215[/C][/ROW]
[ROW][C]10[/C][C]0.26087[/C][C]2.0375[/C][C]0.022974[/C][/ROW]
[ROW][C]11[/C][C]0.311469[/C][C]2.4327[/C][C]0.008968[/C][/ROW]
[ROW][C]12[/C][C]-0.283189[/C][C]-2.2118[/C][C]0.984631[/C][/ROW]
[ROW][C]13[/C][C]-0.068154[/C][C]-0.5323[/C][C]0.701773[/C][/ROW]
[ROW][C]14[/C][C]-0.130898[/C][C]-1.0223[/C][C]0.844673[/C][/ROW]
[ROW][C]15[/C][C]-0.07501[/C][C]-0.5858[/C][C]0.719929[/C][/ROW]
[ROW][C]16[/C][C]-0.051057[/C][C]-0.3988[/C][C]0.654272[/C][/ROW]
[/TABLE]
Source: https://freestatistics.org/blog/index.php?pk=7201&T=2

Globally Unique Identifier (entire table): ba.freestatistics.org/blog/index.php?pk=7201&T=2

As an alternative you can also use a QR Code:  

The GUIDs for individual cells are displayed in the table below:

Partial Autocorrelation Function
Time lag kPACF(k)T-STATP-value
00.5664464.42412e-05
10.1319381.03050.153429
20.3443292.68930.004611
30.1998061.56050.061903
40.1013640.79170.215809
50.2932912.29070.012726
6-0.248276-1.93910.97144
70.2621242.04730.022474
8-0.281235-2.19650.984067
9-0.269301-2.10330.980215
100.260872.03750.022974
110.3114692.43270.008968
12-0.283189-2.21180.984631
13-0.068154-0.53230.701773
14-0.130898-1.02230.844673
15-0.07501-0.58580.719929
16-0.051057-0.39880.654272


Parameters (Session):
par1 = Default ; par2 = 1 ; par3 = 0 ; par4 = 0 ; par5 = 12 ;
Parameters (R input):
par1 = Default ; par2 = 1 ; par3 = 0 ; par4 = 0 ; par5 = 12 ;
R code (references can be found in the software module):
if (par1 == 'Default') {
par1 = 10*log10(length(x))
} else {
par1 <- as.numeric(par1)
}
par2 <- as.numeric(par2)
par3 <- as.numeric(par3)
par4 <- as.numeric(par4)
par5 <- as.numeric(par5)
if (par2 == 0) {
x <- log(x)
} else {
x <- (x ^ par2 - 1) / par2
}
if (par3 > 0) x <- diff(x,lag=1,difference=par3)
if (par4 > 0) x <- diff(x,lag=par5,difference=par4)
bitmap(file='pic1.png')
racf <- acf(x,par1,main='Autocorrelation',xlab='lags',ylab='ACF')
dev.off()
bitmap(file='pic2.png')
rpacf <- pacf(x,par1,main='Partial Autocorrelation',xlab='lags',ylab='PACF')
dev.off()
(myacf <- c(racf$acf))
(mypacf <- c(rpacf$acf))
lengthx <- length(x)
sqrtn <- sqrt(lengthx)
load(file='createtable')
a<-table.start()
a<-table.row.start(a)
a<-table.element(a,'Autocorrelation Function',4,TRUE)
a<-table.row.end(a)
a<-table.row.start(a)
a<-table.element(a,'Time lag k',header=TRUE)
a<-table.element(a,hyperlink('basics.htm','ACF(k)','click here for more information about the Autocorrelation Function'),header=TRUE)
a<-table.element(a,'T-STAT',header=TRUE)
a<-table.element(a,'P-value',header=TRUE)
a<-table.row.end(a)
for (i in 1:par1) {
a<-table.row.start(a)
a<-table.element(a,i-1,header=TRUE)
a<-table.element(a,round(myacf[i],6))
mytstat <- myacf[i]*sqrtn
a<-table.element(a,round(mytstat,4))
a<-table.element(a,round(1-pt(mytstat,lengthx),6))
a<-table.row.end(a)
}
a<-table.end(a)
table.save(a,file='mytable.tab')
a<-table.start()
a<-table.row.start(a)
a<-table.element(a,'Partial Autocorrelation Function',4,TRUE)
a<-table.row.end(a)
a<-table.row.start(a)
a<-table.element(a,'Time lag k',header=TRUE)
a<-table.element(a,hyperlink('basics.htm','PACF(k)','click here for more information about the Partial Autocorrelation Function'),header=TRUE)
a<-table.element(a,'T-STAT',header=TRUE)
a<-table.element(a,'P-value',header=TRUE)
a<-table.row.end(a)
for (i in 1:par1) {
a<-table.row.start(a)
a<-table.element(a,i-1,header=TRUE)
a<-table.element(a,round(mypacf[i],6))
mytstat <- mypacf[i]*sqrtn
a<-table.element(a,round(mytstat,4))
a<-table.element(a,round(1-pt(mytstat,lengthx),6))
a<-table.row.end(a)
}
a<-table.end(a)
table.save(a,file='mytable1.tab')