Free Statistics
of Irreproducible Research!
Description of Statistical Computation | |||||||||||||||||||||||||||||||||||||||||||||||||||
|---|---|---|---|---|---|---|---|---|---|---|---|---|---|---|---|---|---|---|---|---|---|---|---|---|---|---|---|---|---|---|---|---|---|---|---|---|---|---|---|---|---|---|---|---|---|---|---|---|---|---|---|
| Author's title | |||||||||||||||||||||||||||||||||||||||||||||||||||
| Author | *Unverified author* | ||||||||||||||||||||||||||||||||||||||||||||||||||
| R Software Module | rwasp_pairs.wasp | ||||||||||||||||||||||||||||||||||||||||||||||||||
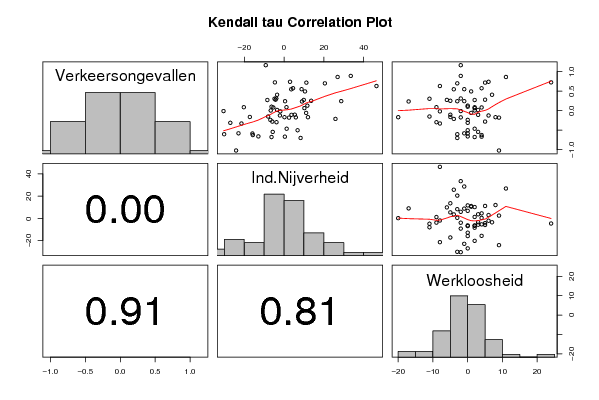
| Title produced by software | Kendall tau Correlation Matrix | ||||||||||||||||||||||||||||||||||||||||||||||||||
| Date of computation | Wed, 28 Nov 2007 11:23:11 -0700 | ||||||||||||||||||||||||||||||||||||||||||||||||||
| Cite this page as follows | Statistical Computations at FreeStatistics.org, Office for Research Development and Education, URL https://freestatistics.org/blog/index.php?v=date/2007/Nov/28/t11962736586z5162xvp6h39u1.htm/, Retrieved Thu, 02 May 2024 00:03:55 +0000 | ||||||||||||||||||||||||||||||||||||||||||||||||||
| Statistical Computations at FreeStatistics.org, Office for Research Development and Education, URL https://freestatistics.org/blog/index.php?pk=7194, Retrieved Thu, 02 May 2024 00:03:55 +0000 | |||||||||||||||||||||||||||||||||||||||||||||||||||
| QR Codes: | |||||||||||||||||||||||||||||||||||||||||||||||||||
|
| |||||||||||||||||||||||||||||||||||||||||||||||||||
| Original text written by user: | |||||||||||||||||||||||||||||||||||||||||||||||||||
| IsPrivate? | No (this computation is public) | ||||||||||||||||||||||||||||||||||||||||||||||||||
| User-defined keywords | Yannick Leroy, Nick Vandewalle, Jeroen Goetschalckx, Nick Van Hove, Jef Jacobs, Michiel Van den Broeck | ||||||||||||||||||||||||||||||||||||||||||||||||||
| Estimated Impact | 187 | ||||||||||||||||||||||||||||||||||||||||||||||||||
Tree of Dependent Computations | |||||||||||||||||||||||||||||||||||||||||||||||||||
| Family? (F = Feedback message, R = changed R code, M = changed R Module, P = changed Parameters, D = changed Data) | |||||||||||||||||||||||||||||||||||||||||||||||||||
| - [Kendall tau Correlation Matrix] [Workshop 4: Q4] [2007-11-28 18:23:11] [9ec4fcc2bfe8b6d942eac6074e595603] [Current] | |||||||||||||||||||||||||||||||||||||||||||||||||||
| Feedback Forum | |||||||||||||||||||||||||||||||||||||||||||||||||||
Post a new message | |||||||||||||||||||||||||||||||||||||||||||||||||||
Dataset | |||||||||||||||||||||||||||||||||||||||||||||||||||
| Dataseries X: | |||||||||||||||||||||||||||||||||||||||||||||||||||
0,409 -3,5 7 -0,625 -15,7 4 -0,211 25,8 -4 -0,676 -6,3 2 0,274 -8,4 2 0,893 33,5 -2 -0,544 -5,7 3 -0,161 -17,2 -5 -0,296 -3,8 -9 0,742 3 6 0,495 10,5 1 -0,178 2,5 9 0,313 -3,9 -2 -0,66 -12,9 0 -0,103 5,4 -5 -0,463 1,3 2 -0,149 -8 -11 0,865 26,9 11 0,243 0,5 -3 -1,022 -24,1 9 -0,236 -6,9 0 0,72 11,2 5 -0,171 5,9 -2 0,576 4,5 4 0,019 -3,5 3 0,005 -6,7 2 -0,106 3,7 3 -0,667 0,4 4 0,102 -6,3 0 0,702 20,5 -3 0,066 10,2 2 -0,604 -30,1 -3 -0,123 -2,1 6 0,552 8,8 -1 0,083 -5,4 4 0,254 13,6 -5 0,307 -4,8 -11 -0,581 -22,9 -1 0,277 9,9 -6 -0,7 8,3 -3 0,089 -20,2 2 0,245 28,7 -1 -0,017 -1,9 -8 -0,329 -21,4 -8 -0,167 0,2 -20 0,237 9 -17 0,727 -4,6 24 -0,167 12 8 0,282 -4,3 5 -0,585 -15,9 0 -0,057 11,1 1 -0,502 6,8 0 -0,01 -30,4 -2 0,633 46,4 -8 -0,28 -5,9 5 -0,311 -27 0 0,13 11,7 0 1,168 -9,2 -2 0,09 1,2 -9 0,55 3,6 -4 | |||||||||||||||||||||||||||||||||||||||||||||||||||
Tables (Output of Computation) | |||||||||||||||||||||||||||||||||||||||||||||||||||
| |||||||||||||||||||||||||||||||||||||||||||||||||||
Figures (Output of Computation) | |||||||||||||||||||||||||||||||||||||||||||||||||||
Input Parameters & R Code | |||||||||||||||||||||||||||||||||||||||||||||||||||
| Parameters (Session): | |||||||||||||||||||||||||||||||||||||||||||||||||||
| Parameters (R input): | |||||||||||||||||||||||||||||||||||||||||||||||||||
| R code (references can be found in the software module): | |||||||||||||||||||||||||||||||||||||||||||||||||||
panel.tau <- function(x, y, digits=2, prefix='', cex.cor) | |||||||||||||||||||||||||||||||||||||||||||||||||||