Free Statistics

of Irreproducible Research!

Author's title

Multiple regression Werkloosheid-toetreding nieuwe EUlanden(seizoenaliteit ...

Author*Unverified author*
R Software Modulerwasp_multipleregression.wasp
Title produced by softwareMultiple Regression
Date of computationWed, 28 Nov 2007 07:54:20 -0700
Cite this page as followsStatistical Computations at FreeStatistics.org, Office for Research Development and Education, URL https://freestatistics.org/blog/index.php?v=date/2007/Nov/28/t119626106700gef05lvbjpnz8.htm/, Retrieved Thu, 02 May 2024 09:53:47 +0000
Statistical Computations at FreeStatistics.org, Office for Research Development and Education, URL https://freestatistics.org/blog/index.php?pk=7071, Retrieved Thu, 02 May 2024 09:53:47 +0000
QR Codes:

Original text written by user:paper
IsPrivate?No (this computation is public)
User-defined keywords
Estimated Impact188
Family? (F = Feedback message, R = changed R code, M = changed R Module, P = changed Parameters, D = changed Data)
-       [Multiple Regression] [Multiple regressi...] [2007-11-28 14:54:20] [a04acf73ce4b7e85f8287f21ada159c8] [Current]
Feedback Forum

Post a new message
Dataseries X:
467037	0
460070	0
447988	0
442867	0
436087	0
431328	0
484015	0
509673	0
512927	0
502831	0
470984	0
471067	0
476049	0
474605	0
470439	0
461251	0
454724	0
455626	0
516847	0
525192	0
522975	0
518585	0
509239	0
512238	0
519164	0
517009	0
509933	0
509127	0
500857	0
506971	0
569323	0
579714	0
577992	0
565464	0
547344	0
554788	0
562325	0
560854	0
555332	0
543599	0
536662	1
542722	1
593530	1
610763	1
612613	1
611324	1
594167	1
595454	1
590865	1
589379	1
584428	1
573100	1
567456	1
569028	1
620735	1
628884	1
628232	1
612117	1
595404	1
597141	1
593408	1
590072	1
579799	1
574205	1
572775	1
572942	1
619567	1
625809	1
619916	1
587625	1
565742	1
557274	1


Summary of compuational transaction
Raw Inputview raw input (R code)
Raw Outputview raw output of R engine
Computing time4 seconds
R Server'Gwilym Jenkins' @ 72.249.127.135

\begin{tabular}{lllllllll}
\hline
Summary of compuational transaction \tabularnewline
Raw Input & view raw input (R code)  \tabularnewline
Raw Output & view raw output of R engine  \tabularnewline
Computing time & 4 seconds \tabularnewline
R Server & 'Gwilym Jenkins' @ 72.249.127.135 \tabularnewline
\hline
\end{tabular}
%Source: https://freestatistics.org/blog/index.php?pk=7071&T=0

[TABLE]
[ROW][C]Summary of compuational transaction[/C][/ROW]
[ROW][C]Raw Input[/C][C]view raw input (R code) [/C][/ROW]
[ROW][C]Raw Output[/C][C]view raw output of R engine [/C][/ROW]
[ROW][C]Computing time[/C][C]4 seconds[/C][/ROW]
[ROW][C]R Server[/C][C]'Gwilym Jenkins' @ 72.249.127.135[/C][/ROW]
[/TABLE]
Source: https://freestatistics.org/blog/index.php?pk=7071&T=0

Globally Unique Identifier (entire table): ba.freestatistics.org/blog/index.php?pk=7071&T=0

As an alternative you can also use a QR Code:  

The GUIDs for individual cells are displayed in the table below:

Summary of compuational transaction
Raw Inputview raw input (R code)
Raw Outputview raw output of R engine
Computing time4 seconds
R Server'Gwilym Jenkins' @ 72.249.127.135


Multiple Linear Regression - Estimated Regression Equation
Werkloosheid[t] = + 457765.301103989 + 11876.1848290599Eulanden[t] + 10869.7213912630M1[t] + 6052.97679249759M2[t] -3298.93447293448M3[t] -12600.8457383666M4[t] -22518.4544753087M5[t] -22849.3657407407M6[t] + 29377.0563271605M7[t] + 40039.811728395M8[t] + 37136.2337962963M9[t] + 22344.4891975309M10[t] + 1159.91126543210M11[t] + 2006.9112654321t + e[t]

\begin{tabular}{lllllllll}
\hline
Multiple Linear Regression - Estimated Regression Equation \tabularnewline
Werkloosheid[t] =  +  457765.301103989 +  11876.1848290599Eulanden[t] +  10869.7213912630M1[t] +  6052.97679249759M2[t] -3298.93447293448M3[t] -12600.8457383666M4[t] -22518.4544753087M5[t] -22849.3657407407M6[t] +  29377.0563271605M7[t] +  40039.811728395M8[t] +  37136.2337962963M9[t] +  22344.4891975309M10[t] +  1159.91126543210M11[t] +  2006.9112654321t  + e[t] \tabularnewline
\hline
\end{tabular}
%Source: https://freestatistics.org/blog/index.php?pk=7071&T=1

[TABLE]
[ROW][C]Multiple Linear Regression - Estimated Regression Equation[/C][/ROW]
[ROW][C]Werkloosheid[t] =  +  457765.301103989 +  11876.1848290599Eulanden[t] +  10869.7213912630M1[t] +  6052.97679249759M2[t] -3298.93447293448M3[t] -12600.8457383666M4[t] -22518.4544753087M5[t] -22849.3657407407M6[t] +  29377.0563271605M7[t] +  40039.811728395M8[t] +  37136.2337962963M9[t] +  22344.4891975309M10[t] +  1159.91126543210M11[t] +  2006.9112654321t  + e[t][/C][/ROW]
[/TABLE]
Source: https://freestatistics.org/blog/index.php?pk=7071&T=1

Globally Unique Identifier (entire table): ba.freestatistics.org/blog/index.php?pk=7071&T=1

As an alternative you can also use a QR Code:  

The GUIDs for individual cells are displayed in the table below:

Multiple Linear Regression - Estimated Regression Equation
Werkloosheid[t] = + 457765.301103989 + 11876.1848290599Eulanden[t] + 10869.7213912630M1[t] + 6052.97679249759M2[t] -3298.93447293448M3[t] -12600.8457383666M4[t] -22518.4544753087M5[t] -22849.3657407407M6[t] + 29377.0563271605M7[t] + 40039.811728395M8[t] + 37136.2337962963M9[t] + 22344.4891975309M10[t] + 1159.91126543210M11[t] + 2006.9112654321t + e[t]


Multiple Linear Regression - Ordinary Least Squares
VariableParameterS.D.T-STATH0: parameter = 02-tail p-value1-tail p-value
(Intercept)457765.3011039899668.57739347.345700
Eulanden11876.18482905999066.1887261.30990.195380.09769
M110869.721391263011130.3370970.97660.332830.166415
M26052.9767924975911111.2725660.54480.5880070.294004
M3-3298.9344729344811096.421953-0.29730.7673020.383651
M4-12600.845738366611085.802193-1.13670.2603530.130176
M5-22518.454475308711154.731138-2.01870.0481460.024073
M6-22849.365740740711127.243369-2.05350.0445460.022273
M729377.056327160511103.9313392.64560.0104760.005238
M840039.81172839511084.8213943.61210.0006350.000318
M937136.233796296311069.9352973.35470.0014050.000703
M1022344.489197530911059.2901022.02040.0479650.023983
M111159.9112654321011052.8980640.10490.9167840.458392
t2006.9112654321217.0575559.24600

\begin{tabular}{lllllllll}
\hline
Multiple Linear Regression - Ordinary Least Squares \tabularnewline
Variable & Parameter & S.D. & T-STATH0: parameter = 0 & 2-tail p-value & 1-tail p-value \tabularnewline
(Intercept) & 457765.301103989 & 9668.577393 & 47.3457 & 0 & 0 \tabularnewline
Eulanden & 11876.1848290599 & 9066.188726 & 1.3099 & 0.19538 & 0.09769 \tabularnewline
M1 & 10869.7213912630 & 11130.337097 & 0.9766 & 0.33283 & 0.166415 \tabularnewline
M2 & 6052.97679249759 & 11111.272566 & 0.5448 & 0.588007 & 0.294004 \tabularnewline
M3 & -3298.93447293448 & 11096.421953 & -0.2973 & 0.767302 & 0.383651 \tabularnewline
M4 & -12600.8457383666 & 11085.802193 & -1.1367 & 0.260353 & 0.130176 \tabularnewline
M5 & -22518.4544753087 & 11154.731138 & -2.0187 & 0.048146 & 0.024073 \tabularnewline
M6 & -22849.3657407407 & 11127.243369 & -2.0535 & 0.044546 & 0.022273 \tabularnewline
M7 & 29377.0563271605 & 11103.931339 & 2.6456 & 0.010476 & 0.005238 \tabularnewline
M8 & 40039.811728395 & 11084.821394 & 3.6121 & 0.000635 & 0.000318 \tabularnewline
M9 & 37136.2337962963 & 11069.935297 & 3.3547 & 0.001405 & 0.000703 \tabularnewline
M10 & 22344.4891975309 & 11059.290102 & 2.0204 & 0.047965 & 0.023983 \tabularnewline
M11 & 1159.91126543210 & 11052.898064 & 0.1049 & 0.916784 & 0.458392 \tabularnewline
t & 2006.9112654321 & 217.057555 & 9.246 & 0 & 0 \tabularnewline
\hline
\end{tabular}
%Source: https://freestatistics.org/blog/index.php?pk=7071&T=2

[TABLE]
[ROW][C]Multiple Linear Regression - Ordinary Least Squares[/C][/ROW]
[ROW][C]Variable[/C][C]Parameter[/C][C]S.D.[/C][C]T-STATH0: parameter = 0[/C][C]2-tail p-value[/C][C]1-tail p-value[/C][/ROW]
[ROW][C](Intercept)[/C][C]457765.301103989[/C][C]9668.577393[/C][C]47.3457[/C][C]0[/C][C]0[/C][/ROW]
[ROW][C]Eulanden[/C][C]11876.1848290599[/C][C]9066.188726[/C][C]1.3099[/C][C]0.19538[/C][C]0.09769[/C][/ROW]
[ROW][C]M1[/C][C]10869.7213912630[/C][C]11130.337097[/C][C]0.9766[/C][C]0.33283[/C][C]0.166415[/C][/ROW]
[ROW][C]M2[/C][C]6052.97679249759[/C][C]11111.272566[/C][C]0.5448[/C][C]0.588007[/C][C]0.294004[/C][/ROW]
[ROW][C]M3[/C][C]-3298.93447293448[/C][C]11096.421953[/C][C]-0.2973[/C][C]0.767302[/C][C]0.383651[/C][/ROW]
[ROW][C]M4[/C][C]-12600.8457383666[/C][C]11085.802193[/C][C]-1.1367[/C][C]0.260353[/C][C]0.130176[/C][/ROW]
[ROW][C]M5[/C][C]-22518.4544753087[/C][C]11154.731138[/C][C]-2.0187[/C][C]0.048146[/C][C]0.024073[/C][/ROW]
[ROW][C]M6[/C][C]-22849.3657407407[/C][C]11127.243369[/C][C]-2.0535[/C][C]0.044546[/C][C]0.022273[/C][/ROW]
[ROW][C]M7[/C][C]29377.0563271605[/C][C]11103.931339[/C][C]2.6456[/C][C]0.010476[/C][C]0.005238[/C][/ROW]
[ROW][C]M8[/C][C]40039.811728395[/C][C]11084.821394[/C][C]3.6121[/C][C]0.000635[/C][C]0.000318[/C][/ROW]
[ROW][C]M9[/C][C]37136.2337962963[/C][C]11069.935297[/C][C]3.3547[/C][C]0.001405[/C][C]0.000703[/C][/ROW]
[ROW][C]M10[/C][C]22344.4891975309[/C][C]11059.290102[/C][C]2.0204[/C][C]0.047965[/C][C]0.023983[/C][/ROW]
[ROW][C]M11[/C][C]1159.91126543210[/C][C]11052.898064[/C][C]0.1049[/C][C]0.916784[/C][C]0.458392[/C][/ROW]
[ROW][C]t[/C][C]2006.9112654321[/C][C]217.057555[/C][C]9.246[/C][C]0[/C][C]0[/C][/ROW]
[/TABLE]
Source: https://freestatistics.org/blog/index.php?pk=7071&T=2

Globally Unique Identifier (entire table): ba.freestatistics.org/blog/index.php?pk=7071&T=2

As an alternative you can also use a QR Code:  

The GUIDs for individual cells are displayed in the table below:

Multiple Linear Regression - Ordinary Least Squares
VariableParameterS.D.T-STATH0: parameter = 02-tail p-value1-tail p-value
(Intercept)457765.3011039899668.57739347.345700
Eulanden11876.18482905999066.1887261.30990.195380.09769
M110869.721391263011130.3370970.97660.332830.166415
M26052.9767924975911111.2725660.54480.5880070.294004
M3-3298.9344729344811096.421953-0.29730.7673020.383651
M4-12600.845738366611085.802193-1.13670.2603530.130176
M5-22518.454475308711154.731138-2.01870.0481460.024073
M6-22849.365740740711127.243369-2.05350.0445460.022273
M729377.056327160511103.9313392.64560.0104760.005238
M840039.81172839511084.8213943.61210.0006350.000318
M937136.233796296311069.9352973.35470.0014050.000703
M1022344.489197530911059.2901022.02040.0479650.023983
M111159.9112654321011052.8980640.10490.9167840.458392
t2006.9112654321217.0575559.24600


Multiple Linear Regression - Regression Statistics
Multiple R0.949724010267909
R-squared0.901975695679359
Adjusted R-squared0.880004730917835
F-TEST (value)41.0530764338102
F-TEST (DF numerator)13
F-TEST (DF denominator)58
p-value0
Multiple Linear Regression - Residual Statistics
Residual Standard Deviation19140.4891497739
Sum Squared Residuals21248782843.7715

\begin{tabular}{lllllllll}
\hline
Multiple Linear Regression - Regression Statistics \tabularnewline
Multiple R & 0.949724010267909 \tabularnewline
R-squared & 0.901975695679359 \tabularnewline
Adjusted R-squared & 0.880004730917835 \tabularnewline
F-TEST (value) & 41.0530764338102 \tabularnewline
F-TEST (DF numerator) & 13 \tabularnewline
F-TEST (DF denominator) & 58 \tabularnewline
p-value & 0 \tabularnewline
Multiple Linear Regression - Residual Statistics \tabularnewline
Residual Standard Deviation & 19140.4891497739 \tabularnewline
Sum Squared Residuals & 21248782843.7715 \tabularnewline
\hline
\end{tabular}
%Source: https://freestatistics.org/blog/index.php?pk=7071&T=3

[TABLE]
[ROW][C]Multiple Linear Regression - Regression Statistics[/C][/ROW]
[ROW][C]Multiple R[/C][C]0.949724010267909[/C][/ROW]
[ROW][C]R-squared[/C][C]0.901975695679359[/C][/ROW]
[ROW][C]Adjusted R-squared[/C][C]0.880004730917835[/C][/ROW]
[ROW][C]F-TEST (value)[/C][C]41.0530764338102[/C][/ROW]
[ROW][C]F-TEST (DF numerator)[/C][C]13[/C][/ROW]
[ROW][C]F-TEST (DF denominator)[/C][C]58[/C][/ROW]
[ROW][C]p-value[/C][C]0[/C][/ROW]
[ROW][C]Multiple Linear Regression - Residual Statistics[/C][/ROW]
[ROW][C]Residual Standard Deviation[/C][C]19140.4891497739[/C][/ROW]
[ROW][C]Sum Squared Residuals[/C][C]21248782843.7715[/C][/ROW]
[/TABLE]
Source: https://freestatistics.org/blog/index.php?pk=7071&T=3

Globally Unique Identifier (entire table): ba.freestatistics.org/blog/index.php?pk=7071&T=3

As an alternative you can also use a QR Code:  

The GUIDs for individual cells are displayed in the table below:

Multiple Linear Regression - Regression Statistics
Multiple R0.949724010267909
R-squared0.901975695679359
Adjusted R-squared0.880004730917835
F-TEST (value)41.0530764338102
F-TEST (DF numerator)13
F-TEST (DF denominator)58
p-value0
Multiple Linear Regression - Residual Statistics
Residual Standard Deviation19140.4891497739
Sum Squared Residuals21248782843.7715


Multiple Linear Regression - Actuals, Interpolation, and Residuals
Time or IndexActualsInterpolationForecastResidualsPrediction Error
1467037470641.933760684-3604.93376068378
2460070467832.100427350-7762.10042735052
3447988460487.100427350-12499.1004273505
4442867453192.100427350-10325.1004273504
5436087445281.402955840-9194.40295584049
6431328446957.402955840-15629.4029558404
7484015501190.736289174-17175.7362891738
8509673513860.40295584-4187.40295584049
9512927512963.736289174-36.7362891737525
10502831500178.902955842652.09704415958
11470984481001.236289174-10017.2362891738
12471067481848.236289174-10781.2362891738
13476049494724.868945869-18675.8689458689
14474605491915.035612536-17310.0356125355
15470439484570.035612536-14131.0356125356
16461251477275.035612536-16024.0356125356
17454724469364.338141026-14640.3381410256
18455626471040.338141026-15414.3381410256
19516847525273.671474359-8426.67147435898
20525192537943.338141026-12751.3381410256
21522975537046.671474359-14071.6714743590
22518585524261.838141026-5676.83814102564
23509239505084.1714743594154.82852564102
24512238505931.1714743596306.82852564102
25519164518807.804131054356.195868945878
26517009515997.9707977211011.0292022792
27509933508652.9707977211280.02920227921
28509127501357.9707977217769.0292022792
29500857493447.2733262117409.72667378918
30506971495123.27332621111847.7266737892
31569323549356.60665954419966.3933404558
32579714562026.27332621117687.7266737892
33577992561129.60665954416862.3933404558
34565464548344.77332621117119.2266737892
35547344529167.10665954418176.8933404558
36554788530014.10665954424773.8933404558
37562325542890.73931623919434.2606837607
38560854540080.90598290620773.094017094
39555332532735.90598290622596.0940170940
40543599525440.90598290618158.094017094
41536662529406.3933404567255.60665954417
42542722531082.39334045611639.6066595442
43593530585315.7266737898214.27332621082
44610763597985.39334045612777.6066595442
45612613597088.72667378915524.2733262108
46611324584303.89334045627020.1066595442
47594167565126.22667378929040.7733262108
48595454565973.22667378929480.7733262108
49590865578849.85933048412015.1406695157
50589379576040.02599715113338.974002849
51584428568695.02599715115732.974002849
52573100561400.02599715111699.974002849
53567456553489.32852564113966.671474359
54569028555165.32852564113862.6714743590
55620735609398.66185897411336.3381410256
56628884622068.3285256416815.67147435899
57628232621171.6618589747060.33814102564
58612117608386.8285256413730.17147435897
59595404589209.1618589746194.83814102564
60597141590056.1618589747084.83814102564
61593408602932.794515669-9524.7945156695
62590072600122.961182336-10050.9611823362
63579799592777.961182336-12978.9611823362
64574205585482.961182336-11277.9611823362
65572775577572.263710826-4797.2637108262
66572942579248.263710826-6306.26371082622
67619567633481.59704416-13914.5970441596
68625809646151.263710826-20342.2637108262
69619916645254.59704416-25338.5970441595
70587625632469.763710826-44844.7637108262
71565742613292.09704416-47550.0970441595
72557274614139.097044160-56865.0970441595

\begin{tabular}{lllllllll}
\hline
Multiple Linear Regression - Actuals, Interpolation, and Residuals \tabularnewline
Time or Index & Actuals & InterpolationForecast & ResidualsPrediction Error \tabularnewline
1 & 467037 & 470641.933760684 & -3604.93376068378 \tabularnewline
2 & 460070 & 467832.100427350 & -7762.10042735052 \tabularnewline
3 & 447988 & 460487.100427350 & -12499.1004273505 \tabularnewline
4 & 442867 & 453192.100427350 & -10325.1004273504 \tabularnewline
5 & 436087 & 445281.402955840 & -9194.40295584049 \tabularnewline
6 & 431328 & 446957.402955840 & -15629.4029558404 \tabularnewline
7 & 484015 & 501190.736289174 & -17175.7362891738 \tabularnewline
8 & 509673 & 513860.40295584 & -4187.40295584049 \tabularnewline
9 & 512927 & 512963.736289174 & -36.7362891737525 \tabularnewline
10 & 502831 & 500178.90295584 & 2652.09704415958 \tabularnewline
11 & 470984 & 481001.236289174 & -10017.2362891738 \tabularnewline
12 & 471067 & 481848.236289174 & -10781.2362891738 \tabularnewline
13 & 476049 & 494724.868945869 & -18675.8689458689 \tabularnewline
14 & 474605 & 491915.035612536 & -17310.0356125355 \tabularnewline
15 & 470439 & 484570.035612536 & -14131.0356125356 \tabularnewline
16 & 461251 & 477275.035612536 & -16024.0356125356 \tabularnewline
17 & 454724 & 469364.338141026 & -14640.3381410256 \tabularnewline
18 & 455626 & 471040.338141026 & -15414.3381410256 \tabularnewline
19 & 516847 & 525273.671474359 & -8426.67147435898 \tabularnewline
20 & 525192 & 537943.338141026 & -12751.3381410256 \tabularnewline
21 & 522975 & 537046.671474359 & -14071.6714743590 \tabularnewline
22 & 518585 & 524261.838141026 & -5676.83814102564 \tabularnewline
23 & 509239 & 505084.171474359 & 4154.82852564102 \tabularnewline
24 & 512238 & 505931.171474359 & 6306.82852564102 \tabularnewline
25 & 519164 & 518807.804131054 & 356.195868945878 \tabularnewline
26 & 517009 & 515997.970797721 & 1011.0292022792 \tabularnewline
27 & 509933 & 508652.970797721 & 1280.02920227921 \tabularnewline
28 & 509127 & 501357.970797721 & 7769.0292022792 \tabularnewline
29 & 500857 & 493447.273326211 & 7409.72667378918 \tabularnewline
30 & 506971 & 495123.273326211 & 11847.7266737892 \tabularnewline
31 & 569323 & 549356.606659544 & 19966.3933404558 \tabularnewline
32 & 579714 & 562026.273326211 & 17687.7266737892 \tabularnewline
33 & 577992 & 561129.606659544 & 16862.3933404558 \tabularnewline
34 & 565464 & 548344.773326211 & 17119.2266737892 \tabularnewline
35 & 547344 & 529167.106659544 & 18176.8933404558 \tabularnewline
36 & 554788 & 530014.106659544 & 24773.8933404558 \tabularnewline
37 & 562325 & 542890.739316239 & 19434.2606837607 \tabularnewline
38 & 560854 & 540080.905982906 & 20773.094017094 \tabularnewline
39 & 555332 & 532735.905982906 & 22596.0940170940 \tabularnewline
40 & 543599 & 525440.905982906 & 18158.094017094 \tabularnewline
41 & 536662 & 529406.393340456 & 7255.60665954417 \tabularnewline
42 & 542722 & 531082.393340456 & 11639.6066595442 \tabularnewline
43 & 593530 & 585315.726673789 & 8214.27332621082 \tabularnewline
44 & 610763 & 597985.393340456 & 12777.6066595442 \tabularnewline
45 & 612613 & 597088.726673789 & 15524.2733262108 \tabularnewline
46 & 611324 & 584303.893340456 & 27020.1066595442 \tabularnewline
47 & 594167 & 565126.226673789 & 29040.7733262108 \tabularnewline
48 & 595454 & 565973.226673789 & 29480.7733262108 \tabularnewline
49 & 590865 & 578849.859330484 & 12015.1406695157 \tabularnewline
50 & 589379 & 576040.025997151 & 13338.974002849 \tabularnewline
51 & 584428 & 568695.025997151 & 15732.974002849 \tabularnewline
52 & 573100 & 561400.025997151 & 11699.974002849 \tabularnewline
53 & 567456 & 553489.328525641 & 13966.671474359 \tabularnewline
54 & 569028 & 555165.328525641 & 13862.6714743590 \tabularnewline
55 & 620735 & 609398.661858974 & 11336.3381410256 \tabularnewline
56 & 628884 & 622068.328525641 & 6815.67147435899 \tabularnewline
57 & 628232 & 621171.661858974 & 7060.33814102564 \tabularnewline
58 & 612117 & 608386.828525641 & 3730.17147435897 \tabularnewline
59 & 595404 & 589209.161858974 & 6194.83814102564 \tabularnewline
60 & 597141 & 590056.161858974 & 7084.83814102564 \tabularnewline
61 & 593408 & 602932.794515669 & -9524.7945156695 \tabularnewline
62 & 590072 & 600122.961182336 & -10050.9611823362 \tabularnewline
63 & 579799 & 592777.961182336 & -12978.9611823362 \tabularnewline
64 & 574205 & 585482.961182336 & -11277.9611823362 \tabularnewline
65 & 572775 & 577572.263710826 & -4797.2637108262 \tabularnewline
66 & 572942 & 579248.263710826 & -6306.26371082622 \tabularnewline
67 & 619567 & 633481.59704416 & -13914.5970441596 \tabularnewline
68 & 625809 & 646151.263710826 & -20342.2637108262 \tabularnewline
69 & 619916 & 645254.59704416 & -25338.5970441595 \tabularnewline
70 & 587625 & 632469.763710826 & -44844.7637108262 \tabularnewline
71 & 565742 & 613292.09704416 & -47550.0970441595 \tabularnewline
72 & 557274 & 614139.097044160 & -56865.0970441595 \tabularnewline
\hline
\end{tabular}
%Source: https://freestatistics.org/blog/index.php?pk=7071&T=4

[TABLE]
[ROW][C]Multiple Linear Regression - Actuals, Interpolation, and Residuals[/C][/ROW]
[ROW][C]Time or Index[/C][C]Actuals[/C][C]InterpolationForecast[/C][C]ResidualsPrediction Error[/C][/ROW]
[ROW][C]1[/C][C]467037[/C][C]470641.933760684[/C][C]-3604.93376068378[/C][/ROW]
[ROW][C]2[/C][C]460070[/C][C]467832.100427350[/C][C]-7762.10042735052[/C][/ROW]
[ROW][C]3[/C][C]447988[/C][C]460487.100427350[/C][C]-12499.1004273505[/C][/ROW]
[ROW][C]4[/C][C]442867[/C][C]453192.100427350[/C][C]-10325.1004273504[/C][/ROW]
[ROW][C]5[/C][C]436087[/C][C]445281.402955840[/C][C]-9194.40295584049[/C][/ROW]
[ROW][C]6[/C][C]431328[/C][C]446957.402955840[/C][C]-15629.4029558404[/C][/ROW]
[ROW][C]7[/C][C]484015[/C][C]501190.736289174[/C][C]-17175.7362891738[/C][/ROW]
[ROW][C]8[/C][C]509673[/C][C]513860.40295584[/C][C]-4187.40295584049[/C][/ROW]
[ROW][C]9[/C][C]512927[/C][C]512963.736289174[/C][C]-36.7362891737525[/C][/ROW]
[ROW][C]10[/C][C]502831[/C][C]500178.90295584[/C][C]2652.09704415958[/C][/ROW]
[ROW][C]11[/C][C]470984[/C][C]481001.236289174[/C][C]-10017.2362891738[/C][/ROW]
[ROW][C]12[/C][C]471067[/C][C]481848.236289174[/C][C]-10781.2362891738[/C][/ROW]
[ROW][C]13[/C][C]476049[/C][C]494724.868945869[/C][C]-18675.8689458689[/C][/ROW]
[ROW][C]14[/C][C]474605[/C][C]491915.035612536[/C][C]-17310.0356125355[/C][/ROW]
[ROW][C]15[/C][C]470439[/C][C]484570.035612536[/C][C]-14131.0356125356[/C][/ROW]
[ROW][C]16[/C][C]461251[/C][C]477275.035612536[/C][C]-16024.0356125356[/C][/ROW]
[ROW][C]17[/C][C]454724[/C][C]469364.338141026[/C][C]-14640.3381410256[/C][/ROW]
[ROW][C]18[/C][C]455626[/C][C]471040.338141026[/C][C]-15414.3381410256[/C][/ROW]
[ROW][C]19[/C][C]516847[/C][C]525273.671474359[/C][C]-8426.67147435898[/C][/ROW]
[ROW][C]20[/C][C]525192[/C][C]537943.338141026[/C][C]-12751.3381410256[/C][/ROW]
[ROW][C]21[/C][C]522975[/C][C]537046.671474359[/C][C]-14071.6714743590[/C][/ROW]
[ROW][C]22[/C][C]518585[/C][C]524261.838141026[/C][C]-5676.83814102564[/C][/ROW]
[ROW][C]23[/C][C]509239[/C][C]505084.171474359[/C][C]4154.82852564102[/C][/ROW]
[ROW][C]24[/C][C]512238[/C][C]505931.171474359[/C][C]6306.82852564102[/C][/ROW]
[ROW][C]25[/C][C]519164[/C][C]518807.804131054[/C][C]356.195868945878[/C][/ROW]
[ROW][C]26[/C][C]517009[/C][C]515997.970797721[/C][C]1011.0292022792[/C][/ROW]
[ROW][C]27[/C][C]509933[/C][C]508652.970797721[/C][C]1280.02920227921[/C][/ROW]
[ROW][C]28[/C][C]509127[/C][C]501357.970797721[/C][C]7769.0292022792[/C][/ROW]
[ROW][C]29[/C][C]500857[/C][C]493447.273326211[/C][C]7409.72667378918[/C][/ROW]
[ROW][C]30[/C][C]506971[/C][C]495123.273326211[/C][C]11847.7266737892[/C][/ROW]
[ROW][C]31[/C][C]569323[/C][C]549356.606659544[/C][C]19966.3933404558[/C][/ROW]
[ROW][C]32[/C][C]579714[/C][C]562026.273326211[/C][C]17687.7266737892[/C][/ROW]
[ROW][C]33[/C][C]577992[/C][C]561129.606659544[/C][C]16862.3933404558[/C][/ROW]
[ROW][C]34[/C][C]565464[/C][C]548344.773326211[/C][C]17119.2266737892[/C][/ROW]
[ROW][C]35[/C][C]547344[/C][C]529167.106659544[/C][C]18176.8933404558[/C][/ROW]
[ROW][C]36[/C][C]554788[/C][C]530014.106659544[/C][C]24773.8933404558[/C][/ROW]
[ROW][C]37[/C][C]562325[/C][C]542890.739316239[/C][C]19434.2606837607[/C][/ROW]
[ROW][C]38[/C][C]560854[/C][C]540080.905982906[/C][C]20773.094017094[/C][/ROW]
[ROW][C]39[/C][C]555332[/C][C]532735.905982906[/C][C]22596.0940170940[/C][/ROW]
[ROW][C]40[/C][C]543599[/C][C]525440.905982906[/C][C]18158.094017094[/C][/ROW]
[ROW][C]41[/C][C]536662[/C][C]529406.393340456[/C][C]7255.60665954417[/C][/ROW]
[ROW][C]42[/C][C]542722[/C][C]531082.393340456[/C][C]11639.6066595442[/C][/ROW]
[ROW][C]43[/C][C]593530[/C][C]585315.726673789[/C][C]8214.27332621082[/C][/ROW]
[ROW][C]44[/C][C]610763[/C][C]597985.393340456[/C][C]12777.6066595442[/C][/ROW]
[ROW][C]45[/C][C]612613[/C][C]597088.726673789[/C][C]15524.2733262108[/C][/ROW]
[ROW][C]46[/C][C]611324[/C][C]584303.893340456[/C][C]27020.1066595442[/C][/ROW]
[ROW][C]47[/C][C]594167[/C][C]565126.226673789[/C][C]29040.7733262108[/C][/ROW]
[ROW][C]48[/C][C]595454[/C][C]565973.226673789[/C][C]29480.7733262108[/C][/ROW]
[ROW][C]49[/C][C]590865[/C][C]578849.859330484[/C][C]12015.1406695157[/C][/ROW]
[ROW][C]50[/C][C]589379[/C][C]576040.025997151[/C][C]13338.974002849[/C][/ROW]
[ROW][C]51[/C][C]584428[/C][C]568695.025997151[/C][C]15732.974002849[/C][/ROW]
[ROW][C]52[/C][C]573100[/C][C]561400.025997151[/C][C]11699.974002849[/C][/ROW]
[ROW][C]53[/C][C]567456[/C][C]553489.328525641[/C][C]13966.671474359[/C][/ROW]
[ROW][C]54[/C][C]569028[/C][C]555165.328525641[/C][C]13862.6714743590[/C][/ROW]
[ROW][C]55[/C][C]620735[/C][C]609398.661858974[/C][C]11336.3381410256[/C][/ROW]
[ROW][C]56[/C][C]628884[/C][C]622068.328525641[/C][C]6815.67147435899[/C][/ROW]
[ROW][C]57[/C][C]628232[/C][C]621171.661858974[/C][C]7060.33814102564[/C][/ROW]
[ROW][C]58[/C][C]612117[/C][C]608386.828525641[/C][C]3730.17147435897[/C][/ROW]
[ROW][C]59[/C][C]595404[/C][C]589209.161858974[/C][C]6194.83814102564[/C][/ROW]
[ROW][C]60[/C][C]597141[/C][C]590056.161858974[/C][C]7084.83814102564[/C][/ROW]
[ROW][C]61[/C][C]593408[/C][C]602932.794515669[/C][C]-9524.7945156695[/C][/ROW]
[ROW][C]62[/C][C]590072[/C][C]600122.961182336[/C][C]-10050.9611823362[/C][/ROW]
[ROW][C]63[/C][C]579799[/C][C]592777.961182336[/C][C]-12978.9611823362[/C][/ROW]
[ROW][C]64[/C][C]574205[/C][C]585482.961182336[/C][C]-11277.9611823362[/C][/ROW]
[ROW][C]65[/C][C]572775[/C][C]577572.263710826[/C][C]-4797.2637108262[/C][/ROW]
[ROW][C]66[/C][C]572942[/C][C]579248.263710826[/C][C]-6306.26371082622[/C][/ROW]
[ROW][C]67[/C][C]619567[/C][C]633481.59704416[/C][C]-13914.5970441596[/C][/ROW]
[ROW][C]68[/C][C]625809[/C][C]646151.263710826[/C][C]-20342.2637108262[/C][/ROW]
[ROW][C]69[/C][C]619916[/C][C]645254.59704416[/C][C]-25338.5970441595[/C][/ROW]
[ROW][C]70[/C][C]587625[/C][C]632469.763710826[/C][C]-44844.7637108262[/C][/ROW]
[ROW][C]71[/C][C]565742[/C][C]613292.09704416[/C][C]-47550.0970441595[/C][/ROW]
[ROW][C]72[/C][C]557274[/C][C]614139.097044160[/C][C]-56865.0970441595[/C][/ROW]
[/TABLE]
Source: https://freestatistics.org/blog/index.php?pk=7071&T=4

Globally Unique Identifier (entire table): ba.freestatistics.org/blog/index.php?pk=7071&T=4

As an alternative you can also use a QR Code:  

The GUIDs for individual cells are displayed in the table below:

Multiple Linear Regression - Actuals, Interpolation, and Residuals
Time or IndexActualsInterpolationForecastResidualsPrediction Error
1467037470641.933760684-3604.93376068378
2460070467832.100427350-7762.10042735052
3447988460487.100427350-12499.1004273505
4442867453192.100427350-10325.1004273504
5436087445281.402955840-9194.40295584049
6431328446957.402955840-15629.4029558404
7484015501190.736289174-17175.7362891738
8509673513860.40295584-4187.40295584049
9512927512963.736289174-36.7362891737525
10502831500178.902955842652.09704415958
11470984481001.236289174-10017.2362891738
12471067481848.236289174-10781.2362891738
13476049494724.868945869-18675.8689458689
14474605491915.035612536-17310.0356125355
15470439484570.035612536-14131.0356125356
16461251477275.035612536-16024.0356125356
17454724469364.338141026-14640.3381410256
18455626471040.338141026-15414.3381410256
19516847525273.671474359-8426.67147435898
20525192537943.338141026-12751.3381410256
21522975537046.671474359-14071.6714743590
22518585524261.838141026-5676.83814102564
23509239505084.1714743594154.82852564102
24512238505931.1714743596306.82852564102
25519164518807.804131054356.195868945878
26517009515997.9707977211011.0292022792
27509933508652.9707977211280.02920227921
28509127501357.9707977217769.0292022792
29500857493447.2733262117409.72667378918
30506971495123.27332621111847.7266737892
31569323549356.60665954419966.3933404558
32579714562026.27332621117687.7266737892
33577992561129.60665954416862.3933404558
34565464548344.77332621117119.2266737892
35547344529167.10665954418176.8933404558
36554788530014.10665954424773.8933404558
37562325542890.73931623919434.2606837607
38560854540080.90598290620773.094017094
39555332532735.90598290622596.0940170940
40543599525440.90598290618158.094017094
41536662529406.3933404567255.60665954417
42542722531082.39334045611639.6066595442
43593530585315.7266737898214.27332621082
44610763597985.39334045612777.6066595442
45612613597088.72667378915524.2733262108
46611324584303.89334045627020.1066595442
47594167565126.22667378929040.7733262108
48595454565973.22667378929480.7733262108
49590865578849.85933048412015.1406695157
50589379576040.02599715113338.974002849
51584428568695.02599715115732.974002849
52573100561400.02599715111699.974002849
53567456553489.32852564113966.671474359
54569028555165.32852564113862.6714743590
55620735609398.66185897411336.3381410256
56628884622068.3285256416815.67147435899
57628232621171.6618589747060.33814102564
58612117608386.8285256413730.17147435897
59595404589209.1618589746194.83814102564
60597141590056.1618589747084.83814102564
61593408602932.794515669-9524.7945156695
62590072600122.961182336-10050.9611823362
63579799592777.961182336-12978.9611823362
64574205585482.961182336-11277.9611823362
65572775577572.263710826-4797.2637108262
66572942579248.263710826-6306.26371082622
67619567633481.59704416-13914.5970441596
68625809646151.263710826-20342.2637108262
69619916645254.59704416-25338.5970441595
70587625632469.763710826-44844.7637108262
71565742613292.09704416-47550.0970441595
72557274614139.097044160-56865.0970441595


Parameters (Session):
par1 = 1 ; par2 = Include Monthly Dummies ; par3 = Linear Trend ;
Parameters (R input):
par1 = 1 ; par2 = Include Monthly Dummies ; par3 = Linear Trend ;
R code (references can be found in the software module):
library(lattice)
par1 <- as.numeric(par1)
x <- t(y)
k <- length(x[1,])
n <- length(x[,1])
x1 <- cbind(x[,par1], x[,1:k!=par1])
mycolnames <- c(colnames(x)[par1], colnames(x)[1:k!=par1])
colnames(x1) <- mycolnames #colnames(x)[par1]
x <- x1
if (par3 == 'First Differences'){
x2 <- array(0, dim=c(n-1,k), dimnames=list(1:(n-1), paste('(1-B)',colnames(x),sep='')))
for (i in 1:n-1) {
for (j in 1:k) {
x2[i,j] <- x[i+1,j] - x[i,j]
}
}
x <- x2
}
if (par2 == 'Include Monthly Dummies'){
x2 <- array(0, dim=c(n,11), dimnames=list(1:n, paste('M', seq(1:11), sep ='')))
for (i in 1:11){
x2[seq(i,n,12),i] <- 1
}
x <- cbind(x, x2)
}
if (par2 == 'Include Quarterly Dummies'){
x2 <- array(0, dim=c(n,3), dimnames=list(1:n, paste('Q', seq(1:3), sep ='')))
for (i in 1:3){
x2[seq(i,n,4),i] <- 1
}
x <- cbind(x, x2)
}
k <- length(x[1,])
if (par3 == 'Linear Trend'){
x <- cbind(x, c(1:n))
colnames(x)[k+1] <- 't'
}
x
k <- length(x[1,])
df <- as.data.frame(x)
(mylm <- lm(df))
(mysum <- summary(mylm))
bitmap(file='test0.png')
plot(x[,1], type='l', main='Actuals and Interpolation', ylab='value of Actuals and Interpolation (dots)', xlab='time or index')
points(x[,1]-mysum$resid)
grid()
dev.off()
bitmap(file='test1.png')
plot(mysum$resid, type='b', pch=19, main='Residuals', ylab='value of Residuals', xlab='time or index')
grid()
dev.off()
bitmap(file='test2.png')
hist(mysum$resid, main='Residual Histogram', xlab='values of Residuals')
grid()
dev.off()
bitmap(file='test3.png')
densityplot(~mysum$resid,col='black',main='Residual Density Plot', xlab='values of Residuals')
dev.off()
bitmap(file='test4.png')
qqnorm(mysum$resid, main='Residual Normal Q-Q Plot')
grid()
dev.off()
(myerror <- as.ts(mysum$resid))
bitmap(file='test5.png')
dum <- cbind(lag(myerror,k=1),myerror)
dum
dum1 <- dum[2:length(myerror),]
dum1
z <- as.data.frame(dum1)
z
plot(z,main=paste('Residual Lag plot, lowess, and regression line'), ylab='values of Residuals', xlab='lagged values of Residuals')
lines(lowess(z))
abline(lm(z))
grid()
dev.off()
bitmap(file='test6.png')
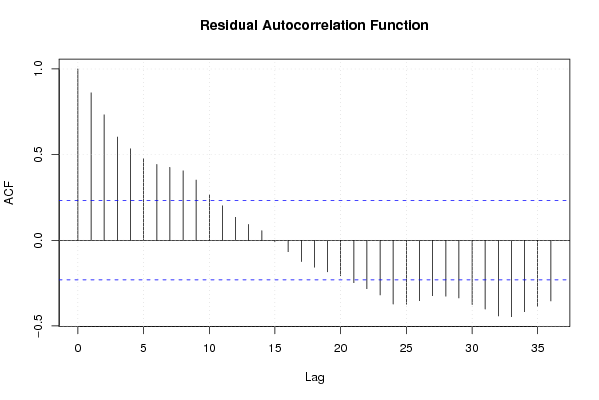
acf(mysum$resid, lag.max=length(mysum$resid)/2, main='Residual Autocorrelation Function')
grid()
dev.off()
bitmap(file='test7.png')
pacf(mysum$resid, lag.max=length(mysum$resid)/2, main='Residual Partial Autocorrelation Function')
grid()
dev.off()
bitmap(file='test8.png')
opar <- par(mfrow = c(2,2), oma = c(0, 0, 1.1, 0))
plot(mylm, las = 1, sub='Residual Diagnostics')
par(opar)
dev.off()
load(file='createtable')
a<-table.start()
a<-table.row.start(a)
a<-table.element(a, 'Multiple Linear Regression - Estimated Regression Equation', 1, TRUE)
a<-table.row.end(a)
myeq <- colnames(x)[1]
myeq <- paste(myeq, '[t] = ', sep='')
for (i in 1:k){
if (mysum$coefficients[i,1] > 0) myeq <- paste(myeq, '+', '')
myeq <- paste(myeq, mysum$coefficients[i,1], sep=' ')
if (rownames(mysum$coefficients)[i] != '(Intercept)') {
myeq <- paste(myeq, rownames(mysum$coefficients)[i], sep='')
if (rownames(mysum$coefficients)[i] != 't') myeq <- paste(myeq, '[t]', sep='')
}
}
myeq <- paste(myeq, ' + e[t]')
a<-table.row.start(a)
a<-table.element(a, myeq)
a<-table.row.end(a)
a<-table.end(a)
table.save(a,file='mytable1.tab')
a<-table.start()
a<-table.row.start(a)
a<-table.element(a,hyperlink('ols1.htm','Multiple Linear Regression - Ordinary Least Squares',''), 6, TRUE)
a<-table.row.end(a)
a<-table.row.start(a)
a<-table.element(a,'Variable',header=TRUE)
a<-table.element(a,'Parameter',header=TRUE)
a<-table.element(a,'S.D.',header=TRUE)
a<-table.element(a,'T-STAT
H0: parameter = 0',header=TRUE)
a<-table.element(a,'2-tail p-value',header=TRUE)
a<-table.element(a,'1-tail p-value',header=TRUE)
a<-table.row.end(a)
for (i in 1:k){
a<-table.row.start(a)
a<-table.element(a,rownames(mysum$coefficients)[i],header=TRUE)
a<-table.element(a,mysum$coefficients[i,1])
a<-table.element(a, round(mysum$coefficients[i,2],6))
a<-table.element(a, round(mysum$coefficients[i,3],4))
a<-table.element(a, round(mysum$coefficients[i,4],6))
a<-table.element(a, round(mysum$coefficients[i,4]/2,6))
a<-table.row.end(a)
}
a<-table.end(a)
table.save(a,file='mytable2.tab')
a<-table.start()
a<-table.row.start(a)
a<-table.element(a, 'Multiple Linear Regression - Regression Statistics', 2, TRUE)
a<-table.row.end(a)
a<-table.row.start(a)
a<-table.element(a, 'Multiple R',1,TRUE)
a<-table.element(a, sqrt(mysum$r.squared))
a<-table.row.end(a)
a<-table.row.start(a)
a<-table.element(a, 'R-squared',1,TRUE)
a<-table.element(a, mysum$r.squared)
a<-table.row.end(a)
a<-table.row.start(a)
a<-table.element(a, 'Adjusted R-squared',1,TRUE)
a<-table.element(a, mysum$adj.r.squared)
a<-table.row.end(a)
a<-table.row.start(a)
a<-table.element(a, 'F-TEST (value)',1,TRUE)
a<-table.element(a, mysum$fstatistic[1])
a<-table.row.end(a)
a<-table.row.start(a)
a<-table.element(a, 'F-TEST (DF numerator)',1,TRUE)
a<-table.element(a, mysum$fstatistic[2])
a<-table.row.end(a)
a<-table.row.start(a)
a<-table.element(a, 'F-TEST (DF denominator)',1,TRUE)
a<-table.element(a, mysum$fstatistic[3])
a<-table.row.end(a)
a<-table.row.start(a)
a<-table.element(a, 'p-value',1,TRUE)
a<-table.element(a, 1-pf(mysum$fstatistic[1],mysum$fstatistic[2],mysum$fstatistic[3]))
a<-table.row.end(a)
a<-table.row.start(a)
a<-table.element(a, 'Multiple Linear Regression - Residual Statistics', 2, TRUE)
a<-table.row.end(a)
a<-table.row.start(a)
a<-table.element(a, 'Residual Standard Deviation',1,TRUE)
a<-table.element(a, mysum$sigma)
a<-table.row.end(a)
a<-table.row.start(a)
a<-table.element(a, 'Sum Squared Residuals',1,TRUE)
a<-table.element(a, sum(myerror*myerror))
a<-table.row.end(a)
a<-table.end(a)
table.save(a,file='mytable3.tab')
a<-table.start()
a<-table.row.start(a)
a<-table.element(a, 'Multiple Linear Regression - Actuals, Interpolation, and Residuals', 4, TRUE)
a<-table.row.end(a)
a<-table.row.start(a)
a<-table.element(a, 'Time or Index', 1, TRUE)
a<-table.element(a, 'Actuals', 1, TRUE)
a<-table.element(a, 'Interpolation
Forecast', 1, TRUE)
a<-table.element(a, 'Residuals
Prediction Error', 1, TRUE)
a<-table.row.end(a)
for (i in 1:n) {
a<-table.row.start(a)
a<-table.element(a,i, 1, TRUE)
a<-table.element(a,x[i])
a<-table.element(a,x[i]-mysum$resid[i])
a<-table.element(a,mysum$resid[i])
a<-table.row.end(a)
}
a<-table.end(a)
table.save(a,file='mytable4.tab')