Free Statistics

of Irreproducible Research!

Author's title

Author*Unverified author*
R Software Modulerwasp_pairs.wasp
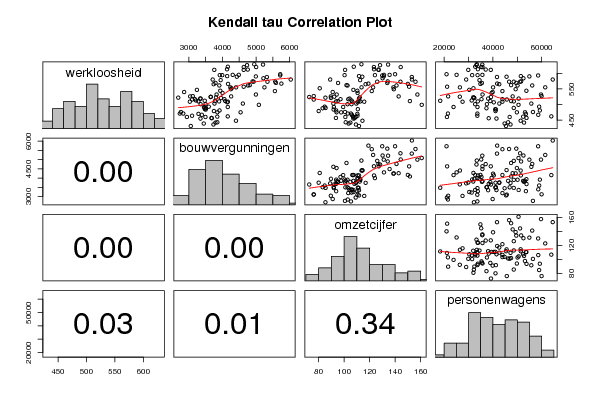
Title produced by softwareKendall tau Correlation Matrix
Date of computationWed, 28 Nov 2007 03:49:05 -0700
Cite this page as followsStatistical Computations at FreeStatistics.org, Office for Research Development and Education, URL https://freestatistics.org/blog/index.php?v=date/2007/Nov/28/t11962469484pu0bal87fz65ah.htm/, Retrieved Thu, 02 May 2024 00:01:42 +0000
Statistical Computations at FreeStatistics.org, Office for Research Development and Education, URL https://freestatistics.org/blog/index.php?pk=7012, Retrieved Thu, 02 May 2024 00:01:42 +0000
QR Codes:

Original text written by user:
IsPrivate?No (this computation is public)
User-defined keywordsbridome
Estimated Impact209
Family? (F = Feedback message, R = changed R code, M = changed R Module, P = changed Parameters, D = changed Data)
-       [Kendall tau Correlation Matrix] [Kendall tau corre...] [2007-11-28 10:49:05] [05eb25e9a99d8c3f4eb6a6fe65650e56] [Current]
Feedback Forum

Post a new message
Dataseries X:
540	2863	91,0	39892
522	2688	85,3	32194
526	3041	89,5	21629
527	3119	76,1	59968
516	3102	76,1	45694
503	4608	91,5	55756
489	3466	85,4	48554
479	3748	80,0	41052
475	4541	94,0	49822
524	3650	72,6	39191
552	4274	80,8	31994
532	3827	94,1	35735
511	3778	94,9	38930
492	3453	91,9	33658
492	4160	99,2	23849
493	3595	84,7	58972
481	3914	93,7	59249
462	4159	106,7	63955
457	3676	93,5	53785
442	3794	104,8	52760
439	3446	103,5	44795
488	3504	83,1	37348
521	3958	89,6	32370
501	3353	105,7	32717
485	3480	110,7	40974
464	3098	110,4	33591
460	2944	109,0	21124
467	3389	106,0	58608
460	3497	100,9	46865
448	4404	114,3	51378
443	3849	101,2	46235
436	3734	109,2	47206
431	3060	111,6	45382
484	3507	91,7	41227
510	3287	93,7	33795
513	3215	105,7	31295
503	3764	109,5	42625
471	2734	105,3	33625
471	2837	102,8	21538
476	2766	100,6	56421
475	3851	97,6	53152
470	3289	110,3	53536
461	3848	107,2	52408
455	3348	107,2	41454
456	3682	108,1	38271
517	4058	97,1	35306
525	3655	92,2	26414
523	3811	112,2	31917
519	3341	111,6	38030
509	3032	115,7	27534
512	3475	111,3	18387
519	3353	104,2	50556
517	3186	103,2	43901
510	3902	112,7	48572
509	4164	106,4	43899
501	3499	102,6	37532
507	4145	110,6	40357
569	3796	95,2	35489
580	3711	89,0	29027
578	3949	112,5	34485
565	3740	116,8	42598
547	3243	107,2	30306
555	4407	113,6	26451
562	4814	101,8	47460
561	3908	102,6	50104
555	5250	122,7	61465
544	3937	110,3	53726
537	4004	110,5	39477
543	5560	121,6	43895
594	3922	100,3	31481
611	3759	100,7	29896
613	4138	123,4	33842
611	4634	127,1	39120
594	3996	124,1	33702
595	4307	131,2	25094
591	4142	111,6	51442
589	4429	114,2	45594
584	5219	130,1	52518
573	4929	125,9	48564
567	5754	119,0	41745
569	5591	133,8	49585
621	4162	107,5	32747
629	4947	113,5	33379
628	5208	134,4	35645
612	4754	126,8	37034
595	4487	135,6	35681
597	5719	139,9	20972
593	5719	129,8	58552
590	4994	131,0	54955
580	6032	153,1	64540
574	4897	134,1	51570
573	5339	144,1	51145
573	5571	155,9	46641
620	4635	123,3	35704
626	4733	128,1	33253
620	5004	144,3	35193
588	5322	153,0	41668
566	4168	149,9	34865
557	4633	150,9	21210
561	4763	141,0	56126
549	4252	138,9	49321
532	4996	157,4	59723
526	4261	142,7	48103
511	4084	151,5	47472
499	5084	160,8	50497
555	4236	138,6	40059


Summary of compuational transaction
Raw Inputview raw input (R code)
Raw Outputview raw output of R engine
Computing time1 seconds
R Server'Gwilym Jenkins' @ 72.249.127.135

\begin{tabular}{lllllllll}
\hline
Summary of compuational transaction \tabularnewline
Raw Input & view raw input (R code)  \tabularnewline
Raw Output & view raw output of R engine  \tabularnewline
Computing time & 1 seconds \tabularnewline
R Server & 'Gwilym Jenkins' @ 72.249.127.135 \tabularnewline
\hline
\end{tabular}
%Source: https://freestatistics.org/blog/index.php?pk=7012&T=0

[TABLE]
[ROW][C]Summary of compuational transaction[/C][/ROW]
[ROW][C]Raw Input[/C][C]view raw input (R code) [/C][/ROW]
[ROW][C]Raw Output[/C][C]view raw output of R engine [/C][/ROW]
[ROW][C]Computing time[/C][C]1 seconds[/C][/ROW]
[ROW][C]R Server[/C][C]'Gwilym Jenkins' @ 72.249.127.135[/C][/ROW]
[/TABLE]
Source: https://freestatistics.org/blog/index.php?pk=7012&T=0

Globally Unique Identifier (entire table): ba.freestatistics.org/blog/index.php?pk=7012&T=0

As an alternative you can also use a QR Code:  

The GUIDs for individual cells are displayed in the table below:

Summary of compuational transaction
Raw Inputview raw input (R code)
Raw Outputview raw output of R engine
Computing time1 seconds
R Server'Gwilym Jenkins' @ 72.249.127.135


Kendall tau rank correlations for all pairs of data series
pairtaup-value
tau( werkloosheid , bouwvergunningen )0.4058737640870077.68466179579264e-10
tau( werkloosheid , omzetcijfer )0.2866675297258521.41640559536693e-05
tau( werkloosheid , personenwagens )-0.1403101829048130.0334310672352718
tau( bouwvergunningen , omzetcijfer )0.449042154888189.46687173097871e-12
tau( bouwvergunningen , personenwagens )0.1630122240562250.0132823935994653
tau( omzetcijfer , personenwagens )0.06331507730066380.336554348740871

\begin{tabular}{lllllllll}
\hline
Kendall tau rank correlations for all pairs of data series \tabularnewline
pair & tau & p-value \tabularnewline
tau( werkloosheid , bouwvergunningen ) & 0.405873764087007 & 7.68466179579264e-10 \tabularnewline
tau( werkloosheid , omzetcijfer ) & 0.286667529725852 & 1.41640559536693e-05 \tabularnewline
tau( werkloosheid , personenwagens ) & -0.140310182904813 & 0.0334310672352718 \tabularnewline
tau( bouwvergunningen , omzetcijfer ) & 0.44904215488818 & 9.46687173097871e-12 \tabularnewline
tau( bouwvergunningen , personenwagens ) & 0.163012224056225 & 0.0132823935994653 \tabularnewline
tau( omzetcijfer , personenwagens ) & 0.0633150773006638 & 0.336554348740871 \tabularnewline
\hline
\end{tabular}
%Source: https://freestatistics.org/blog/index.php?pk=7012&T=1

[TABLE]
[ROW][C]Kendall tau rank correlations for all pairs of data series[/C][/ROW]
[ROW][C]pair[/C][C]tau[/C][C]p-value[/C][/ROW]
[ROW][C]tau( werkloosheid , bouwvergunningen )[/C][C]0.405873764087007[/C][C]7.68466179579264e-10[/C][/ROW]
[ROW][C]tau( werkloosheid , omzetcijfer )[/C][C]0.286667529725852[/C][C]1.41640559536693e-05[/C][/ROW]
[ROW][C]tau( werkloosheid , personenwagens )[/C][C]-0.140310182904813[/C][C]0.0334310672352718[/C][/ROW]
[ROW][C]tau( bouwvergunningen , omzetcijfer )[/C][C]0.44904215488818[/C][C]9.46687173097871e-12[/C][/ROW]
[ROW][C]tau( bouwvergunningen , personenwagens )[/C][C]0.163012224056225[/C][C]0.0132823935994653[/C][/ROW]
[ROW][C]tau( omzetcijfer , personenwagens )[/C][C]0.0633150773006638[/C][C]0.336554348740871[/C][/ROW]
[/TABLE]
Source: https://freestatistics.org/blog/index.php?pk=7012&T=1

Globally Unique Identifier (entire table): ba.freestatistics.org/blog/index.php?pk=7012&T=1

As an alternative you can also use a QR Code:  

The GUIDs for individual cells are displayed in the table below:

Kendall tau rank correlations for all pairs of data series
pairtaup-value
tau( werkloosheid , bouwvergunningen )0.4058737640870077.68466179579264e-10
tau( werkloosheid , omzetcijfer )0.2866675297258521.41640559536693e-05
tau( werkloosheid , personenwagens )-0.1403101829048130.0334310672352718
tau( bouwvergunningen , omzetcijfer )0.449042154888189.46687173097871e-12
tau( bouwvergunningen , personenwagens )0.1630122240562250.0132823935994653
tau( omzetcijfer , personenwagens )0.06331507730066380.336554348740871


Parameters (Session):
Parameters (R input):
R code (references can be found in the software module):
panel.tau <- function(x, y, digits=2, prefix='', cex.cor)
{
usr <- par('usr'); on.exit(par(usr))
par(usr = c(0, 1, 0, 1))
rr <- cor.test(x, y, method='kendall')
r <- round(rr$p.value,2)
txt <- format(c(r, 0.123456789), digits=digits)[1]
txt <- paste(prefix, txt, sep='')
if(missing(cex.cor)) cex <- 0.5/strwidth(txt)
text(0.5, 0.5, txt, cex = cex)
}
panel.hist <- function(x, ...)
{
usr <- par('usr'); on.exit(par(usr))
par(usr = c(usr[1:2], 0, 1.5) )
h <- hist(x, plot = FALSE)
breaks <- h$breaks; nB <- length(breaks)
y <- h$counts; y <- y/max(y)
rect(breaks[-nB], 0, breaks[-1], y, col='grey', ...)
}
bitmap(file='test1.png')
pairs(t(y),diag.panel=panel.hist, upper.panel=panel.smooth, lower.panel=panel.tau, main=main)
dev.off()
load(file='createtable')
a<-table.start()
a<-table.row.start(a)
a<-table.element(a,'Kendall tau rank correlations for all pairs of data series',3,TRUE)
a<-table.row.end(a)
a<-table.row.start(a)
a<-table.element(a,'pair',1,TRUE)
a<-table.element(a,'tau',1,TRUE)
a<-table.element(a,'p-value',1,TRUE)
a<-table.row.end(a)
n <- length(y[,1])
n
cor.test(y[1,],y[2,],method='kendall')
for (i in 1:(n-1))
{
for (j in (i+1):n)
{
a<-table.row.start(a)
dum <- paste('tau(',dimnames(t(x))[[2]][i])
dum <- paste(dum,',')
dum <- paste(dum,dimnames(t(x))[[2]][j])
dum <- paste(dum,')')
a<-table.element(a,dum,header=TRUE)
r <- cor.test(y[i,],y[j,],method='kendall')
a<-table.element(a,r$estimate)
a<-table.element(a,r$p.value)
a<-table.row.end(a)
}
}
a<-table.end(a)
table.save(a,file='mytable.tab')