Free Statistics

of Irreproducible Research!

Author's title

Author*Unverified author*
R Software Modulerwasp_cross.wasp
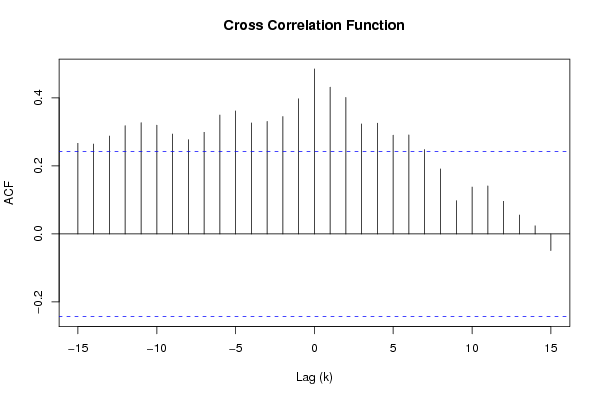
Title produced by softwareCross Correlation Function
Date of computationTue, 27 Nov 2007 11:20:18 -0700
Cite this page as followsStatistical Computations at FreeStatistics.org, Office for Research Development and Education, URL https://freestatistics.org/blog/index.php?v=date/2007/Nov/27/t1196187045l9x7i5r09caq3qh.htm/, Retrieved Sun, 05 May 2024 13:01:37 +0000
Statistical Computations at FreeStatistics.org, Office for Research Development and Education, URL https://freestatistics.org/blog/index.php?pk=6907, Retrieved Sun, 05 May 2024 13:01:37 +0000
QR Codes:

Original text written by user:
IsPrivate?No (this computation is public)
User-defined keywords
Estimated Impact177
Family? (F = Feedback message, R = changed R code, M = changed R Module, P = changed Parameters, D = changed Data)
-       [Cross Correlation Function] [vraag 5 ] [2007-11-27 18:20:18] [a04e235f237a7727ba8ea7d6bf8ed02e] [Current]
Feedback Forum

Post a new message
Dataseries X:
103.6500
103.8700
103.9400
105.3200
105.5400
106.0800
106.2100
105.5300
105.5600
105.1400
105.9700
105.4500
106.2200
106.3100
107.3800
109.3100
110.8200
111.2200
110.6600
110.7600
110.6900
111.0800
110.9700
110.2400
112.5100
111.5200
112.1300
112.2300
112.9200
111.8900
111.9900
111.5100
112.3300
112.0400
112.0900
111.4100
112.6100
113.1400
113.6500
114.2600
114.4000
114.9300
114.8600
114.9500
116.1700
114.6000
114.6200
113.8200
115.0200
115.1800
115.5900
116.6000
117.0700
116.9600
116.6600
116.0700
116.0400
115.8100
116.2200
115.8500
116.4300
117.3900
119.1700
119.2400
120.0300
Dataseries Y:
12398.4
13882.3
15861.5
13286.1
15634.9
14211.0
13646.8
12224.6
15916.4
16535.9
15796.0
14418.6
15044.5
14944.2
16754.8
14254.0
15454.9
15644.8
14568.3
12520.2
14803.0
15873.2
14755.3
12875.1
14291.1
14205.3
15859.4
15258.9
15498.6
15106.5
15023.6
12083.0
15761.3
16943.0
15070.3
13659.6
14768.9
14725.1
15998.1
15370.6
14956.9
15469.7
15101.8
11703.7
16283.6
16726.5
14968.9
14861.0
14583.3
15305.8
17903.9
16379.4
15420.3
17870.5
15912.8
13866.5
17823.2
17872.0
17420.4
16704.4
15991.2
16583.6
19123.5
17838.7
17209.4


Summary of compuational transaction
Raw Inputview raw input (R code)
Raw Outputview raw output of R engine
Computing time1 seconds
R Server'Gwilym Jenkins' @ 72.249.127.135

\begin{tabular}{lllllllll}
\hline
Summary of compuational transaction \tabularnewline
Raw Input & view raw input (R code)  \tabularnewline
Raw Output & view raw output of R engine  \tabularnewline
Computing time & 1 seconds \tabularnewline
R Server & 'Gwilym Jenkins' @ 72.249.127.135 \tabularnewline
\hline
\end{tabular}
%Source: https://freestatistics.org/blog/index.php?pk=6907&T=0

[TABLE]
[ROW][C]Summary of compuational transaction[/C][/ROW]
[ROW][C]Raw Input[/C][C]view raw input (R code) [/C][/ROW]
[ROW][C]Raw Output[/C][C]view raw output of R engine [/C][/ROW]
[ROW][C]Computing time[/C][C]1 seconds[/C][/ROW]
[ROW][C]R Server[/C][C]'Gwilym Jenkins' @ 72.249.127.135[/C][/ROW]
[/TABLE]
Source: https://freestatistics.org/blog/index.php?pk=6907&T=0

Globally Unique Identifier (entire table): ba.freestatistics.org/blog/index.php?pk=6907&T=0

As an alternative you can also use a QR Code:  

The GUIDs for individual cells are displayed in the table below:

Summary of compuational transaction
Raw Inputview raw input (R code)
Raw Outputview raw output of R engine
Computing time1 seconds
R Server'Gwilym Jenkins' @ 72.249.127.135


Cross Correlation Function
ParameterValue
Box-Cox transformation parameter (lambda) of X series1
Degree of non-seasonal differencing (d) of X series0
Degree of seasonal differencing (D) of X series0
Seasonal Period (s)12
Box-Cox transformation parameter (lambda) of Y series1
Degree of non-seasonal differencing (d) of Y series0
Degree of seasonal differencing (D) of Y series0
krho(Y[t],X[t+k])
-150.266691281592530
-140.264323665940250
-130.287817403008473
-120.318648079583041
-110.327398674905994
-100.320044221548525
-90.294022437095761
-80.277243346587638
-70.298993926877894
-60.34988882853242
-50.361933153091868
-40.326465136110503
-30.330843549518505
-20.345497220317238
-10.397507859463284
00.485336747850773
10.431542724426388
20.401474730557845
30.323659380546206
40.325823376259886
50.290444403376376
60.291218620716424
70.248231278469283
80.191316416905855
90.0979403257471236
100.137964904595378
110.141237971605064
120.096151358162152
130.0555525908211754
140.0241811692751931
15-0.0487074302092521

\begin{tabular}{lllllllll}
\hline
Cross Correlation Function \tabularnewline
Parameter & Value \tabularnewline
Box-Cox transformation parameter (lambda) of X series & 1 \tabularnewline
Degree of non-seasonal differencing (d) of X series & 0 \tabularnewline
Degree of seasonal differencing (D) of X series & 0 \tabularnewline
Seasonal Period (s) & 12 \tabularnewline
Box-Cox transformation parameter (lambda) of Y series & 1 \tabularnewline
Degree of non-seasonal differencing (d) of Y series & 0 \tabularnewline
Degree of seasonal differencing (D) of Y series & 0 \tabularnewline
k & rho(Y[t],X[t+k]) \tabularnewline
-15 & 0.266691281592530 \tabularnewline
-14 & 0.264323665940250 \tabularnewline
-13 & 0.287817403008473 \tabularnewline
-12 & 0.318648079583041 \tabularnewline
-11 & 0.327398674905994 \tabularnewline
-10 & 0.320044221548525 \tabularnewline
-9 & 0.294022437095761 \tabularnewline
-8 & 0.277243346587638 \tabularnewline
-7 & 0.298993926877894 \tabularnewline
-6 & 0.34988882853242 \tabularnewline
-5 & 0.361933153091868 \tabularnewline
-4 & 0.326465136110503 \tabularnewline
-3 & 0.330843549518505 \tabularnewline
-2 & 0.345497220317238 \tabularnewline
-1 & 0.397507859463284 \tabularnewline
0 & 0.485336747850773 \tabularnewline
1 & 0.431542724426388 \tabularnewline
2 & 0.401474730557845 \tabularnewline
3 & 0.323659380546206 \tabularnewline
4 & 0.325823376259886 \tabularnewline
5 & 0.290444403376376 \tabularnewline
6 & 0.291218620716424 \tabularnewline
7 & 0.248231278469283 \tabularnewline
8 & 0.191316416905855 \tabularnewline
9 & 0.0979403257471236 \tabularnewline
10 & 0.137964904595378 \tabularnewline
11 & 0.141237971605064 \tabularnewline
12 & 0.096151358162152 \tabularnewline
13 & 0.0555525908211754 \tabularnewline
14 & 0.0241811692751931 \tabularnewline
15 & -0.0487074302092521 \tabularnewline
\hline
\end{tabular}
%Source: https://freestatistics.org/blog/index.php?pk=6907&T=1

[TABLE]
[ROW][C]Cross Correlation Function[/C][/ROW]
[ROW][C]Parameter[/C][C]Value[/C][/ROW]
[ROW][C]Box-Cox transformation parameter (lambda) of X series[/C][C]1[/C][/ROW]
[ROW][C]Degree of non-seasonal differencing (d) of X series[/C][C]0[/C][/ROW]
[ROW][C]Degree of seasonal differencing (D) of X series[/C][C]0[/C][/ROW]
[ROW][C]Seasonal Period (s)[/C][C]12[/C][/ROW]
[ROW][C]Box-Cox transformation parameter (lambda) of Y series[/C][C]1[/C][/ROW]
[ROW][C]Degree of non-seasonal differencing (d) of Y series[/C][C]0[/C][/ROW]
[ROW][C]Degree of seasonal differencing (D) of Y series[/C][C]0[/C][/ROW]
[ROW][C]k[/C][C]rho(Y[t],X[t+k])[/C][/ROW]
[ROW][C]-15[/C][C]0.266691281592530[/C][/ROW]
[ROW][C]-14[/C][C]0.264323665940250[/C][/ROW]
[ROW][C]-13[/C][C]0.287817403008473[/C][/ROW]
[ROW][C]-12[/C][C]0.318648079583041[/C][/ROW]
[ROW][C]-11[/C][C]0.327398674905994[/C][/ROW]
[ROW][C]-10[/C][C]0.320044221548525[/C][/ROW]
[ROW][C]-9[/C][C]0.294022437095761[/C][/ROW]
[ROW][C]-8[/C][C]0.277243346587638[/C][/ROW]
[ROW][C]-7[/C][C]0.298993926877894[/C][/ROW]
[ROW][C]-6[/C][C]0.34988882853242[/C][/ROW]
[ROW][C]-5[/C][C]0.361933153091868[/C][/ROW]
[ROW][C]-4[/C][C]0.326465136110503[/C][/ROW]
[ROW][C]-3[/C][C]0.330843549518505[/C][/ROW]
[ROW][C]-2[/C][C]0.345497220317238[/C][/ROW]
[ROW][C]-1[/C][C]0.397507859463284[/C][/ROW]
[ROW][C]0[/C][C]0.485336747850773[/C][/ROW]
[ROW][C]1[/C][C]0.431542724426388[/C][/ROW]
[ROW][C]2[/C][C]0.401474730557845[/C][/ROW]
[ROW][C]3[/C][C]0.323659380546206[/C][/ROW]
[ROW][C]4[/C][C]0.325823376259886[/C][/ROW]
[ROW][C]5[/C][C]0.290444403376376[/C][/ROW]
[ROW][C]6[/C][C]0.291218620716424[/C][/ROW]
[ROW][C]7[/C][C]0.248231278469283[/C][/ROW]
[ROW][C]8[/C][C]0.191316416905855[/C][/ROW]
[ROW][C]9[/C][C]0.0979403257471236[/C][/ROW]
[ROW][C]10[/C][C]0.137964904595378[/C][/ROW]
[ROW][C]11[/C][C]0.141237971605064[/C][/ROW]
[ROW][C]12[/C][C]0.096151358162152[/C][/ROW]
[ROW][C]13[/C][C]0.0555525908211754[/C][/ROW]
[ROW][C]14[/C][C]0.0241811692751931[/C][/ROW]
[ROW][C]15[/C][C]-0.0487074302092521[/C][/ROW]
[/TABLE]
Source: https://freestatistics.org/blog/index.php?pk=6907&T=1

Globally Unique Identifier (entire table): ba.freestatistics.org/blog/index.php?pk=6907&T=1

As an alternative you can also use a QR Code:  

The GUIDs for individual cells are displayed in the table below:

Cross Correlation Function
ParameterValue
Box-Cox transformation parameter (lambda) of X series1
Degree of non-seasonal differencing (d) of X series0
Degree of seasonal differencing (D) of X series0
Seasonal Period (s)12
Box-Cox transformation parameter (lambda) of Y series1
Degree of non-seasonal differencing (d) of Y series0
Degree of seasonal differencing (D) of Y series0
krho(Y[t],X[t+k])
-150.266691281592530
-140.264323665940250
-130.287817403008473
-120.318648079583041
-110.327398674905994
-100.320044221548525
-90.294022437095761
-80.277243346587638
-70.298993926877894
-60.34988882853242
-50.361933153091868
-40.326465136110503
-30.330843549518505
-20.345497220317238
-10.397507859463284
00.485336747850773
10.431542724426388
20.401474730557845
30.323659380546206
40.325823376259886
50.290444403376376
60.291218620716424
70.248231278469283
80.191316416905855
90.0979403257471236
100.137964904595378
110.141237971605064
120.096151358162152
130.0555525908211754
140.0241811692751931
15-0.0487074302092521


Parameters (Session):
par1 = 1 ; par2 = 0 ; par3 = 0 ; par4 = 12 ; par5 = 1 ; par6 = 0 ; par7 = 0 ;
Parameters (R input):
par1 = 1 ; par2 = 0 ; par3 = 0 ; par4 = 12 ; par5 = 1 ; par6 = 0 ; par7 = 0 ;
R code (references can be found in the software module):
par1 <- as.numeric(par1)
par2 <- as.numeric(par2)
par3 <- as.numeric(par3)
par4 <- as.numeric(par4)
par5 <- as.numeric(par5)
par6 <- as.numeric(par6)
par7 <- as.numeric(par7)
if (par1 == 0) {
x <- log(x)
} else {
x <- (x ^ par1 - 1) / par1
}
if (par5 == 0) {
y <- log(y)
} else {
y <- (y ^ par5 - 1) / par5
}
if (par2 > 0) x <- diff(x,lag=1,difference=par2)
if (par6 > 0) y <- diff(y,lag=1,difference=par6)
if (par3 > 0) x <- diff(x,lag=par4,difference=par3)
if (par7 > 0) x <- diff(y,lag=par4,difference=par7)
x
y
bitmap(file='test1.png')
(r <- ccf(x,y,main='Cross Correlation Function',xlab='Lag (k)'))
dev.off()
load(file='createtable')
a<-table.start()
a<-table.row.start(a)
a<-table.element(a,'Cross Correlation Function',2,TRUE)
a<-table.row.end(a)
a<-table.row.start(a)
a<-table.element(a,'Parameter',header=TRUE)
a<-table.element(a,'Value',header=TRUE)
a<-table.row.end(a)
a<-table.row.start(a)
a<-table.element(a,'Box-Cox transformation parameter (lambda) of X series',header=TRUE)
a<-table.element(a,par1)
a<-table.row.end(a)
a<-table.row.start(a)
a<-table.element(a,'Degree of non-seasonal differencing (d) of X series',header=TRUE)
a<-table.element(a,par2)
a<-table.row.end(a)
a<-table.row.start(a)
a<-table.element(a,'Degree of seasonal differencing (D) of X series',header=TRUE)
a<-table.element(a,par3)
a<-table.row.end(a)
a<-table.row.start(a)
a<-table.element(a,'Seasonal Period (s)',header=TRUE)
a<-table.element(a,par4)
a<-table.row.end(a)
a<-table.row.start(a)
a<-table.element(a,'Box-Cox transformation parameter (lambda) of Y series',header=TRUE)
a<-table.element(a,par5)
a<-table.row.end(a)
a<-table.row.start(a)
a<-table.element(a,'Degree of non-seasonal differencing (d) of Y series',header=TRUE)
a<-table.element(a,par6)
a<-table.row.end(a)
a<-table.row.start(a)
a<-table.element(a,'Degree of seasonal differencing (D) of Y series',header=TRUE)
a<-table.element(a,par7)
a<-table.row.end(a)
a<-table.row.start(a)
a<-table.element(a,'k',header=TRUE)
a<-table.element(a,'rho(Y[t],X[t+k])',header=TRUE)
a<-table.row.end(a)
mylength <- length(r$acf)
myhalf <- floor((mylength-1)/2)
for (i in 1:mylength) {
a<-table.row.start(a)
a<-table.element(a,i-myhalf-1,header=TRUE)
a<-table.element(a,r$acf[i])
a<-table.row.end(a)
}
a<-table.end(a)
table.save(a,file='mytable.tab')