Free Statistics

of Irreproducible Research!

Author's title

Author*Unverified author*
R Software Modulerwasp_smp.wasp
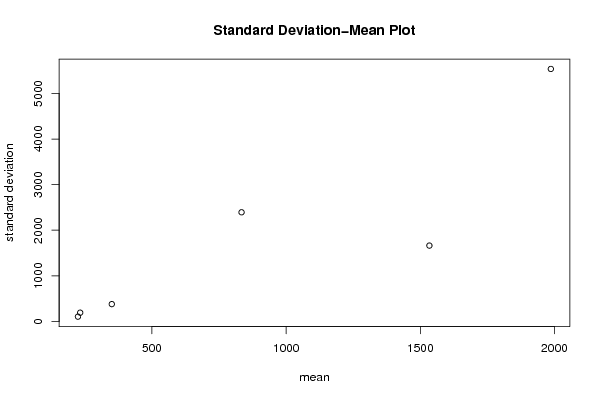
Title produced by softwareStandard Deviation-Mean Plot
Date of computationTue, 27 Nov 2007 05:45:06 -0700
Cite this page as followsStatistical Computations at FreeStatistics.org, Office for Research Development and Education, URL https://freestatistics.org/blog/index.php?v=date/2007/Nov/27/t1196167158lqa6aehqyyuzrij.htm/, Retrieved Sun, 05 May 2024 13:37:58 +0000
Statistical Computations at FreeStatistics.org, Office for Research Development and Education, URL https://freestatistics.org/blog/index.php?pk=6861, Retrieved Sun, 05 May 2024 13:37:58 +0000
QR Codes:

Original text written by user:
IsPrivate?No (this computation is public)
User-defined keywords
Estimated Impact178
Family? (F = Feedback message, R = changed R code, M = changed R Module, P = changed Parameters, D = changed Data)
-       [Standard Deviation-Mean Plot] [reeks 3 standard ...] [2007-11-27 12:45:06] [372f82c86cdcc50abc807b137b6a3bca] [Current]
Feedback Forum

Post a new message
Dataseries X:
187
94
185
208
170
1962
349
638
180
256
116
19496
369
110
249
1486
105
412
337
430
169
133
76
328
175
169
165
141
92
233
110
170
94
125
100
8434
126
381
799
150
190
165
162
137
131
162
141
247
175
357
107
310
116
376
230
54
194
171
311
290
4435
440
1430
820
219
419
1693
2068
832
415
372
5266


Summary of compuational transaction
Raw Inputview raw input (R code)
Raw Outputview raw output of R engine
Computing time1 seconds
R Server'Gwilym Jenkins' @ 72.249.127.135

\begin{tabular}{lllllllll}
\hline
Summary of compuational transaction \tabularnewline
Raw Input & view raw input (R code)  \tabularnewline
Raw Output & view raw output of R engine  \tabularnewline
Computing time & 1 seconds \tabularnewline
R Server & 'Gwilym Jenkins' @ 72.249.127.135 \tabularnewline
\hline
\end{tabular}
%Source: https://freestatistics.org/blog/index.php?pk=6861&T=0

[TABLE]
[ROW][C]Summary of compuational transaction[/C][/ROW]
[ROW][C]Raw Input[/C][C]view raw input (R code) [/C][/ROW]
[ROW][C]Raw Output[/C][C]view raw output of R engine [/C][/ROW]
[ROW][C]Computing time[/C][C]1 seconds[/C][/ROW]
[ROW][C]R Server[/C][C]'Gwilym Jenkins' @ 72.249.127.135[/C][/ROW]
[/TABLE]
Source: https://freestatistics.org/blog/index.php?pk=6861&T=0

Globally Unique Identifier (entire table): ba.freestatistics.org/blog/index.php?pk=6861&T=0

As an alternative you can also use a QR Code:  

The GUIDs for individual cells are displayed in the table below:

Summary of compuational transaction
Raw Inputview raw input (R code)
Raw Outputview raw output of R engine
Computing time1 seconds
R Server'Gwilym Jenkins' @ 72.249.127.135


Standard Deviation-Mean Plot
SectionMeanStandard DeviationRange
11986.755538.0320122026919370
2350.333333333333379.5337650168681392
38342393.745448607118327
4232.583333333333191.98269729485658
5224.25104.669284371821284
61534.083333333331663.489457208085101

\begin{tabular}{lllllllll}
\hline
Standard Deviation-Mean Plot \tabularnewline
Section & Mean & Standard Deviation & Range \tabularnewline
1 & 1986.75 & 5538.03201220269 & 19370 \tabularnewline
2 & 350.333333333333 & 379.533765016868 & 1392 \tabularnewline
3 & 834 & 2393.74544860711 & 8327 \tabularnewline
4 & 232.583333333333 & 191.98269729485 & 658 \tabularnewline
5 & 224.25 & 104.669284371821 & 284 \tabularnewline
6 & 1534.08333333333 & 1663.48945720808 & 5101 \tabularnewline
\hline
\end{tabular}
%Source: https://freestatistics.org/blog/index.php?pk=6861&T=1

[TABLE]
[ROW][C]Standard Deviation-Mean Plot[/C][/ROW]
[ROW][C]Section[/C][C]Mean[/C][C]Standard Deviation[/C][C]Range[/C][/ROW]
[ROW][C]1[/C][C]1986.75[/C][C]5538.03201220269[/C][C]19370[/C][/ROW]
[ROW][C]2[/C][C]350.333333333333[/C][C]379.533765016868[/C][C]1392[/C][/ROW]
[ROW][C]3[/C][C]834[/C][C]2393.74544860711[/C][C]8327[/C][/ROW]
[ROW][C]4[/C][C]232.583333333333[/C][C]191.98269729485[/C][C]658[/C][/ROW]
[ROW][C]5[/C][C]224.25[/C][C]104.669284371821[/C][C]284[/C][/ROW]
[ROW][C]6[/C][C]1534.08333333333[/C][C]1663.48945720808[/C][C]5101[/C][/ROW]
[/TABLE]
Source: https://freestatistics.org/blog/index.php?pk=6861&T=1

Globally Unique Identifier (entire table): ba.freestatistics.org/blog/index.php?pk=6861&T=1

As an alternative you can also use a QR Code:  

The GUIDs for individual cells are displayed in the table below:

Standard Deviation-Mean Plot
SectionMeanStandard DeviationRange
11986.755538.0320122026919370
2350.333333333333379.5337650168681392
38342393.745448607118327
4232.583333333333191.98269729485658
5224.25104.669284371821284
61534.083333333331663.489457208085101


Regression: S.E.(k) = alpha + beta * Mean(k)
alpha-426.452507666709
beta2.48550323725333
S.D.0.642026006634959
T-STAT3.87134354616031
p-value0.0179729443577943

\begin{tabular}{lllllllll}
\hline
Regression: S.E.(k) = alpha + beta * Mean(k) \tabularnewline
alpha & -426.452507666709 \tabularnewline
beta & 2.48550323725333 \tabularnewline
S.D. & 0.642026006634959 \tabularnewline
T-STAT & 3.87134354616031 \tabularnewline
p-value & 0.0179729443577943 \tabularnewline
\hline
\end{tabular}
%Source: https://freestatistics.org/blog/index.php?pk=6861&T=2

[TABLE]
[ROW][C]Regression: S.E.(k) = alpha + beta * Mean(k)[/C][/ROW]
[ROW][C]alpha[/C][C]-426.452507666709[/C][/ROW]
[ROW][C]beta[/C][C]2.48550323725333[/C][/ROW]
[ROW][C]S.D.[/C][C]0.642026006634959[/C][/ROW]
[ROW][C]T-STAT[/C][C]3.87134354616031[/C][/ROW]
[ROW][C]p-value[/C][C]0.0179729443577943[/C][/ROW]
[/TABLE]
Source: https://freestatistics.org/blog/index.php?pk=6861&T=2

Globally Unique Identifier (entire table): ba.freestatistics.org/blog/index.php?pk=6861&T=2

As an alternative you can also use a QR Code:  

The GUIDs for individual cells are displayed in the table below:

Regression: S.E.(k) = alpha + beta * Mean(k)
alpha-426.452507666709
beta2.48550323725333
S.D.0.642026006634959
T-STAT3.87134354616031
p-value0.0179729443577943


Regression: ln S.E.(k) = alpha + beta * ln Mean(k)
alpha-3.33352565278992
beta1.55470406340561
S.D.0.245933875085553
T-STAT6.32163447538399
p-value0.00320366657179446
Lambda-0.554704063405612

\begin{tabular}{lllllllll}
\hline
Regression: ln S.E.(k) = alpha + beta * ln Mean(k) \tabularnewline
alpha & -3.33352565278992 \tabularnewline
beta & 1.55470406340561 \tabularnewline
S.D. & 0.245933875085553 \tabularnewline
T-STAT & 6.32163447538399 \tabularnewline
p-value & 0.00320366657179446 \tabularnewline
Lambda & -0.554704063405612 \tabularnewline
\hline
\end{tabular}
%Source: https://freestatistics.org/blog/index.php?pk=6861&T=3

[TABLE]
[ROW][C]Regression: ln S.E.(k) = alpha + beta * ln Mean(k)[/C][/ROW]
[ROW][C]alpha[/C][C]-3.33352565278992[/C][/ROW]
[ROW][C]beta[/C][C]1.55470406340561[/C][/ROW]
[ROW][C]S.D.[/C][C]0.245933875085553[/C][/ROW]
[ROW][C]T-STAT[/C][C]6.32163447538399[/C][/ROW]
[ROW][C]p-value[/C][C]0.00320366657179446[/C][/ROW]
[ROW][C]Lambda[/C][C]-0.554704063405612[/C][/ROW]
[/TABLE]
Source: https://freestatistics.org/blog/index.php?pk=6861&T=3

Globally Unique Identifier (entire table): ba.freestatistics.org/blog/index.php?pk=6861&T=3

As an alternative you can also use a QR Code:  

The GUIDs for individual cells are displayed in the table below:

Regression: ln S.E.(k) = alpha + beta * ln Mean(k)
alpha-3.33352565278992
beta1.55470406340561
S.D.0.245933875085553
T-STAT6.32163447538399
p-value0.00320366657179446
Lambda-0.554704063405612


Parameters (Session):
par1 = 12 ;
Parameters (R input):
par1 = 12 ;
R code (references can be found in the software module):
par1 <- as.numeric(par1)
(n <- length(x))
(np <- floor(n / par1))
arr <- array(NA,dim=c(par1,np))
j <- 0
k <- 1
for (i in 1:(np*par1))
{
j = j + 1
arr[j,k] <- x[i]
if (j == par1) {
j = 0
k=k+1
}
}
arr
arr.mean <- array(NA,dim=np)
arr.sd <- array(NA,dim=np)
arr.range <- array(NA,dim=np)
for (j in 1:np)
{
arr.mean[j] <- mean(arr[,j],na.rm=TRUE)
arr.sd[j] <- sd(arr[,j],na.rm=TRUE)
arr.range[j] <- max(arr[,j],na.rm=TRUE) - min(arr[j,],na.rm=TRUE)
}
arr.mean
arr.sd
arr.range
(lm1 <- lm(arr.sd~arr.mean))
(lnlm1 <- lm(log(arr.sd)~log(arr.mean)))
(lm2 <- lm(arr.range~arr.mean))
bitmap(file='test1.png')
plot(arr.mean,arr.sd,main='Standard Deviation-Mean Plot',xlab='mean',ylab='standard deviation')
dev.off()
bitmap(file='test2.png')
plot(arr.mean,arr.range,main='Range-Mean Plot',xlab='mean',ylab='range')
dev.off()
load(file='createtable')
a<-table.start()
a<-table.row.start(a)
a<-table.element(a,'Standard Deviation-Mean Plot',4,TRUE)
a<-table.row.end(a)
a<-table.row.start(a)
a<-table.element(a,'Section',header=TRUE)
a<-table.element(a,'Mean',header=TRUE)
a<-table.element(a,'Standard Deviation',header=TRUE)
a<-table.element(a,'Range',header=TRUE)
a<-table.row.end(a)
for (j in 1:np) {
a<-table.row.start(a)
a<-table.element(a,j,header=TRUE)
a<-table.element(a,arr.mean[j])
a<-table.element(a,arr.sd[j] )
a<-table.element(a,arr.range[j] )
a<-table.row.end(a)
}
a<-table.end(a)
table.save(a,file='mytable.tab')
a<-table.start()
a<-table.row.start(a)
a<-table.element(a,'Regression: S.E.(k) = alpha + beta * Mean(k)',2,TRUE)
a<-table.row.end(a)
a<-table.row.start(a)
a<-table.element(a,'alpha',header=TRUE)
a<-table.element(a,lm1$coefficients[[1]])
a<-table.row.end(a)
a<-table.row.start(a)
a<-table.element(a,'beta',header=TRUE)
a<-table.element(a,lm1$coefficients[[2]])
a<-table.row.end(a)
a<-table.row.start(a)
a<-table.element(a,'S.D.',header=TRUE)
a<-table.element(a,summary(lm1)$coefficients[2,2])
a<-table.row.end(a)
a<-table.row.start(a)
a<-table.element(a,'T-STAT',header=TRUE)
a<-table.element(a,summary(lm1)$coefficients[2,3])
a<-table.row.end(a)
a<-table.row.start(a)
a<-table.element(a,'p-value',header=TRUE)
a<-table.element(a,summary(lm1)$coefficients[2,4])
a<-table.row.end(a)
a<-table.end(a)
table.save(a,file='mytable1.tab')
a<-table.start()
a<-table.row.start(a)
a<-table.element(a,'Regression: ln S.E.(k) = alpha + beta * ln Mean(k)',2,TRUE)
a<-table.row.end(a)
a<-table.row.start(a)
a<-table.element(a,'alpha',header=TRUE)
a<-table.element(a,lnlm1$coefficients[[1]])
a<-table.row.end(a)
a<-table.row.start(a)
a<-table.element(a,'beta',header=TRUE)
a<-table.element(a,lnlm1$coefficients[[2]])
a<-table.row.end(a)
a<-table.row.start(a)
a<-table.element(a,'S.D.',header=TRUE)
a<-table.element(a,summary(lnlm1)$coefficients[2,2])
a<-table.row.end(a)
a<-table.row.start(a)
a<-table.element(a,'T-STAT',header=TRUE)
a<-table.element(a,summary(lnlm1)$coefficients[2,3])
a<-table.row.end(a)
a<-table.row.start(a)
a<-table.element(a,'p-value',header=TRUE)
a<-table.element(a,summary(lnlm1)$coefficients[2,4])
a<-table.row.end(a)
a<-table.row.start(a)
a<-table.element(a,'Lambda',header=TRUE)
a<-table.element(a,1-lnlm1$coefficients[[2]])
a<-table.row.end(a)
a<-table.end(a)
table.save(a,file='mytable2.tab')