Free Statistics

of Irreproducible Research!

Author's title

Author*Unverified author*
R Software Modulerwasp_smp.wasp
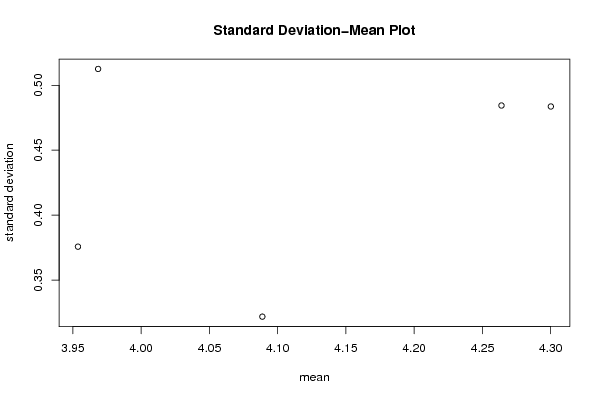
Title produced by softwareStandard Deviation-Mean Plot
Date of computationTue, 27 Nov 2007 02:39:46 -0700
Cite this page as followsStatistical Computations at FreeStatistics.org, Office for Research Development and Education, URL https://freestatistics.org/blog/index.php?v=date/2007/Nov/27/t1196156007qcniv7ag8eocypj.htm/, Retrieved Sun, 05 May 2024 13:12:07 +0000
Statistical Computations at FreeStatistics.org, Office for Research Development and Education, URL https://freestatistics.org/blog/index.php?pk=6758, Retrieved Sun, 05 May 2024 13:12:07 +0000
QR Codes:

Original text written by user:
IsPrivate?No (this computation is public)
User-defined keywordsYannick Leroy, Nick Vandewalle, Jeroen Goetschalckx, Nick Van Hove, Jef Jacobs, Michiel Van den Broeck
Estimated Impact243
Family? (F = Feedback message, R = changed R code, M = changed R Module, P = changed Parameters, D = changed Data)
-       [Standard Deviation-Mean Plot] [workshop 3: Q1] [2007-11-27 09:39:46] [9ec4fcc2bfe8b6d942eac6074e595603] [Current]
- RM D    [Standard Deviation-Mean Plot] [PAPER] [2009-12-02 22:38:25] [37daf76adc256428993ec4063536c760]
Feedback Forum

Post a new message
Dataseries X:
3.926
3.517
4.142
4.353
5.029
4.755
3.862
4.406
4.567
4.863
4.121
3.626
3.804
3.491
4.151
4.254
4.717
4.866
4.001
3.758
4.78
5.016
4.296
4.467
3.891
3.872
3.867
3.973
4.64
4.538
3.836
3.77
4.374
4.497
3.945
3.862
3.608
3.301
3.882
3.605
4.305
4.216
3.971
3.988
4.317
4.484
4.247
3.52
3.687
3.405
3.99
4.047
4.549
4.559
3.926
4.206
4.517
4.387
3.219
3.129


Summary of compuational transaction
Raw Inputview raw input (R code)
Raw Outputview raw output of R engine
Computing time1 seconds
R Server'Gwilym Jenkins' @ 72.249.127.135

\begin{tabular}{lllllllll}
\hline
Summary of compuational transaction \tabularnewline
Raw Input & view raw input (R code)  \tabularnewline
Raw Output & view raw output of R engine  \tabularnewline
Computing time & 1 seconds \tabularnewline
R Server & 'Gwilym Jenkins' @ 72.249.127.135 \tabularnewline
\hline
\end{tabular}
%Source: https://freestatistics.org/blog/index.php?pk=6758&T=0

[TABLE]
[ROW][C]Summary of compuational transaction[/C][/ROW]
[ROW][C]Raw Input[/C][C]view raw input (R code) [/C][/ROW]
[ROW][C]Raw Output[/C][C]view raw output of R engine [/C][/ROW]
[ROW][C]Computing time[/C][C]1 seconds[/C][/ROW]
[ROW][C]R Server[/C][C]'Gwilym Jenkins' @ 72.249.127.135[/C][/ROW]
[/TABLE]
Source: https://freestatistics.org/blog/index.php?pk=6758&T=0

Globally Unique Identifier (entire table): ba.freestatistics.org/blog/index.php?pk=6758&T=0

As an alternative you can also use a QR Code:  

The GUIDs for individual cells are displayed in the table below:

Summary of compuational transaction
Raw Inputview raw input (R code)
Raw Outputview raw output of R engine
Computing time1 seconds
R Server'Gwilym Jenkins' @ 72.249.127.135


Standard Deviation-Mean Plot
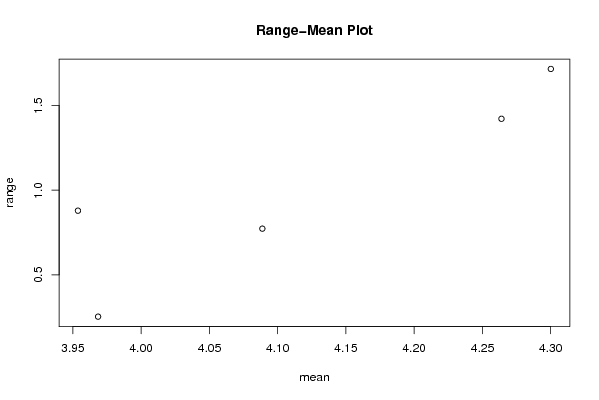
SectionMeanStandard DeviationRange
14.263916666666670.4844148219212231.421
24.300083333333330.4836588689511971.715
34.088750.3219201270219340.773
43.953666666666670.3757746745865210.879
53.968416666666670.5125503892449520.254000000000000

\begin{tabular}{lllllllll}
\hline
Standard Deviation-Mean Plot \tabularnewline
Section & Mean & Standard Deviation & Range \tabularnewline
1 & 4.26391666666667 & 0.484414821921223 & 1.421 \tabularnewline
2 & 4.30008333333333 & 0.483658868951197 & 1.715 \tabularnewline
3 & 4.08875 & 0.321920127021934 & 0.773 \tabularnewline
4 & 3.95366666666667 & 0.375774674586521 & 0.879 \tabularnewline
5 & 3.96841666666667 & 0.512550389244952 & 0.254000000000000 \tabularnewline
\hline
\end{tabular}
%Source: https://freestatistics.org/blog/index.php?pk=6758&T=1

[TABLE]
[ROW][C]Standard Deviation-Mean Plot[/C][/ROW]
[ROW][C]Section[/C][C]Mean[/C][C]Standard Deviation[/C][C]Range[/C][/ROW]
[ROW][C]1[/C][C]4.26391666666667[/C][C]0.484414821921223[/C][C]1.421[/C][/ROW]
[ROW][C]2[/C][C]4.30008333333333[/C][C]0.483658868951197[/C][C]1.715[/C][/ROW]
[ROW][C]3[/C][C]4.08875[/C][C]0.321920127021934[/C][C]0.773[/C][/ROW]
[ROW][C]4[/C][C]3.95366666666667[/C][C]0.375774674586521[/C][C]0.879[/C][/ROW]
[ROW][C]5[/C][C]3.96841666666667[/C][C]0.512550389244952[/C][C]0.254000000000000[/C][/ROW]
[/TABLE]
Source: https://freestatistics.org/blog/index.php?pk=6758&T=1

Globally Unique Identifier (entire table): ba.freestatistics.org/blog/index.php?pk=6758&T=1

As an alternative you can also use a QR Code:  

The GUIDs for individual cells are displayed in the table below:

Standard Deviation-Mean Plot
SectionMeanStandard DeviationRange
14.263916666666670.4844148219212231.421
24.300083333333330.4836588689511971.715
34.088750.3219201270219340.773
43.953666666666670.3757746745865210.879
53.968416666666670.5125503892449520.254000000000000


Regression: S.E.(k) = alpha + beta * Mean(k)
alpha-0.253355470798638
beta0.167442242661456
S.D.0.277554354125970
T-STAT0.603277304687721
p-value0.588882886920502

\begin{tabular}{lllllllll}
\hline
Regression: S.E.(k) = alpha + beta * Mean(k) \tabularnewline
alpha & -0.253355470798638 \tabularnewline
beta & 0.167442242661456 \tabularnewline
S.D. & 0.277554354125970 \tabularnewline
T-STAT & 0.603277304687721 \tabularnewline
p-value & 0.588882886920502 \tabularnewline
\hline
\end{tabular}
%Source: https://freestatistics.org/blog/index.php?pk=6758&T=2

[TABLE]
[ROW][C]Regression: S.E.(k) = alpha + beta * Mean(k)[/C][/ROW]
[ROW][C]alpha[/C][C]-0.253355470798638[/C][/ROW]
[ROW][C]beta[/C][C]0.167442242661456[/C][/ROW]
[ROW][C]S.D.[/C][C]0.277554354125970[/C][/ROW]
[ROW][C]T-STAT[/C][C]0.603277304687721[/C][/ROW]
[ROW][C]p-value[/C][C]0.588882886920502[/C][/ROW]
[/TABLE]
Source: https://freestatistics.org/blog/index.php?pk=6758&T=2

Globally Unique Identifier (entire table): ba.freestatistics.org/blog/index.php?pk=6758&T=2

As an alternative you can also use a QR Code:  

The GUIDs for individual cells are displayed in the table below:

Regression: S.E.(k) = alpha + beta * Mean(k)
alpha-0.253355470798638
beta0.167442242661456
S.D.0.277554354125970
T-STAT0.603277304687721
p-value0.588882886920502


Regression: ln S.E.(k) = alpha + beta * ln Mean(k)
alpha-3.20764501603797
beta1.66992097971060
S.D.2.78947905729845
T-STAT0.59864976413477
p-value0.591592856579925
Lambda-0.669920979710596

\begin{tabular}{lllllllll}
\hline
Regression: ln S.E.(k) = alpha + beta * ln Mean(k) \tabularnewline
alpha & -3.20764501603797 \tabularnewline
beta & 1.66992097971060 \tabularnewline
S.D. & 2.78947905729845 \tabularnewline
T-STAT & 0.59864976413477 \tabularnewline
p-value & 0.591592856579925 \tabularnewline
Lambda & -0.669920979710596 \tabularnewline
\hline
\end{tabular}
%Source: https://freestatistics.org/blog/index.php?pk=6758&T=3

[TABLE]
[ROW][C]Regression: ln S.E.(k) = alpha + beta * ln Mean(k)[/C][/ROW]
[ROW][C]alpha[/C][C]-3.20764501603797[/C][/ROW]
[ROW][C]beta[/C][C]1.66992097971060[/C][/ROW]
[ROW][C]S.D.[/C][C]2.78947905729845[/C][/ROW]
[ROW][C]T-STAT[/C][C]0.59864976413477[/C][/ROW]
[ROW][C]p-value[/C][C]0.591592856579925[/C][/ROW]
[ROW][C]Lambda[/C][C]-0.669920979710596[/C][/ROW]
[/TABLE]
Source: https://freestatistics.org/blog/index.php?pk=6758&T=3

Globally Unique Identifier (entire table): ba.freestatistics.org/blog/index.php?pk=6758&T=3

As an alternative you can also use a QR Code:  

The GUIDs for individual cells are displayed in the table below:

Regression: ln S.E.(k) = alpha + beta * ln Mean(k)
alpha-3.20764501603797
beta1.66992097971060
S.D.2.78947905729845
T-STAT0.59864976413477
p-value0.591592856579925
Lambda-0.669920979710596


Parameters (Session):
par1 = 12 ;
Parameters (R input):
par1 = 12 ;
R code (references can be found in the software module):
par1 <- as.numeric(par1)
(n <- length(x))
(np <- floor(n / par1))
arr <- array(NA,dim=c(par1,np))
j <- 0
k <- 1
for (i in 1:(np*par1))
{
j = j + 1
arr[j,k] <- x[i]
if (j == par1) {
j = 0
k=k+1
}
}
arr
arr.mean <- array(NA,dim=np)
arr.sd <- array(NA,dim=np)
arr.range <- array(NA,dim=np)
for (j in 1:np)
{
arr.mean[j] <- mean(arr[,j],na.rm=TRUE)
arr.sd[j] <- sd(arr[,j],na.rm=TRUE)
arr.range[j] <- max(arr[,j],na.rm=TRUE) - min(arr[j,],na.rm=TRUE)
}
arr.mean
arr.sd
arr.range
(lm1 <- lm(arr.sd~arr.mean))
(lnlm1 <- lm(log(arr.sd)~log(arr.mean)))
(lm2 <- lm(arr.range~arr.mean))
bitmap(file='test1.png')
plot(arr.mean,arr.sd,main='Standard Deviation-Mean Plot',xlab='mean',ylab='standard deviation')
dev.off()
bitmap(file='test2.png')
plot(arr.mean,arr.range,main='Range-Mean Plot',xlab='mean',ylab='range')
dev.off()
load(file='createtable')
a<-table.start()
a<-table.row.start(a)
a<-table.element(a,'Standard Deviation-Mean Plot',4,TRUE)
a<-table.row.end(a)
a<-table.row.start(a)
a<-table.element(a,'Section',header=TRUE)
a<-table.element(a,'Mean',header=TRUE)
a<-table.element(a,'Standard Deviation',header=TRUE)
a<-table.element(a,'Range',header=TRUE)
a<-table.row.end(a)
for (j in 1:np) {
a<-table.row.start(a)
a<-table.element(a,j,header=TRUE)
a<-table.element(a,arr.mean[j])
a<-table.element(a,arr.sd[j] )
a<-table.element(a,arr.range[j] )
a<-table.row.end(a)
}
a<-table.end(a)
table.save(a,file='mytable.tab')
a<-table.start()
a<-table.row.start(a)
a<-table.element(a,'Regression: S.E.(k) = alpha + beta * Mean(k)',2,TRUE)
a<-table.row.end(a)
a<-table.row.start(a)
a<-table.element(a,'alpha',header=TRUE)
a<-table.element(a,lm1$coefficients[[1]])
a<-table.row.end(a)
a<-table.row.start(a)
a<-table.element(a,'beta',header=TRUE)
a<-table.element(a,lm1$coefficients[[2]])
a<-table.row.end(a)
a<-table.row.start(a)
a<-table.element(a,'S.D.',header=TRUE)
a<-table.element(a,summary(lm1)$coefficients[2,2])
a<-table.row.end(a)
a<-table.row.start(a)
a<-table.element(a,'T-STAT',header=TRUE)
a<-table.element(a,summary(lm1)$coefficients[2,3])
a<-table.row.end(a)
a<-table.row.start(a)
a<-table.element(a,'p-value',header=TRUE)
a<-table.element(a,summary(lm1)$coefficients[2,4])
a<-table.row.end(a)
a<-table.end(a)
table.save(a,file='mytable1.tab')
a<-table.start()
a<-table.row.start(a)
a<-table.element(a,'Regression: ln S.E.(k) = alpha + beta * ln Mean(k)',2,TRUE)
a<-table.row.end(a)
a<-table.row.start(a)
a<-table.element(a,'alpha',header=TRUE)
a<-table.element(a,lnlm1$coefficients[[1]])
a<-table.row.end(a)
a<-table.row.start(a)
a<-table.element(a,'beta',header=TRUE)
a<-table.element(a,lnlm1$coefficients[[2]])
a<-table.row.end(a)
a<-table.row.start(a)
a<-table.element(a,'S.D.',header=TRUE)
a<-table.element(a,summary(lnlm1)$coefficients[2,2])
a<-table.row.end(a)
a<-table.row.start(a)
a<-table.element(a,'T-STAT',header=TRUE)
a<-table.element(a,summary(lnlm1)$coefficients[2,3])
a<-table.row.end(a)
a<-table.row.start(a)
a<-table.element(a,'p-value',header=TRUE)
a<-table.element(a,summary(lnlm1)$coefficients[2,4])
a<-table.row.end(a)
a<-table.row.start(a)
a<-table.element(a,'Lambda',header=TRUE)
a<-table.element(a,1-lnlm1$coefficients[[2]])
a<-table.row.end(a)
a<-table.end(a)
table.save(a,file='mytable2.tab')