Free Statistics

of Irreproducible Research!

Author's title

Author*Unverified author*
R Software Modulerwasp_multipleregression.wasp
Title produced by softwareMultiple Regression
Date of computationMon, 26 Nov 2007 16:32:23 -0700
Cite this page as followsStatistical Computations at FreeStatistics.org, Office for Research Development and Education, URL https://freestatistics.org/blog/index.php?v=date/2007/Nov/27/t1196119360kxk0ymvfwkospbg.htm/, Retrieved Sun, 05 May 2024 12:02:59 +0000
Statistical Computations at FreeStatistics.org, Office for Research Development and Education, URL https://freestatistics.org/blog/index.php?pk=6744, Retrieved Sun, 05 May 2024 12:02:59 +0000
QR Codes:

Original text written by user:
IsPrivate?No (this computation is public)
User-defined keywords
Estimated Impact233
Family? (F = Feedback message, R = changed R code, M = changed R Module, P = changed Parameters, D = changed Data)
-       [Multiple Regression] [] [2007-11-26 23:32:23] [1a83104d28786df2e24859e2e02dc234] [Current]
Feedback Forum

Post a new message
Dataseries X:
106.7	97.3	93.5	104.8	124.9
110.2	101	94.7	105.6	132
125.9	113.2	112.9	118.3	151.4
100.1	101	99.2	89.9	108.9
106.4	105.7	105.6	90.2	121.3
114.8	113.9	113	107	123.4
81.3	86.4	83.1	64.5	90.3
87	96.5	81.1	92.6	79.3
104.2	103.3	96.9	95.8	117.2
108	114.9	104.3	94.3	116.9
105	105.8	97.7	91.2	120.8
94.5	94.2	102.6	86.3	96.1
92	98.4	89.9	77.6	100.8
95.9	99.4	96	82.5	105.3
108.8	108.8	112.7	97.7	116.1
103.4	112.6	107.1	83.3	112.8
102.1	104.4	106.2	84.2	114.5
110.1	112.2	121	92.8	117.2
83.2	81.1	101.2	77.4	77.1
82.7	97.1	83.2	72.5	80.1
106.8	112.6	105.1	88.8	120.3
113.7	113.8	113.3	93.4	133.4
102.5	107.8	99.1	92.6	109.4
96.6	103.2	100.3	90.7	93.2
92.1	103.3	93.5	81.6	91.2
95.6	101.2	98.8	84.1	99.2
102.3	107.7	106.2	88.1	108.2
98.6	110.4	98.3	85.3	101.5
98.2	101.9	102.1	82.9	106.9
104.5	115.9	117.1	84.8	104.4
84	89.9	101.5	71.2	77.9
73.8	88.6	80.5	68.9	60
103.9	117.2	105.9	94.3	99.5
106	123.9	109.5	97.6	95
97.2	100	97.2	85.6	105.6
102.6	103.6	114.5	91.9	102.5
89	94.1	93.5	75.8	93.3
93.8	98.7	100.9	79.8	97.3
116.7	119.5	121.1	99	127
106.8	112.7	116.5	88.5	111.7
98.5	104.4	109.3	86.7	96.4
118.7	124.7	118.1	97.9	133
90	89.1	108.3	94.3	72.2
91.9	97	105.4	72.9	95.8
113.3	121.6	116.2	91.8	124.1
113.1	118.8	111.2	93.2	127.6
104.1	114	105.8	86.5	110.7
108.7	111.5	122.7	98.9	104.6
96.7	97.2	99.5	77.2	112.7
101	102.5	107.9	79.4	115.3
116.9	113.4	124.6	90.4	139.4
105.8	109.8	115	81.4	119
99	104.9	110.3	85.8	97.4
129.4	126.1	132.7	103.6	154
83	80	99.7	73.6	81.5
88.9	96.8	96.5	75.7	88.8
115.9	117.2	118.7	99.2	127.7
104.2	112.3	112.9	88.7	105.1
113.4	117.3	130.5	94.6	114.9
112.2	111.1	137.9	98.7	106.4
100.8	102.2	115	84.2	104.5
107.3	104.3	116.8	87.7	121.6
126.6	122.9	140.9	103.3	141.4
102.9	107.6	120.7	88.2	99
117.9	121.3	134.2	93.4	126.7
128.8	131.5	147.3	106.3	134.1
87.5	89	112.4	73.1	81.3
93.8	104.4	107.1	78.6	88.6
122.7	128.9	128.4	101.6	132.7
126.2	135.9	137.7	101.4	132.9
124.6	133.3	135	98.5	134.4
116.7	121.3	151	99	103.7
115.2	120.5	137.4	89.5	119.7
111.1	120.4	132.4	83.5	115
129.9	137.9	161.3	97.4	132.9
113.3	126.1	139.8	87.8	108.5
118.5	133.2	146	90.4	113.9
133.5	146.6	154.6	97.1	142.9
102.1	103.4	142.1	79.4	95.2
102.4	117.2	120.5	85	93


Summary of compuational transaction
Raw Inputview raw input (R code)
Raw Outputview raw output of R engine
Computing time3 seconds
R Server'Gwilym Jenkins' @ 72.249.127.135

\begin{tabular}{lllllllll}
\hline
Summary of compuational transaction \tabularnewline
Raw Input & view raw input (R code)  \tabularnewline
Raw Output & view raw output of R engine  \tabularnewline
Computing time & 3 seconds \tabularnewline
R Server & 'Gwilym Jenkins' @ 72.249.127.135 \tabularnewline
\hline
\end{tabular}
%Source: https://freestatistics.org/blog/index.php?pk=6744&T=0

[TABLE]
[ROW][C]Summary of compuational transaction[/C][/ROW]
[ROW][C]Raw Input[/C][C]view raw input (R code) [/C][/ROW]
[ROW][C]Raw Output[/C][C]view raw output of R engine [/C][/ROW]
[ROW][C]Computing time[/C][C]3 seconds[/C][/ROW]
[ROW][C]R Server[/C][C]'Gwilym Jenkins' @ 72.249.127.135[/C][/ROW]
[/TABLE]
Source: https://freestatistics.org/blog/index.php?pk=6744&T=0

Globally Unique Identifier (entire table): ba.freestatistics.org/blog/index.php?pk=6744&T=0

As an alternative you can also use a QR Code:  

The GUIDs for individual cells are displayed in the table below:

Summary of compuational transaction
Raw Inputview raw input (R code)
Raw Outputview raw output of R engine
Computing time3 seconds
R Server'Gwilym Jenkins' @ 72.249.127.135


Multiple Linear Regression - Estimated Regression Equation
(1-B)Totaal[t] = -0.00166813856920151 + 0.238045611732930`(1-B)prod_metaal`[t] + 0.205463823682829`(1-B)mach_app`[t] + 0.273686165047863`(1-B)elek_app`[t] + 0.283193162946932`(1-B)Metaalverwerking `[t] + e[t]

\begin{tabular}{lllllllll}
\hline
Multiple Linear Regression - Estimated Regression Equation \tabularnewline
(1-B)Totaal[t] =  -0.00166813856920151 +  0.238045611732930`(1-B)prod_metaal`[t] +  0.205463823682829`(1-B)mach_app`[t] +  0.273686165047863`(1-B)elek_app`[t] +  0.283193162946932`(1-B)Metaalverwerking
`[t]  + e[t] \tabularnewline
\hline
\end{tabular}
%Source: https://freestatistics.org/blog/index.php?pk=6744&T=1

[TABLE]
[ROW][C]Multiple Linear Regression - Estimated Regression Equation[/C][/ROW]
[ROW][C](1-B)Totaal[t] =  -0.00166813856920151 +  0.238045611732930`(1-B)prod_metaal`[t] +  0.205463823682829`(1-B)mach_app`[t] +  0.273686165047863`(1-B)elek_app`[t] +  0.283193162946932`(1-B)Metaalverwerking
`[t]  + e[t][/C][/ROW]
[/TABLE]
Source: https://freestatistics.org/blog/index.php?pk=6744&T=1

Globally Unique Identifier (entire table): ba.freestatistics.org/blog/index.php?pk=6744&T=1

As an alternative you can also use a QR Code:  

The GUIDs for individual cells are displayed in the table below:

Multiple Linear Regression - Estimated Regression Equation
(1-B)Totaal[t] = -0.00166813856920151 + 0.238045611732930`(1-B)prod_metaal`[t] + 0.205463823682829`(1-B)mach_app`[t] + 0.273686165047863`(1-B)elek_app`[t] + 0.283193162946932`(1-B)Metaalverwerking `[t] + e[t]


Multiple Linear Regression - Ordinary Least Squares
VariableParameterS.D.T-STATH0: parameter = 02-tail p-value1-tail p-value
(Intercept)-0.001668138569201510.02431-0.06860.9454780.472739
`(1-B)prod_metaal`0.2380456117329300.00334171.247800
`(1-B)mach_app`0.2054638236828290.00298468.856400
`(1-B)elek_app`0.2736861650478630.00361175.783400
`(1-B)Metaalverwerking `0.2831931629469320.001893149.578600

\begin{tabular}{lllllllll}
\hline
Multiple Linear Regression - Ordinary Least Squares \tabularnewline
Variable & Parameter & S.D. & T-STATH0: parameter = 0 & 2-tail p-value & 1-tail p-value \tabularnewline
(Intercept) & -0.00166813856920151 & 0.02431 & -0.0686 & 0.945478 & 0.472739 \tabularnewline
`(1-B)prod_metaal` & 0.238045611732930 & 0.003341 & 71.2478 & 0 & 0 \tabularnewline
`(1-B)mach_app` & 0.205463823682829 & 0.002984 & 68.8564 & 0 & 0 \tabularnewline
`(1-B)elek_app` & 0.273686165047863 & 0.003611 & 75.7834 & 0 & 0 \tabularnewline
`(1-B)Metaalverwerking
` & 0.283193162946932 & 0.001893 & 149.5786 & 0 & 0 \tabularnewline
\hline
\end{tabular}
%Source: https://freestatistics.org/blog/index.php?pk=6744&T=2

[TABLE]
[ROW][C]Multiple Linear Regression - Ordinary Least Squares[/C][/ROW]
[ROW][C]Variable[/C][C]Parameter[/C][C]S.D.[/C][C]T-STATH0: parameter = 0[/C][C]2-tail p-value[/C][C]1-tail p-value[/C][/ROW]
[ROW][C](Intercept)[/C][C]-0.00166813856920151[/C][C]0.02431[/C][C]-0.0686[/C][C]0.945478[/C][C]0.472739[/C][/ROW]
[ROW][C]`(1-B)prod_metaal`[/C][C]0.238045611732930[/C][C]0.003341[/C][C]71.2478[/C][C]0[/C][C]0[/C][/ROW]
[ROW][C]`(1-B)mach_app`[/C][C]0.205463823682829[/C][C]0.002984[/C][C]68.8564[/C][C]0[/C][C]0[/C][/ROW]
[ROW][C]`(1-B)elek_app`[/C][C]0.273686165047863[/C][C]0.003611[/C][C]75.7834[/C][C]0[/C][C]0[/C][/ROW]
[ROW][C]`(1-B)Metaalverwerking
`[/C][C]0.283193162946932[/C][C]0.001893[/C][C]149.5786[/C][C]0[/C][C]0[/C][/ROW]
[/TABLE]
Source: https://freestatistics.org/blog/index.php?pk=6744&T=2

Globally Unique Identifier (entire table): ba.freestatistics.org/blog/index.php?pk=6744&T=2

As an alternative you can also use a QR Code:  

The GUIDs for individual cells are displayed in the table below:

Multiple Linear Regression - Ordinary Least Squares
VariableParameterS.D.T-STATH0: parameter = 02-tail p-value1-tail p-value
(Intercept)-0.001668138569201510.02431-0.06860.9454780.472739
`(1-B)prod_metaal`0.2380456117329300.00334171.247800
`(1-B)mach_app`0.2054638236828290.00298468.856400
`(1-B)elek_app`0.2736861650478630.00361175.783400
`(1-B)Metaalverwerking `0.2831931629469320.001893149.578600


Multiple Linear Regression - Regression Statistics
Multiple R0.999912016818188
R-squared0.999824041377416
Adjusted R-squared0.99981453010052
F-TEST (value)105119.854280796
F-TEST (DF numerator)4
F-TEST (DF denominator)74
p-value0
Multiple Linear Regression - Residual Statistics
Residual Standard Deviation0.214909813310561
Sum Squared Residuals3.41778086143133

\begin{tabular}{lllllllll}
\hline
Multiple Linear Regression - Regression Statistics \tabularnewline
Multiple R & 0.999912016818188 \tabularnewline
R-squared & 0.999824041377416 \tabularnewline
Adjusted R-squared & 0.99981453010052 \tabularnewline
F-TEST (value) & 105119.854280796 \tabularnewline
F-TEST (DF numerator) & 4 \tabularnewline
F-TEST (DF denominator) & 74 \tabularnewline
p-value & 0 \tabularnewline
Multiple Linear Regression - Residual Statistics \tabularnewline
Residual Standard Deviation & 0.214909813310561 \tabularnewline
Sum Squared Residuals & 3.41778086143133 \tabularnewline
\hline
\end{tabular}
%Source: https://freestatistics.org/blog/index.php?pk=6744&T=3

[TABLE]
[ROW][C]Multiple Linear Regression - Regression Statistics[/C][/ROW]
[ROW][C]Multiple R[/C][C]0.999912016818188[/C][/ROW]
[ROW][C]R-squared[/C][C]0.999824041377416[/C][/ROW]
[ROW][C]Adjusted R-squared[/C][C]0.99981453010052[/C][/ROW]
[ROW][C]F-TEST (value)[/C][C]105119.854280796[/C][/ROW]
[ROW][C]F-TEST (DF numerator)[/C][C]4[/C][/ROW]
[ROW][C]F-TEST (DF denominator)[/C][C]74[/C][/ROW]
[ROW][C]p-value[/C][C]0[/C][/ROW]
[ROW][C]Multiple Linear Regression - Residual Statistics[/C][/ROW]
[ROW][C]Residual Standard Deviation[/C][C]0.214909813310561[/C][/ROW]
[ROW][C]Sum Squared Residuals[/C][C]3.41778086143133[/C][/ROW]
[/TABLE]
Source: https://freestatistics.org/blog/index.php?pk=6744&T=3

Globally Unique Identifier (entire table): ba.freestatistics.org/blog/index.php?pk=6744&T=3

As an alternative you can also use a QR Code:  

The GUIDs for individual cells are displayed in the table below:

Multiple Linear Regression - Regression Statistics
Multiple R0.999912016818188
R-squared0.999824041377416
Adjusted R-squared0.99981453010052
F-TEST (value)105119.854280796
F-TEST (DF numerator)4
F-TEST (DF denominator)74
p-value0
Multiple Linear Regression - Residual Statistics
Residual Standard Deviation0.214909813310561
Sum Squared Residuals3.41778086143133


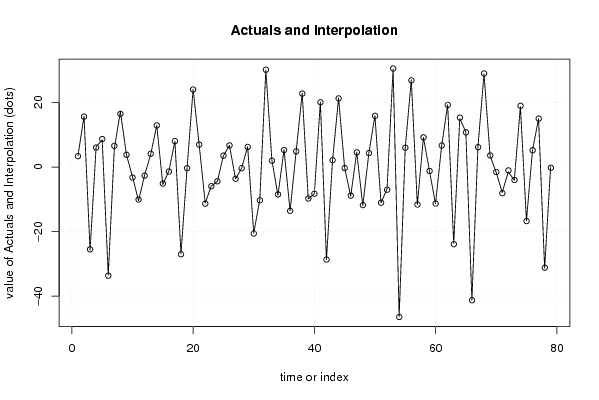
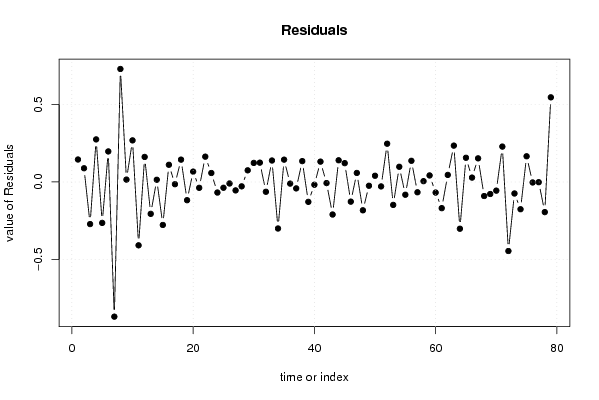
Multiple Linear Regression - Actuals, Interpolation, and Residuals
Time or IndexActualsInterpolationForecastResidualsPrediction Error
13.53.355277602223540.144722397776457
215.715.61169157287850.0883084271215486
3-25.8-25.5290754987697-0.270924501230362
46.300000000000016.025815778201990.274184221798026
58.399999999999998.6633713878864-0.263371387886416
6-33.5-33.6966464974190.196646497419019
75.76.56712133799643-0.867121337996427
817.216.47218703924530.727812960754678
93.83.784606056329860.0153939436701421
10-3-3.267918217800880.267918217800883
11-10.5-10.0921578321491-0.407842167850905
12-2.5-2.661328900128640.161328900128643
133.900000000000014.10513823962471-0.205138239624704
1412.912.88572233577800.0142776642220173
15-5.39999999999999-5.12331044102201-0.276689558977979
16-1.30000000000001-1.410813670540910.110813670540900
1788.01427478282186-0.0142747828218620
18-26.9-27.04388314829240.143883148292443
19-0.5-0.382769897026964-0.117230102973036
2024.124.0331462226920.0668537773079729
216.96.9375767435345-0.037576743534495
22-11.2-11.36311294802760.163112948027624
23-5.9-5.957854317452530.0578543174525227
24-4.5-4.43194800626857-0.0680519937314348
253.53.53715505850575-0.0371550585057534
266.76.70954375966163-0.00954375966162266
27-3.7-3.6458246478631-0.0541753521369029
28-0.399999999999991-0.371897024505795-0.0281029754941960
296.36.224948587157870.0750514128421267
30-20.5-20.62284035582220.122840355822167
31-10.2-10.32450352752160.124503527521591
3230.130.162976007156-0.0629760071560093
332.099999999999991.961702336696370.138297663303627
34-8.8-8.50054974362191-0.299450256378085
355.399999999999995.256144248048340.143855751951654
36-13.6-13.5895661037538-0.0104338962461703
374.84.8412912826344-0.0412912826344004
3822.922.76566113231180.134338867688250
39-9.9-9.77207201338476-0.12792798661524
40-8.3-8.28227673664311-0.0177232633568864
4120.220.06889424041200.131105759588031
42-28.7-28.6930518896990-0.00694811030095195
431.900000000000012.10952181896409-0.209521818964082
4421.421.26029823663820.139701763361758
45-0.200000000000003-0.3211782684542790.121178268454277
46-9-8.87345348239838-0.126546517601619
474.600000000000014.541786604955490.058213395044515
48-12-11.8176062574602-0.182393742539791
494.34.32428150931842-0.0242815093184189
5015.915.85977792737050.0402220726294566
51-11.1-11.0714010577111-0.0285989422889114
52-6.8-7.0465248008130.246524800813001
5330.430.5476352413126-0.147635241312614
54-46.4-46.49796628607910.0979662860791294
555.95.9820649388721-0.0820649388720955
562726.86359814380180.136401856198163
57-11.7-11.6336520290242-0.0663479709757988
589.29.194764587575570.00523541242443354
59-1.20000000000000-1.242147244413120.0421472444131195
60-11.4-11.3319120481223-0.0680879518777552
616.56.6685671927591-0.168567192759104
6219.319.25438719151540.0456128084845846
63-23.7-23.93418643764880.234186437648859
641515.3009370337691-0.300937033769051
6510.910.74415412627650.155845873723524
66-41.3-41.32827376693660.0282737669365489
676.36.147860013874790.152139986125209
6828.928.9904290753924-0.0904290753924138
693.53.57736610339144-0.0773661033914409
70-1.60000000000001-1.54423918723686-0.0557608127631475
71-7.89999999999999-8.1279813203860.227981320386011
72-1.5-1.0553405908458-0.444659409154201
73-4.10000000000001-4.0259166742944-0.0740833257056105
7418.818.9754298821062-0.175429882106217
75-16.6-16.76537892656320.165378926563235
765.25.20315852060602-0.00315852060602154
771515.0014309736061-0.00143097360611348
78-31.4-31.206095355383-0.193904644616997
790.300000000000011-0.2450397224190850.545039722419096
803.7NANA

\begin{tabular}{lllllllll}
\hline
Multiple Linear Regression - Actuals, Interpolation, and Residuals \tabularnewline
Time or Index & Actuals & InterpolationForecast & ResidualsPrediction Error \tabularnewline
1 & 3.5 & 3.35527760222354 & 0.144722397776457 \tabularnewline
2 & 15.7 & 15.6116915728785 & 0.0883084271215486 \tabularnewline
3 & -25.8 & -25.5290754987697 & -0.270924501230362 \tabularnewline
4 & 6.30000000000001 & 6.02581577820199 & 0.274184221798026 \tabularnewline
5 & 8.39999999999999 & 8.6633713878864 & -0.263371387886416 \tabularnewline
6 & -33.5 & -33.696646497419 & 0.196646497419019 \tabularnewline
7 & 5.7 & 6.56712133799643 & -0.867121337996427 \tabularnewline
8 & 17.2 & 16.4721870392453 & 0.727812960754678 \tabularnewline
9 & 3.8 & 3.78460605632986 & 0.0153939436701421 \tabularnewline
10 & -3 & -3.26791821780088 & 0.267918217800883 \tabularnewline
11 & -10.5 & -10.0921578321491 & -0.407842167850905 \tabularnewline
12 & -2.5 & -2.66132890012864 & 0.161328900128643 \tabularnewline
13 & 3.90000000000001 & 4.10513823962471 & -0.205138239624704 \tabularnewline
14 & 12.9 & 12.8857223357780 & 0.0142776642220173 \tabularnewline
15 & -5.39999999999999 & -5.12331044102201 & -0.276689558977979 \tabularnewline
16 & -1.30000000000001 & -1.41081367054091 & 0.110813670540900 \tabularnewline
17 & 8 & 8.01427478282186 & -0.0142747828218620 \tabularnewline
18 & -26.9 & -27.0438831482924 & 0.143883148292443 \tabularnewline
19 & -0.5 & -0.382769897026964 & -0.117230102973036 \tabularnewline
20 & 24.1 & 24.033146222692 & 0.0668537773079729 \tabularnewline
21 & 6.9 & 6.9375767435345 & -0.037576743534495 \tabularnewline
22 & -11.2 & -11.3631129480276 & 0.163112948027624 \tabularnewline
23 & -5.9 & -5.95785431745253 & 0.0578543174525227 \tabularnewline
24 & -4.5 & -4.43194800626857 & -0.0680519937314348 \tabularnewline
25 & 3.5 & 3.53715505850575 & -0.0371550585057534 \tabularnewline
26 & 6.7 & 6.70954375966163 & -0.00954375966162266 \tabularnewline
27 & -3.7 & -3.6458246478631 & -0.0541753521369029 \tabularnewline
28 & -0.399999999999991 & -0.371897024505795 & -0.0281029754941960 \tabularnewline
29 & 6.3 & 6.22494858715787 & 0.0750514128421267 \tabularnewline
30 & -20.5 & -20.6228403558222 & 0.122840355822167 \tabularnewline
31 & -10.2 & -10.3245035275216 & 0.124503527521591 \tabularnewline
32 & 30.1 & 30.162976007156 & -0.0629760071560093 \tabularnewline
33 & 2.09999999999999 & 1.96170233669637 & 0.138297663303627 \tabularnewline
34 & -8.8 & -8.50054974362191 & -0.299450256378085 \tabularnewline
35 & 5.39999999999999 & 5.25614424804834 & 0.143855751951654 \tabularnewline
36 & -13.6 & -13.5895661037538 & -0.0104338962461703 \tabularnewline
37 & 4.8 & 4.8412912826344 & -0.0412912826344004 \tabularnewline
38 & 22.9 & 22.7656611323118 & 0.134338867688250 \tabularnewline
39 & -9.9 & -9.77207201338476 & -0.12792798661524 \tabularnewline
40 & -8.3 & -8.28227673664311 & -0.0177232633568864 \tabularnewline
41 & 20.2 & 20.0688942404120 & 0.131105759588031 \tabularnewline
42 & -28.7 & -28.6930518896990 & -0.00694811030095195 \tabularnewline
43 & 1.90000000000001 & 2.10952181896409 & -0.209521818964082 \tabularnewline
44 & 21.4 & 21.2602982366382 & 0.139701763361758 \tabularnewline
45 & -0.200000000000003 & -0.321178268454279 & 0.121178268454277 \tabularnewline
46 & -9 & -8.87345348239838 & -0.126546517601619 \tabularnewline
47 & 4.60000000000001 & 4.54178660495549 & 0.058213395044515 \tabularnewline
48 & -12 & -11.8176062574602 & -0.182393742539791 \tabularnewline
49 & 4.3 & 4.32428150931842 & -0.0242815093184189 \tabularnewline
50 & 15.9 & 15.8597779273705 & 0.0402220726294566 \tabularnewline
51 & -11.1 & -11.0714010577111 & -0.0285989422889114 \tabularnewline
52 & -6.8 & -7.046524800813 & 0.246524800813001 \tabularnewline
53 & 30.4 & 30.5476352413126 & -0.147635241312614 \tabularnewline
54 & -46.4 & -46.4979662860791 & 0.0979662860791294 \tabularnewline
55 & 5.9 & 5.9820649388721 & -0.0820649388720955 \tabularnewline
56 & 27 & 26.8635981438018 & 0.136401856198163 \tabularnewline
57 & -11.7 & -11.6336520290242 & -0.0663479709757988 \tabularnewline
58 & 9.2 & 9.19476458757557 & 0.00523541242443354 \tabularnewline
59 & -1.20000000000000 & -1.24214724441312 & 0.0421472444131195 \tabularnewline
60 & -11.4 & -11.3319120481223 & -0.0680879518777552 \tabularnewline
61 & 6.5 & 6.6685671927591 & -0.168567192759104 \tabularnewline
62 & 19.3 & 19.2543871915154 & 0.0456128084845846 \tabularnewline
63 & -23.7 & -23.9341864376488 & 0.234186437648859 \tabularnewline
64 & 15 & 15.3009370337691 & -0.300937033769051 \tabularnewline
65 & 10.9 & 10.7441541262765 & 0.155845873723524 \tabularnewline
66 & -41.3 & -41.3282737669366 & 0.0282737669365489 \tabularnewline
67 & 6.3 & 6.14786001387479 & 0.152139986125209 \tabularnewline
68 & 28.9 & 28.9904290753924 & -0.0904290753924138 \tabularnewline
69 & 3.5 & 3.57736610339144 & -0.0773661033914409 \tabularnewline
70 & -1.60000000000001 & -1.54423918723686 & -0.0557608127631475 \tabularnewline
71 & -7.89999999999999 & -8.127981320386 & 0.227981320386011 \tabularnewline
72 & -1.5 & -1.0553405908458 & -0.444659409154201 \tabularnewline
73 & -4.10000000000001 & -4.0259166742944 & -0.0740833257056105 \tabularnewline
74 & 18.8 & 18.9754298821062 & -0.175429882106217 \tabularnewline
75 & -16.6 & -16.7653789265632 & 0.165378926563235 \tabularnewline
76 & 5.2 & 5.20315852060602 & -0.00315852060602154 \tabularnewline
77 & 15 & 15.0014309736061 & -0.00143097360611348 \tabularnewline
78 & -31.4 & -31.206095355383 & -0.193904644616997 \tabularnewline
79 & 0.300000000000011 & -0.245039722419085 & 0.545039722419096 \tabularnewline
80 & 3.7 & NA & NA \tabularnewline
\hline
\end{tabular}
%Source: https://freestatistics.org/blog/index.php?pk=6744&T=4

[TABLE]
[ROW][C]Multiple Linear Regression - Actuals, Interpolation, and Residuals[/C][/ROW]
[ROW][C]Time or Index[/C][C]Actuals[/C][C]InterpolationForecast[/C][C]ResidualsPrediction Error[/C][/ROW]
[ROW][C]1[/C][C]3.5[/C][C]3.35527760222354[/C][C]0.144722397776457[/C][/ROW]
[ROW][C]2[/C][C]15.7[/C][C]15.6116915728785[/C][C]0.0883084271215486[/C][/ROW]
[ROW][C]3[/C][C]-25.8[/C][C]-25.5290754987697[/C][C]-0.270924501230362[/C][/ROW]
[ROW][C]4[/C][C]6.30000000000001[/C][C]6.02581577820199[/C][C]0.274184221798026[/C][/ROW]
[ROW][C]5[/C][C]8.39999999999999[/C][C]8.6633713878864[/C][C]-0.263371387886416[/C][/ROW]
[ROW][C]6[/C][C]-33.5[/C][C]-33.696646497419[/C][C]0.196646497419019[/C][/ROW]
[ROW][C]7[/C][C]5.7[/C][C]6.56712133799643[/C][C]-0.867121337996427[/C][/ROW]
[ROW][C]8[/C][C]17.2[/C][C]16.4721870392453[/C][C]0.727812960754678[/C][/ROW]
[ROW][C]9[/C][C]3.8[/C][C]3.78460605632986[/C][C]0.0153939436701421[/C][/ROW]
[ROW][C]10[/C][C]-3[/C][C]-3.26791821780088[/C][C]0.267918217800883[/C][/ROW]
[ROW][C]11[/C][C]-10.5[/C][C]-10.0921578321491[/C][C]-0.407842167850905[/C][/ROW]
[ROW][C]12[/C][C]-2.5[/C][C]-2.66132890012864[/C][C]0.161328900128643[/C][/ROW]
[ROW][C]13[/C][C]3.90000000000001[/C][C]4.10513823962471[/C][C]-0.205138239624704[/C][/ROW]
[ROW][C]14[/C][C]12.9[/C][C]12.8857223357780[/C][C]0.0142776642220173[/C][/ROW]
[ROW][C]15[/C][C]-5.39999999999999[/C][C]-5.12331044102201[/C][C]-0.276689558977979[/C][/ROW]
[ROW][C]16[/C][C]-1.30000000000001[/C][C]-1.41081367054091[/C][C]0.110813670540900[/C][/ROW]
[ROW][C]17[/C][C]8[/C][C]8.01427478282186[/C][C]-0.0142747828218620[/C][/ROW]
[ROW][C]18[/C][C]-26.9[/C][C]-27.0438831482924[/C][C]0.143883148292443[/C][/ROW]
[ROW][C]19[/C][C]-0.5[/C][C]-0.382769897026964[/C][C]-0.117230102973036[/C][/ROW]
[ROW][C]20[/C][C]24.1[/C][C]24.033146222692[/C][C]0.0668537773079729[/C][/ROW]
[ROW][C]21[/C][C]6.9[/C][C]6.9375767435345[/C][C]-0.037576743534495[/C][/ROW]
[ROW][C]22[/C][C]-11.2[/C][C]-11.3631129480276[/C][C]0.163112948027624[/C][/ROW]
[ROW][C]23[/C][C]-5.9[/C][C]-5.95785431745253[/C][C]0.0578543174525227[/C][/ROW]
[ROW][C]24[/C][C]-4.5[/C][C]-4.43194800626857[/C][C]-0.0680519937314348[/C][/ROW]
[ROW][C]25[/C][C]3.5[/C][C]3.53715505850575[/C][C]-0.0371550585057534[/C][/ROW]
[ROW][C]26[/C][C]6.7[/C][C]6.70954375966163[/C][C]-0.00954375966162266[/C][/ROW]
[ROW][C]27[/C][C]-3.7[/C][C]-3.6458246478631[/C][C]-0.0541753521369029[/C][/ROW]
[ROW][C]28[/C][C]-0.399999999999991[/C][C]-0.371897024505795[/C][C]-0.0281029754941960[/C][/ROW]
[ROW][C]29[/C][C]6.3[/C][C]6.22494858715787[/C][C]0.0750514128421267[/C][/ROW]
[ROW][C]30[/C][C]-20.5[/C][C]-20.6228403558222[/C][C]0.122840355822167[/C][/ROW]
[ROW][C]31[/C][C]-10.2[/C][C]-10.3245035275216[/C][C]0.124503527521591[/C][/ROW]
[ROW][C]32[/C][C]30.1[/C][C]30.162976007156[/C][C]-0.0629760071560093[/C][/ROW]
[ROW][C]33[/C][C]2.09999999999999[/C][C]1.96170233669637[/C][C]0.138297663303627[/C][/ROW]
[ROW][C]34[/C][C]-8.8[/C][C]-8.50054974362191[/C][C]-0.299450256378085[/C][/ROW]
[ROW][C]35[/C][C]5.39999999999999[/C][C]5.25614424804834[/C][C]0.143855751951654[/C][/ROW]
[ROW][C]36[/C][C]-13.6[/C][C]-13.5895661037538[/C][C]-0.0104338962461703[/C][/ROW]
[ROW][C]37[/C][C]4.8[/C][C]4.8412912826344[/C][C]-0.0412912826344004[/C][/ROW]
[ROW][C]38[/C][C]22.9[/C][C]22.7656611323118[/C][C]0.134338867688250[/C][/ROW]
[ROW][C]39[/C][C]-9.9[/C][C]-9.77207201338476[/C][C]-0.12792798661524[/C][/ROW]
[ROW][C]40[/C][C]-8.3[/C][C]-8.28227673664311[/C][C]-0.0177232633568864[/C][/ROW]
[ROW][C]41[/C][C]20.2[/C][C]20.0688942404120[/C][C]0.131105759588031[/C][/ROW]
[ROW][C]42[/C][C]-28.7[/C][C]-28.6930518896990[/C][C]-0.00694811030095195[/C][/ROW]
[ROW][C]43[/C][C]1.90000000000001[/C][C]2.10952181896409[/C][C]-0.209521818964082[/C][/ROW]
[ROW][C]44[/C][C]21.4[/C][C]21.2602982366382[/C][C]0.139701763361758[/C][/ROW]
[ROW][C]45[/C][C]-0.200000000000003[/C][C]-0.321178268454279[/C][C]0.121178268454277[/C][/ROW]
[ROW][C]46[/C][C]-9[/C][C]-8.87345348239838[/C][C]-0.126546517601619[/C][/ROW]
[ROW][C]47[/C][C]4.60000000000001[/C][C]4.54178660495549[/C][C]0.058213395044515[/C][/ROW]
[ROW][C]48[/C][C]-12[/C][C]-11.8176062574602[/C][C]-0.182393742539791[/C][/ROW]
[ROW][C]49[/C][C]4.3[/C][C]4.32428150931842[/C][C]-0.0242815093184189[/C][/ROW]
[ROW][C]50[/C][C]15.9[/C][C]15.8597779273705[/C][C]0.0402220726294566[/C][/ROW]
[ROW][C]51[/C][C]-11.1[/C][C]-11.0714010577111[/C][C]-0.0285989422889114[/C][/ROW]
[ROW][C]52[/C][C]-6.8[/C][C]-7.046524800813[/C][C]0.246524800813001[/C][/ROW]
[ROW][C]53[/C][C]30.4[/C][C]30.5476352413126[/C][C]-0.147635241312614[/C][/ROW]
[ROW][C]54[/C][C]-46.4[/C][C]-46.4979662860791[/C][C]0.0979662860791294[/C][/ROW]
[ROW][C]55[/C][C]5.9[/C][C]5.9820649388721[/C][C]-0.0820649388720955[/C][/ROW]
[ROW][C]56[/C][C]27[/C][C]26.8635981438018[/C][C]0.136401856198163[/C][/ROW]
[ROW][C]57[/C][C]-11.7[/C][C]-11.6336520290242[/C][C]-0.0663479709757988[/C][/ROW]
[ROW][C]58[/C][C]9.2[/C][C]9.19476458757557[/C][C]0.00523541242443354[/C][/ROW]
[ROW][C]59[/C][C]-1.20000000000000[/C][C]-1.24214724441312[/C][C]0.0421472444131195[/C][/ROW]
[ROW][C]60[/C][C]-11.4[/C][C]-11.3319120481223[/C][C]-0.0680879518777552[/C][/ROW]
[ROW][C]61[/C][C]6.5[/C][C]6.6685671927591[/C][C]-0.168567192759104[/C][/ROW]
[ROW][C]62[/C][C]19.3[/C][C]19.2543871915154[/C][C]0.0456128084845846[/C][/ROW]
[ROW][C]63[/C][C]-23.7[/C][C]-23.9341864376488[/C][C]0.234186437648859[/C][/ROW]
[ROW][C]64[/C][C]15[/C][C]15.3009370337691[/C][C]-0.300937033769051[/C][/ROW]
[ROW][C]65[/C][C]10.9[/C][C]10.7441541262765[/C][C]0.155845873723524[/C][/ROW]
[ROW][C]66[/C][C]-41.3[/C][C]-41.3282737669366[/C][C]0.0282737669365489[/C][/ROW]
[ROW][C]67[/C][C]6.3[/C][C]6.14786001387479[/C][C]0.152139986125209[/C][/ROW]
[ROW][C]68[/C][C]28.9[/C][C]28.9904290753924[/C][C]-0.0904290753924138[/C][/ROW]
[ROW][C]69[/C][C]3.5[/C][C]3.57736610339144[/C][C]-0.0773661033914409[/C][/ROW]
[ROW][C]70[/C][C]-1.60000000000001[/C][C]-1.54423918723686[/C][C]-0.0557608127631475[/C][/ROW]
[ROW][C]71[/C][C]-7.89999999999999[/C][C]-8.127981320386[/C][C]0.227981320386011[/C][/ROW]
[ROW][C]72[/C][C]-1.5[/C][C]-1.0553405908458[/C][C]-0.444659409154201[/C][/ROW]
[ROW][C]73[/C][C]-4.10000000000001[/C][C]-4.0259166742944[/C][C]-0.0740833257056105[/C][/ROW]
[ROW][C]74[/C][C]18.8[/C][C]18.9754298821062[/C][C]-0.175429882106217[/C][/ROW]
[ROW][C]75[/C][C]-16.6[/C][C]-16.7653789265632[/C][C]0.165378926563235[/C][/ROW]
[ROW][C]76[/C][C]5.2[/C][C]5.20315852060602[/C][C]-0.00315852060602154[/C][/ROW]
[ROW][C]77[/C][C]15[/C][C]15.0014309736061[/C][C]-0.00143097360611348[/C][/ROW]
[ROW][C]78[/C][C]-31.4[/C][C]-31.206095355383[/C][C]-0.193904644616997[/C][/ROW]
[ROW][C]79[/C][C]0.300000000000011[/C][C]-0.245039722419085[/C][C]0.545039722419096[/C][/ROW]
[ROW][C]80[/C][C]3.7[/C][C]NA[/C][C]NA[/C][/ROW]
[/TABLE]
Source: https://freestatistics.org/blog/index.php?pk=6744&T=4

Globally Unique Identifier (entire table): ba.freestatistics.org/blog/index.php?pk=6744&T=4

As an alternative you can also use a QR Code:  

The GUIDs for individual cells are displayed in the table below:

Multiple Linear Regression - Actuals, Interpolation, and Residuals
Time or IndexActualsInterpolationForecastResidualsPrediction Error
13.53.355277602223540.144722397776457
215.715.61169157287850.0883084271215486
3-25.8-25.5290754987697-0.270924501230362
46.300000000000016.025815778201990.274184221798026
58.399999999999998.6633713878864-0.263371387886416
6-33.5-33.6966464974190.196646497419019
75.76.56712133799643-0.867121337996427
817.216.47218703924530.727812960754678
93.83.784606056329860.0153939436701421
10-3-3.267918217800880.267918217800883
11-10.5-10.0921578321491-0.407842167850905
12-2.5-2.661328900128640.161328900128643
133.900000000000014.10513823962471-0.205138239624704
1412.912.88572233577800.0142776642220173
15-5.39999999999999-5.12331044102201-0.276689558977979
16-1.30000000000001-1.410813670540910.110813670540900
1788.01427478282186-0.0142747828218620
18-26.9-27.04388314829240.143883148292443
19-0.5-0.382769897026964-0.117230102973036
2024.124.0331462226920.0668537773079729
216.96.9375767435345-0.037576743534495
22-11.2-11.36311294802760.163112948027624
23-5.9-5.957854317452530.0578543174525227
24-4.5-4.43194800626857-0.0680519937314348
253.53.53715505850575-0.0371550585057534
266.76.70954375966163-0.00954375966162266
27-3.7-3.6458246478631-0.0541753521369029
28-0.399999999999991-0.371897024505795-0.0281029754941960
296.36.224948587157870.0750514128421267
30-20.5-20.62284035582220.122840355822167
31-10.2-10.32450352752160.124503527521591
3230.130.162976007156-0.0629760071560093
332.099999999999991.961702336696370.138297663303627
34-8.8-8.50054974362191-0.299450256378085
355.399999999999995.256144248048340.143855751951654
36-13.6-13.5895661037538-0.0104338962461703
374.84.8412912826344-0.0412912826344004
3822.922.76566113231180.134338867688250
39-9.9-9.77207201338476-0.12792798661524
40-8.3-8.28227673664311-0.0177232633568864
4120.220.06889424041200.131105759588031
42-28.7-28.6930518896990-0.00694811030095195
431.900000000000012.10952181896409-0.209521818964082
4421.421.26029823663820.139701763361758
45-0.200000000000003-0.3211782684542790.121178268454277
46-9-8.87345348239838-0.126546517601619
474.600000000000014.541786604955490.058213395044515
48-12-11.8176062574602-0.182393742539791
494.34.32428150931842-0.0242815093184189
5015.915.85977792737050.0402220726294566
51-11.1-11.0714010577111-0.0285989422889114
52-6.8-7.0465248008130.246524800813001
5330.430.5476352413126-0.147635241312614
54-46.4-46.49796628607910.0979662860791294
555.95.9820649388721-0.0820649388720955
562726.86359814380180.136401856198163
57-11.7-11.6336520290242-0.0663479709757988
589.29.194764587575570.00523541242443354
59-1.20000000000000-1.242147244413120.0421472444131195
60-11.4-11.3319120481223-0.0680879518777552
616.56.6685671927591-0.168567192759104
6219.319.25438719151540.0456128084845846
63-23.7-23.93418643764880.234186437648859
641515.3009370337691-0.300937033769051
6510.910.74415412627650.155845873723524
66-41.3-41.32827376693660.0282737669365489
676.36.147860013874790.152139986125209
6828.928.9904290753924-0.0904290753924138
693.53.57736610339144-0.0773661033914409
70-1.60000000000001-1.54423918723686-0.0557608127631475
71-7.89999999999999-8.1279813203860.227981320386011
72-1.5-1.0553405908458-0.444659409154201
73-4.10000000000001-4.0259166742944-0.0740833257056105
7418.818.9754298821062-0.175429882106217
75-16.6-16.76537892656320.165378926563235
765.25.20315852060602-0.00315852060602154
771515.0014309736061-0.00143097360611348
78-31.4-31.206095355383-0.193904644616997
790.300000000000011-0.2450397224190850.545039722419096
803.7NANA


Parameters (Session):
par1 = 1 ; par2 = Do not include Seasonal Dummies ; par3 = First Differences ;
Parameters (R input):
par1 = 1 ; par2 = Do not include Seasonal Dummies ; par3 = First Differences ;
R code (references can be found in the software module):
library(lattice)
par1 <- as.numeric(par1)
x <- t(y)
k <- length(x[1,])
n <- length(x[,1])
x1 <- cbind(x[,par1], x[,1:k!=par1])
mycolnames <- c(colnames(x)[par1], colnames(x)[1:k!=par1])
colnames(x1) <- mycolnames #colnames(x)[par1]
x <- x1
if (par3 == 'First Differences'){
x2 <- array(0, dim=c(n-1,k), dimnames=list(1:(n-1), paste('(1-B)',colnames(x),sep='')))
for (i in 1:n-1) {
for (j in 1:k) {
x2[i,j] <- x[i+1,j] - x[i,j]
}
}
x <- x2
}
if (par2 == 'Include Monthly Dummies'){
x2 <- array(0, dim=c(n,11), dimnames=list(1:n, paste('M', seq(1:11), sep ='')))
for (i in 1:11){
x2[seq(i,n,12),i] <- 1
}
x <- cbind(x, x2)
}
if (par2 == 'Include Quarterly Dummies'){
x2 <- array(0, dim=c(n,3), dimnames=list(1:n, paste('Q', seq(1:3), sep ='')))
for (i in 1:3){
x2[seq(i,n,4),i] <- 1
}
x <- cbind(x, x2)
}
k <- length(x[1,])
if (par3 == 'Linear Trend'){
x <- cbind(x, c(1:n))
colnames(x)[k+1] <- 't'
}
x
k <- length(x[1,])
df <- as.data.frame(x)
(mylm <- lm(df))
(mysum <- summary(mylm))
bitmap(file='test0.png')
plot(x[,1], type='l', main='Actuals and Interpolation', ylab='value of Actuals and Interpolation (dots)', xlab='time or index')
points(x[,1]-mysum$resid)
grid()
dev.off()
bitmap(file='test1.png')
plot(mysum$resid, type='b', pch=19, main='Residuals', ylab='value of Residuals', xlab='time or index')
grid()
dev.off()
bitmap(file='test2.png')
hist(mysum$resid, main='Residual Histogram', xlab='values of Residuals')
grid()
dev.off()
bitmap(file='test3.png')
densityplot(~mysum$resid,col='black',main='Residual Density Plot', xlab='values of Residuals')
dev.off()
bitmap(file='test4.png')
qqnorm(mysum$resid, main='Residual Normal Q-Q Plot')
grid()
dev.off()
(myerror <- as.ts(mysum$resid))
bitmap(file='test5.png')
dum <- cbind(lag(myerror,k=1),myerror)
dum
dum1 <- dum[2:length(myerror),]
dum1
z <- as.data.frame(dum1)
z
plot(z,main=paste('Residual Lag plot, lowess, and regression line'), ylab='values of Residuals', xlab='lagged values of Residuals')
lines(lowess(z))
abline(lm(z))
grid()
dev.off()
bitmap(file='test6.png')
acf(mysum$resid, lag.max=length(mysum$resid)/2, main='Residual Autocorrelation Function')
grid()
dev.off()
bitmap(file='test7.png')
pacf(mysum$resid, lag.max=length(mysum$resid)/2, main='Residual Partial Autocorrelation Function')
grid()
dev.off()
bitmap(file='test8.png')
opar <- par(mfrow = c(2,2), oma = c(0, 0, 1.1, 0))
plot(mylm, las = 1, sub='Residual Diagnostics')
par(opar)
dev.off()
load(file='createtable')
a<-table.start()
a<-table.row.start(a)
a<-table.element(a, 'Multiple Linear Regression - Estimated Regression Equation', 1, TRUE)
a<-table.row.end(a)
myeq <- colnames(x)[1]
myeq <- paste(myeq, '[t] = ', sep='')
for (i in 1:k){
if (mysum$coefficients[i,1] > 0) myeq <- paste(myeq, '+', '')
myeq <- paste(myeq, mysum$coefficients[i,1], sep=' ')
if (rownames(mysum$coefficients)[i] != '(Intercept)') {
myeq <- paste(myeq, rownames(mysum$coefficients)[i], sep='')
if (rownames(mysum$coefficients)[i] != 't') myeq <- paste(myeq, '[t]', sep='')
}
}
myeq <- paste(myeq, ' + e[t]')
a<-table.row.start(a)
a<-table.element(a, myeq)
a<-table.row.end(a)
a<-table.end(a)
table.save(a,file='mytable1.tab')
a<-table.start()
a<-table.row.start(a)
a<-table.element(a,hyperlink('ols1.htm','Multiple Linear Regression - Ordinary Least Squares',''), 6, TRUE)
a<-table.row.end(a)
a<-table.row.start(a)
a<-table.element(a,'Variable',header=TRUE)
a<-table.element(a,'Parameter',header=TRUE)
a<-table.element(a,'S.D.',header=TRUE)
a<-table.element(a,'T-STAT
H0: parameter = 0',header=TRUE)
a<-table.element(a,'2-tail p-value',header=TRUE)
a<-table.element(a,'1-tail p-value',header=TRUE)
a<-table.row.end(a)
for (i in 1:k){
a<-table.row.start(a)
a<-table.element(a,rownames(mysum$coefficients)[i],header=TRUE)
a<-table.element(a,mysum$coefficients[i,1])
a<-table.element(a, round(mysum$coefficients[i,2],6))
a<-table.element(a, round(mysum$coefficients[i,3],4))
a<-table.element(a, round(mysum$coefficients[i,4],6))
a<-table.element(a, round(mysum$coefficients[i,4]/2,6))
a<-table.row.end(a)
}
a<-table.end(a)
table.save(a,file='mytable2.tab')
a<-table.start()
a<-table.row.start(a)
a<-table.element(a, 'Multiple Linear Regression - Regression Statistics', 2, TRUE)
a<-table.row.end(a)
a<-table.row.start(a)
a<-table.element(a, 'Multiple R',1,TRUE)
a<-table.element(a, sqrt(mysum$r.squared))
a<-table.row.end(a)
a<-table.row.start(a)
a<-table.element(a, 'R-squared',1,TRUE)
a<-table.element(a, mysum$r.squared)
a<-table.row.end(a)
a<-table.row.start(a)
a<-table.element(a, 'Adjusted R-squared',1,TRUE)
a<-table.element(a, mysum$adj.r.squared)
a<-table.row.end(a)
a<-table.row.start(a)
a<-table.element(a, 'F-TEST (value)',1,TRUE)
a<-table.element(a, mysum$fstatistic[1])
a<-table.row.end(a)
a<-table.row.start(a)
a<-table.element(a, 'F-TEST (DF numerator)',1,TRUE)
a<-table.element(a, mysum$fstatistic[2])
a<-table.row.end(a)
a<-table.row.start(a)
a<-table.element(a, 'F-TEST (DF denominator)',1,TRUE)
a<-table.element(a, mysum$fstatistic[3])
a<-table.row.end(a)
a<-table.row.start(a)
a<-table.element(a, 'p-value',1,TRUE)
a<-table.element(a, 1-pf(mysum$fstatistic[1],mysum$fstatistic[2],mysum$fstatistic[3]))
a<-table.row.end(a)
a<-table.row.start(a)
a<-table.element(a, 'Multiple Linear Regression - Residual Statistics', 2, TRUE)
a<-table.row.end(a)
a<-table.row.start(a)
a<-table.element(a, 'Residual Standard Deviation',1,TRUE)
a<-table.element(a, mysum$sigma)
a<-table.row.end(a)
a<-table.row.start(a)
a<-table.element(a, 'Sum Squared Residuals',1,TRUE)
a<-table.element(a, sum(myerror*myerror))
a<-table.row.end(a)
a<-table.end(a)
table.save(a,file='mytable3.tab')
a<-table.start()
a<-table.row.start(a)
a<-table.element(a, 'Multiple Linear Regression - Actuals, Interpolation, and Residuals', 4, TRUE)
a<-table.row.end(a)
a<-table.row.start(a)
a<-table.element(a, 'Time or Index', 1, TRUE)
a<-table.element(a, 'Actuals', 1, TRUE)
a<-table.element(a, 'Interpolation
Forecast', 1, TRUE)
a<-table.element(a, 'Residuals
Prediction Error', 1, TRUE)
a<-table.row.end(a)
for (i in 1:n) {
a<-table.row.start(a)
a<-table.element(a,i, 1, TRUE)
a<-table.element(a,x[i])
a<-table.element(a,x[i]-mysum$resid[i])
a<-table.element(a,mysum$resid[i])
a<-table.row.end(a)
}
a<-table.end(a)
table.save(a,file='mytable4.tab')