Free Statistics

of Irreproducible Research!

Author's title

Author*Unverified author*
R Software Modulerwasp_autocorrelation.wasp
Title produced by software(Partial) Autocorrelation Function
Date of computationMon, 26 Nov 2007 16:27:54 -0700
Cite this page as followsStatistical Computations at FreeStatistics.org, Office for Research Development and Education, URL https://freestatistics.org/blog/index.php?v=date/2007/Nov/27/t11961190867kymnv1ssaqfnyh.htm/, Retrieved Sun, 05 May 2024 17:00:40 +0000
Statistical Computations at FreeStatistics.org, Office for Research Development and Education, URL https://freestatistics.org/blog/index.php?pk=6741, Retrieved Sun, 05 May 2024 17:00:40 +0000
QR Codes:

Original text written by user:
IsPrivate?No (this computation is public)
User-defined keywords
Estimated Impact210
Family? (F = Feedback message, R = changed R code, M = changed R Module, P = changed Parameters, D = changed Data)
-       [(Partial) Autocorrelation Function] [Inducing Stationa...] [2007-11-26 23:27:54] [640491d00f3c9cca22cbf779aa38ac16] [Current]
Feedback Forum

Post a new message
Dataseries X:
100.80
100.80
100.80
90.10
95.70
88.60
93.30
93.30
93.30
93.30
93.30
93.30
88.60
97.40
97.40
102.90
102.90
102.90
105.10
105.10
105.10
105.10
105.10
105.10
96.90
96.90
96.90
96.90
96.90
96.90
96.50
96.50
96.50
96.00
96.00
96.00
96.00
96.00
96.00
105.80
105.80
105.80
105.80
105.80
105.80
105.80
105.80
105.80
123.60
142.20
142.20
141.20
141.20
141.20
124.70
124.70
124.70
122.70
122.70
122.70
123.30
123.30
123.30
127.20
127.20
127.20
140.00
140.00
140.00
140.00
140.00
140.00
139.00
139.00
139.00
147.00
147.00
147.00
147.10
147.10


Summary of compuational transaction
Raw Inputview raw input (R code)
Raw Outputview raw output of R engine
Computing time2 seconds
R Server'Gwilym Jenkins' @ 72.249.127.135

\begin{tabular}{lllllllll}
\hline
Summary of compuational transaction \tabularnewline
Raw Input & view raw input (R code)  \tabularnewline
Raw Output & view raw output of R engine  \tabularnewline
Computing time & 2 seconds \tabularnewline
R Server & 'Gwilym Jenkins' @ 72.249.127.135 \tabularnewline
\hline
\end{tabular}
%Source: https://freestatistics.org/blog/index.php?pk=6741&T=0

[TABLE]
[ROW][C]Summary of compuational transaction[/C][/ROW]
[ROW][C]Raw Input[/C][C]view raw input (R code) [/C][/ROW]
[ROW][C]Raw Output[/C][C]view raw output of R engine [/C][/ROW]
[ROW][C]Computing time[/C][C]2 seconds[/C][/ROW]
[ROW][C]R Server[/C][C]'Gwilym Jenkins' @ 72.249.127.135[/C][/ROW]
[/TABLE]
Source: https://freestatistics.org/blog/index.php?pk=6741&T=0

Globally Unique Identifier (entire table): ba.freestatistics.org/blog/index.php?pk=6741&T=0

As an alternative you can also use a QR Code:  

The GUIDs for individual cells are displayed in the table below:

Summary of compuational transaction
Raw Inputview raw input (R code)
Raw Outputview raw output of R engine
Computing time2 seconds
R Server'Gwilym Jenkins' @ 72.249.127.135


Autocorrelation Function
Time lag kACF(k)T-STATP-value
018.94430
10.948778.48610
20.8968218.02140
30.837337.48930
40.7736396.91960
50.7129676.3770
60.6630945.93090
70.6283185.61990
80.5893035.27091e-06
90.5554094.96772e-06
100.5109164.56989e-06
110.4670124.17713.7e-05
120.4248743.80020.00014
130.3855193.44820.000451
140.3516843.14560.001164
150.327662.93070.002204
160.315422.82120.003016
170.3035272.71480.00406
180.2894642.5890.005715

\begin{tabular}{lllllllll}
\hline
Autocorrelation Function \tabularnewline
Time lag k & ACF(k) & T-STAT & P-value \tabularnewline
0 & 1 & 8.9443 & 0 \tabularnewline
1 & 0.94877 & 8.4861 & 0 \tabularnewline
2 & 0.896821 & 8.0214 & 0 \tabularnewline
3 & 0.83733 & 7.4893 & 0 \tabularnewline
4 & 0.773639 & 6.9196 & 0 \tabularnewline
5 & 0.712967 & 6.377 & 0 \tabularnewline
6 & 0.663094 & 5.9309 & 0 \tabularnewline
7 & 0.628318 & 5.6199 & 0 \tabularnewline
8 & 0.589303 & 5.2709 & 1e-06 \tabularnewline
9 & 0.555409 & 4.9677 & 2e-06 \tabularnewline
10 & 0.510916 & 4.5698 & 9e-06 \tabularnewline
11 & 0.467012 & 4.1771 & 3.7e-05 \tabularnewline
12 & 0.424874 & 3.8002 & 0.00014 \tabularnewline
13 & 0.385519 & 3.4482 & 0.000451 \tabularnewline
14 & 0.351684 & 3.1456 & 0.001164 \tabularnewline
15 & 0.32766 & 2.9307 & 0.002204 \tabularnewline
16 & 0.31542 & 2.8212 & 0.003016 \tabularnewline
17 & 0.303527 & 2.7148 & 0.00406 \tabularnewline
18 & 0.289464 & 2.589 & 0.005715 \tabularnewline
\hline
\end{tabular}
%Source: https://freestatistics.org/blog/index.php?pk=6741&T=1

[TABLE]
[ROW][C]Autocorrelation Function[/C][/ROW]
[ROW][C]Time lag k[/C][C]ACF(k)[/C][C]T-STAT[/C][C]P-value[/C][/ROW]
[ROW][C]0[/C][C]1[/C][C]8.9443[/C][C]0[/C][/ROW]
[ROW][C]1[/C][C]0.94877[/C][C]8.4861[/C][C]0[/C][/ROW]
[ROW][C]2[/C][C]0.896821[/C][C]8.0214[/C][C]0[/C][/ROW]
[ROW][C]3[/C][C]0.83733[/C][C]7.4893[/C][C]0[/C][/ROW]
[ROW][C]4[/C][C]0.773639[/C][C]6.9196[/C][C]0[/C][/ROW]
[ROW][C]5[/C][C]0.712967[/C][C]6.377[/C][C]0[/C][/ROW]
[ROW][C]6[/C][C]0.663094[/C][C]5.9309[/C][C]0[/C][/ROW]
[ROW][C]7[/C][C]0.628318[/C][C]5.6199[/C][C]0[/C][/ROW]
[ROW][C]8[/C][C]0.589303[/C][C]5.2709[/C][C]1e-06[/C][/ROW]
[ROW][C]9[/C][C]0.555409[/C][C]4.9677[/C][C]2e-06[/C][/ROW]
[ROW][C]10[/C][C]0.510916[/C][C]4.5698[/C][C]9e-06[/C][/ROW]
[ROW][C]11[/C][C]0.467012[/C][C]4.1771[/C][C]3.7e-05[/C][/ROW]
[ROW][C]12[/C][C]0.424874[/C][C]3.8002[/C][C]0.00014[/C][/ROW]
[ROW][C]13[/C][C]0.385519[/C][C]3.4482[/C][C]0.000451[/C][/ROW]
[ROW][C]14[/C][C]0.351684[/C][C]3.1456[/C][C]0.001164[/C][/ROW]
[ROW][C]15[/C][C]0.32766[/C][C]2.9307[/C][C]0.002204[/C][/ROW]
[ROW][C]16[/C][C]0.31542[/C][C]2.8212[/C][C]0.003016[/C][/ROW]
[ROW][C]17[/C][C]0.303527[/C][C]2.7148[/C][C]0.00406[/C][/ROW]
[ROW][C]18[/C][C]0.289464[/C][C]2.589[/C][C]0.005715[/C][/ROW]
[/TABLE]
Source: https://freestatistics.org/blog/index.php?pk=6741&T=1

Globally Unique Identifier (entire table): ba.freestatistics.org/blog/index.php?pk=6741&T=1

As an alternative you can also use a QR Code:  

The GUIDs for individual cells are displayed in the table below:

Autocorrelation Function
Time lag kACF(k)T-STATP-value
018.94430
10.948778.48610
20.8968218.02140
30.837337.48930
40.7736396.91960
50.7129676.3770
60.6630945.93090
70.6283185.61990
80.5893035.27091e-06
90.5554094.96772e-06
100.5109164.56989e-06
110.4670124.17713.7e-05
120.4248743.80020.00014
130.3855193.44820.000451
140.3516843.14560.001164
150.327662.93070.002204
160.315422.82120.003016
170.3035272.71480.00406
180.2894642.5890.005715


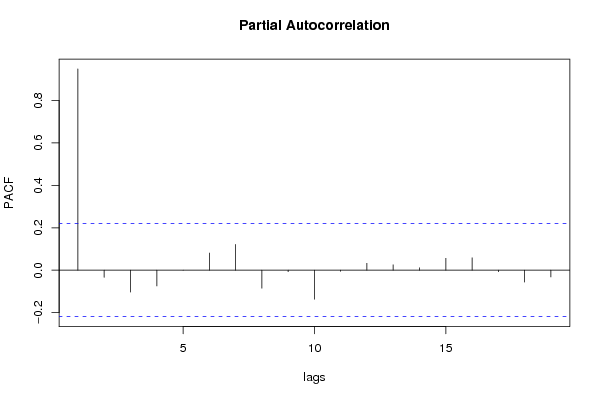
Partial Autocorrelation Function
Time lag kPACF(k)T-STATP-value
00.948778.48610
1-0.033486-0.29950.617336
2-0.102965-0.92090.820075
3-0.074321-0.66470.745938
41.7e-051e-040.499941
50.0804660.71970.236901
60.1216381.0880.13994
7-0.085057-0.76080.775486
8-0.007206-0.06450.525616
9-0.136495-1.22080.887135
10-0.005593-0.050.519887
110.032290.28880.386737
120.0255890.22890.409775
130.0114080.1020.459493
140.0558530.49960.309375
150.0583910.52230.301464
16-0.006835-0.06110.524297
17-0.055789-0.4990.690423
18-0.032014-0.28630.612323

\begin{tabular}{lllllllll}
\hline
Partial Autocorrelation Function \tabularnewline
Time lag k & PACF(k) & T-STAT & P-value \tabularnewline
0 & 0.94877 & 8.4861 & 0 \tabularnewline
1 & -0.033486 & -0.2995 & 0.617336 \tabularnewline
2 & -0.102965 & -0.9209 & 0.820075 \tabularnewline
3 & -0.074321 & -0.6647 & 0.745938 \tabularnewline
4 & 1.7e-05 & 1e-04 & 0.499941 \tabularnewline
5 & 0.080466 & 0.7197 & 0.236901 \tabularnewline
6 & 0.121638 & 1.088 & 0.13994 \tabularnewline
7 & -0.085057 & -0.7608 & 0.775486 \tabularnewline
8 & -0.007206 & -0.0645 & 0.525616 \tabularnewline
9 & -0.136495 & -1.2208 & 0.887135 \tabularnewline
10 & -0.005593 & -0.05 & 0.519887 \tabularnewline
11 & 0.03229 & 0.2888 & 0.386737 \tabularnewline
12 & 0.025589 & 0.2289 & 0.409775 \tabularnewline
13 & 0.011408 & 0.102 & 0.459493 \tabularnewline
14 & 0.055853 & 0.4996 & 0.309375 \tabularnewline
15 & 0.058391 & 0.5223 & 0.301464 \tabularnewline
16 & -0.006835 & -0.0611 & 0.524297 \tabularnewline
17 & -0.055789 & -0.499 & 0.690423 \tabularnewline
18 & -0.032014 & -0.2863 & 0.612323 \tabularnewline
\hline
\end{tabular}
%Source: https://freestatistics.org/blog/index.php?pk=6741&T=2

[TABLE]
[ROW][C]Partial Autocorrelation Function[/C][/ROW]
[ROW][C]Time lag k[/C][C]PACF(k)[/C][C]T-STAT[/C][C]P-value[/C][/ROW]
[ROW][C]0[/C][C]0.94877[/C][C]8.4861[/C][C]0[/C][/ROW]
[ROW][C]1[/C][C]-0.033486[/C][C]-0.2995[/C][C]0.617336[/C][/ROW]
[ROW][C]2[/C][C]-0.102965[/C][C]-0.9209[/C][C]0.820075[/C][/ROW]
[ROW][C]3[/C][C]-0.074321[/C][C]-0.6647[/C][C]0.745938[/C][/ROW]
[ROW][C]4[/C][C]1.7e-05[/C][C]1e-04[/C][C]0.499941[/C][/ROW]
[ROW][C]5[/C][C]0.080466[/C][C]0.7197[/C][C]0.236901[/C][/ROW]
[ROW][C]6[/C][C]0.121638[/C][C]1.088[/C][C]0.13994[/C][/ROW]
[ROW][C]7[/C][C]-0.085057[/C][C]-0.7608[/C][C]0.775486[/C][/ROW]
[ROW][C]8[/C][C]-0.007206[/C][C]-0.0645[/C][C]0.525616[/C][/ROW]
[ROW][C]9[/C][C]-0.136495[/C][C]-1.2208[/C][C]0.887135[/C][/ROW]
[ROW][C]10[/C][C]-0.005593[/C][C]-0.05[/C][C]0.519887[/C][/ROW]
[ROW][C]11[/C][C]0.03229[/C][C]0.2888[/C][C]0.386737[/C][/ROW]
[ROW][C]12[/C][C]0.025589[/C][C]0.2289[/C][C]0.409775[/C][/ROW]
[ROW][C]13[/C][C]0.011408[/C][C]0.102[/C][C]0.459493[/C][/ROW]
[ROW][C]14[/C][C]0.055853[/C][C]0.4996[/C][C]0.309375[/C][/ROW]
[ROW][C]15[/C][C]0.058391[/C][C]0.5223[/C][C]0.301464[/C][/ROW]
[ROW][C]16[/C][C]-0.006835[/C][C]-0.0611[/C][C]0.524297[/C][/ROW]
[ROW][C]17[/C][C]-0.055789[/C][C]-0.499[/C][C]0.690423[/C][/ROW]
[ROW][C]18[/C][C]-0.032014[/C][C]-0.2863[/C][C]0.612323[/C][/ROW]
[/TABLE]
Source: https://freestatistics.org/blog/index.php?pk=6741&T=2

Globally Unique Identifier (entire table): ba.freestatistics.org/blog/index.php?pk=6741&T=2

As an alternative you can also use a QR Code:  

The GUIDs for individual cells are displayed in the table below:

Partial Autocorrelation Function
Time lag kPACF(k)T-STATP-value
00.948778.48610
1-0.033486-0.29950.617336
2-0.102965-0.92090.820075
3-0.074321-0.66470.745938
41.7e-051e-040.499941
50.0804660.71970.236901
60.1216381.0880.13994
7-0.085057-0.76080.775486
8-0.007206-0.06450.525616
9-0.136495-1.22080.887135
10-0.005593-0.050.519887
110.032290.28880.386737
120.0255890.22890.409775
130.0114080.1020.459493
140.0558530.49960.309375
150.0583910.52230.301464
16-0.006835-0.06110.524297
17-0.055789-0.4990.690423
18-0.032014-0.28630.612323


Parameters (Session):
par1 = 12 ;
Parameters (R input):
par1 = Default ; par2 = 0.0 ; par3 = 0 ; par4 = 0 ; par5 = 12 ;
R code (references can be found in the software module):
if (par1 == 'Default') {
par1 = 10*log10(length(x))
} else {
par1 <- as.numeric(par1)
}
par2 <- as.numeric(par2)
par3 <- as.numeric(par3)
par4 <- as.numeric(par4)
par5 <- as.numeric(par5)
if (par2 == 0) {
x <- log(x)
} else {
x <- (x ^ par2 - 1) / par2
}
if (par3 > 0) x <- diff(x,lag=1,difference=par3)
if (par4 > 0) x <- diff(x,lag=par5,difference=par4)
bitmap(file='pic1.png')
racf <- acf(x,par1,main='Autocorrelation',xlab='lags',ylab='ACF')
dev.off()
bitmap(file='pic2.png')
rpacf <- pacf(x,par1,main='Partial Autocorrelation',xlab='lags',ylab='PACF')
dev.off()
(myacf <- c(racf$acf))
(mypacf <- c(rpacf$acf))
lengthx <- length(x)
sqrtn <- sqrt(lengthx)
load(file='createtable')
a<-table.start()
a<-table.row.start(a)
a<-table.element(a,'Autocorrelation Function',4,TRUE)
a<-table.row.end(a)
a<-table.row.start(a)
a<-table.element(a,'Time lag k',header=TRUE)
a<-table.element(a,hyperlink('basics.htm','ACF(k)','click here for more information about the Autocorrelation Function'),header=TRUE)
a<-table.element(a,'T-STAT',header=TRUE)
a<-table.element(a,'P-value',header=TRUE)
a<-table.row.end(a)
for (i in 1:par1) {
a<-table.row.start(a)
a<-table.element(a,i-1,header=TRUE)
a<-table.element(a,round(myacf[i],6))
mytstat <- myacf[i]*sqrtn
a<-table.element(a,round(mytstat,4))
a<-table.element(a,round(1-pt(mytstat,lengthx),6))
a<-table.row.end(a)
}
a<-table.end(a)
table.save(a,file='mytable.tab')
a<-table.start()
a<-table.row.start(a)
a<-table.element(a,'Partial Autocorrelation Function',4,TRUE)
a<-table.row.end(a)
a<-table.row.start(a)
a<-table.element(a,'Time lag k',header=TRUE)
a<-table.element(a,hyperlink('basics.htm','PACF(k)','click here for more information about the Partial Autocorrelation Function'),header=TRUE)
a<-table.element(a,'T-STAT',header=TRUE)
a<-table.element(a,'P-value',header=TRUE)
a<-table.row.end(a)
for (i in 1:par1) {
a<-table.row.start(a)
a<-table.element(a,i-1,header=TRUE)
a<-table.element(a,round(mypacf[i],6))
mytstat <- mypacf[i]*sqrtn
a<-table.element(a,round(mytstat,4))
a<-table.element(a,round(1-pt(mytstat,lengthx),6))
a<-table.row.end(a)
}
a<-table.end(a)
table.save(a,file='mytable1.tab')