Free Statistics

of Irreproducible Research!

Author's title

Author*Unverified author*
R Software Modulerwasp_cross.wasp
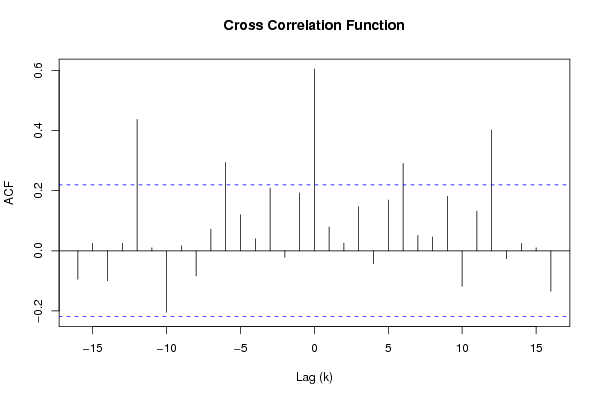
Title produced by softwareCross Correlation Function
Date of computationSun, 25 Nov 2007 11:04:51 -0700
Cite this page as followsStatistical Computations at FreeStatistics.org, Office for Research Development and Education, URL https://freestatistics.org/blog/index.php?v=date/2007/Nov/25/t1196013450ywz2eso9xxbxuhi.htm/, Retrieved Sat, 04 May 2024 10:59:38 +0000
Statistical Computations at FreeStatistics.org, Office for Research Development and Education, URL https://freestatistics.org/blog/index.php?pk=6512, Retrieved Sat, 04 May 2024 10:59:38 +0000
QR Codes:

Original text written by user:
IsPrivate?No (this computation is public)
User-defined keywordscross correlation
Estimated Impact170
Family? (F = Feedback message, R = changed R code, M = changed R Module, P = changed Parameters, D = changed Data)
-       [Cross Correlation Function] [workshop 7Q5] [2007-11-25 18:04:51] [676e67eebaa0fa2a5b563d138d4b447b] [Current]
Feedback Forum

Post a new message
Dataseries X:
100.6
96.1
110
108.2
106.9
117.2
105.2
106.3
95.9
107.5
113
111.4
95.5
90.3
110.8
107.1
101.4
112.9
98.5
100.1
93.4
104.4
101.8
107.9
91.3
86.6
111.4
98.4
102.2
103
95.8
96
95.7
106.4
112
116.2
93.9
100.5
112.5
101.2
107.8
114.3
99.6
98.6
93.6
99.6
113.1
110.7
88.1
93.1
107.4
99.5
105.6
108.3
99.2
99.3
107.1
106.9
115.4
99
100.1
96.2
96.9
96.2
91
99
99
107.2
110.8
111.1
104.6
94.3
90.7
88.8
90.9
90.5
95.5
103.1
100.6
103.1
Dataseries Y:
115.9
112.9
126.3
116.8
112
129.7
113.6
115.7
119.5
125.8
129.6
128
112.8
101.6
123.9
118.8
109.1
130.6
112.4
111
116.2
119.8
117.2
127.3
107.7
97.5
120.1
110.6
111.3
119.8
105.5
108.7
128.7
119.5
121.1
128.4
108.8
107.5
125.6
102.9
107.5
120.4
104.3
100.6
121.9
112.7
124.9
123.9
102.2
104.9
109.8
98.9
107.3
112.6
104
110.6
100.8
103.8
117
108.4
95.5
96.9
103.9
101.1
100.6
104.3
98
99.5
97.4
105.6
117.5
107.4
97.8
91.5
107.7
100.1
96.6
106.8
98
98.6


Summary of compuational transaction
Raw Inputview raw input (R code)
Raw Outputview raw output of R engine
Computing time1 seconds
R Server'Gwilym Jenkins' @ 72.249.127.135

\begin{tabular}{lllllllll}
\hline
Summary of compuational transaction \tabularnewline
Raw Input & view raw input (R code)  \tabularnewline
Raw Output & view raw output of R engine  \tabularnewline
Computing time & 1 seconds \tabularnewline
R Server & 'Gwilym Jenkins' @ 72.249.127.135 \tabularnewline
\hline
\end{tabular}
%Source: https://freestatistics.org/blog/index.php?pk=6512&T=0

[TABLE]
[ROW][C]Summary of compuational transaction[/C][/ROW]
[ROW][C]Raw Input[/C][C]view raw input (R code) [/C][/ROW]
[ROW][C]Raw Output[/C][C]view raw output of R engine [/C][/ROW]
[ROW][C]Computing time[/C][C]1 seconds[/C][/ROW]
[ROW][C]R Server[/C][C]'Gwilym Jenkins' @ 72.249.127.135[/C][/ROW]
[/TABLE]
Source: https://freestatistics.org/blog/index.php?pk=6512&T=0

Globally Unique Identifier (entire table): ba.freestatistics.org/blog/index.php?pk=6512&T=0

As an alternative you can also use a QR Code:  

The GUIDs for individual cells are displayed in the table below:

Summary of compuational transaction
Raw Inputview raw input (R code)
Raw Outputview raw output of R engine
Computing time1 seconds
R Server'Gwilym Jenkins' @ 72.249.127.135


Cross Correlation Function
ParameterValue
Box-Cox transformation parameter (lambda) of X series1
Degree of non-seasonal differencing (d) of X series0
Degree of seasonal differencing (D) of X series0
Seasonal Period (s)12
Box-Cox transformation parameter (lambda) of Y series1
Degree of non-seasonal differencing (d) of Y series0
Degree of seasonal differencing (D) of Y series0
krho(Y[t],X[t+k])
-16-0.0949036323807035
-150.0244495962296422
-14-0.100073335785255
-130.0250457800472754
-120.436910351606634
-110.00988137256266165
-10-0.204153871452883
-90.0163820823857289
-8-0.0838651402376216
-70.0716124042006511
-60.293395647881458
-50.119749271209492
-40.0399189158914294
-30.208359812754977
-2-0.0217236949071002
-10.192419199243157
00.604664328209351
10.0788012723171934
20.0250403647959459
30.146462960407287
4-0.0430434545938679
50.168763695938089
60.290276400496628
70.0504585721979536
80.0458566978802136
90.181044296189260
10-0.118406472823555
110.131636135333294
120.401784790241174
13-0.0262368561627115
140.0245254841084851
150.00988659604286464
16-0.134748297622974

\begin{tabular}{lllllllll}
\hline
Cross Correlation Function \tabularnewline
Parameter & Value \tabularnewline
Box-Cox transformation parameter (lambda) of X series & 1 \tabularnewline
Degree of non-seasonal differencing (d) of X series & 0 \tabularnewline
Degree of seasonal differencing (D) of X series & 0 \tabularnewline
Seasonal Period (s) & 12 \tabularnewline
Box-Cox transformation parameter (lambda) of Y series & 1 \tabularnewline
Degree of non-seasonal differencing (d) of Y series & 0 \tabularnewline
Degree of seasonal differencing (D) of Y series & 0 \tabularnewline
k & rho(Y[t],X[t+k]) \tabularnewline
-16 & -0.0949036323807035 \tabularnewline
-15 & 0.0244495962296422 \tabularnewline
-14 & -0.100073335785255 \tabularnewline
-13 & 0.0250457800472754 \tabularnewline
-12 & 0.436910351606634 \tabularnewline
-11 & 0.00988137256266165 \tabularnewline
-10 & -0.204153871452883 \tabularnewline
-9 & 0.0163820823857289 \tabularnewline
-8 & -0.0838651402376216 \tabularnewline
-7 & 0.0716124042006511 \tabularnewline
-6 & 0.293395647881458 \tabularnewline
-5 & 0.119749271209492 \tabularnewline
-4 & 0.0399189158914294 \tabularnewline
-3 & 0.208359812754977 \tabularnewline
-2 & -0.0217236949071002 \tabularnewline
-1 & 0.192419199243157 \tabularnewline
0 & 0.604664328209351 \tabularnewline
1 & 0.0788012723171934 \tabularnewline
2 & 0.0250403647959459 \tabularnewline
3 & 0.146462960407287 \tabularnewline
4 & -0.0430434545938679 \tabularnewline
5 & 0.168763695938089 \tabularnewline
6 & 0.290276400496628 \tabularnewline
7 & 0.0504585721979536 \tabularnewline
8 & 0.0458566978802136 \tabularnewline
9 & 0.181044296189260 \tabularnewline
10 & -0.118406472823555 \tabularnewline
11 & 0.131636135333294 \tabularnewline
12 & 0.401784790241174 \tabularnewline
13 & -0.0262368561627115 \tabularnewline
14 & 0.0245254841084851 \tabularnewline
15 & 0.00988659604286464 \tabularnewline
16 & -0.134748297622974 \tabularnewline
\hline
\end{tabular}
%Source: https://freestatistics.org/blog/index.php?pk=6512&T=1

[TABLE]
[ROW][C]Cross Correlation Function[/C][/ROW]
[ROW][C]Parameter[/C][C]Value[/C][/ROW]
[ROW][C]Box-Cox transformation parameter (lambda) of X series[/C][C]1[/C][/ROW]
[ROW][C]Degree of non-seasonal differencing (d) of X series[/C][C]0[/C][/ROW]
[ROW][C]Degree of seasonal differencing (D) of X series[/C][C]0[/C][/ROW]
[ROW][C]Seasonal Period (s)[/C][C]12[/C][/ROW]
[ROW][C]Box-Cox transformation parameter (lambda) of Y series[/C][C]1[/C][/ROW]
[ROW][C]Degree of non-seasonal differencing (d) of Y series[/C][C]0[/C][/ROW]
[ROW][C]Degree of seasonal differencing (D) of Y series[/C][C]0[/C][/ROW]
[ROW][C]k[/C][C]rho(Y[t],X[t+k])[/C][/ROW]
[ROW][C]-16[/C][C]-0.0949036323807035[/C][/ROW]
[ROW][C]-15[/C][C]0.0244495962296422[/C][/ROW]
[ROW][C]-14[/C][C]-0.100073335785255[/C][/ROW]
[ROW][C]-13[/C][C]0.0250457800472754[/C][/ROW]
[ROW][C]-12[/C][C]0.436910351606634[/C][/ROW]
[ROW][C]-11[/C][C]0.00988137256266165[/C][/ROW]
[ROW][C]-10[/C][C]-0.204153871452883[/C][/ROW]
[ROW][C]-9[/C][C]0.0163820823857289[/C][/ROW]
[ROW][C]-8[/C][C]-0.0838651402376216[/C][/ROW]
[ROW][C]-7[/C][C]0.0716124042006511[/C][/ROW]
[ROW][C]-6[/C][C]0.293395647881458[/C][/ROW]
[ROW][C]-5[/C][C]0.119749271209492[/C][/ROW]
[ROW][C]-4[/C][C]0.0399189158914294[/C][/ROW]
[ROW][C]-3[/C][C]0.208359812754977[/C][/ROW]
[ROW][C]-2[/C][C]-0.0217236949071002[/C][/ROW]
[ROW][C]-1[/C][C]0.192419199243157[/C][/ROW]
[ROW][C]0[/C][C]0.604664328209351[/C][/ROW]
[ROW][C]1[/C][C]0.0788012723171934[/C][/ROW]
[ROW][C]2[/C][C]0.0250403647959459[/C][/ROW]
[ROW][C]3[/C][C]0.146462960407287[/C][/ROW]
[ROW][C]4[/C][C]-0.0430434545938679[/C][/ROW]
[ROW][C]5[/C][C]0.168763695938089[/C][/ROW]
[ROW][C]6[/C][C]0.290276400496628[/C][/ROW]
[ROW][C]7[/C][C]0.0504585721979536[/C][/ROW]
[ROW][C]8[/C][C]0.0458566978802136[/C][/ROW]
[ROW][C]9[/C][C]0.181044296189260[/C][/ROW]
[ROW][C]10[/C][C]-0.118406472823555[/C][/ROW]
[ROW][C]11[/C][C]0.131636135333294[/C][/ROW]
[ROW][C]12[/C][C]0.401784790241174[/C][/ROW]
[ROW][C]13[/C][C]-0.0262368561627115[/C][/ROW]
[ROW][C]14[/C][C]0.0245254841084851[/C][/ROW]
[ROW][C]15[/C][C]0.00988659604286464[/C][/ROW]
[ROW][C]16[/C][C]-0.134748297622974[/C][/ROW]
[/TABLE]
Source: https://freestatistics.org/blog/index.php?pk=6512&T=1

Globally Unique Identifier (entire table): ba.freestatistics.org/blog/index.php?pk=6512&T=1

As an alternative you can also use a QR Code:  

The GUIDs for individual cells are displayed in the table below:

Cross Correlation Function
ParameterValue
Box-Cox transformation parameter (lambda) of X series1
Degree of non-seasonal differencing (d) of X series0
Degree of seasonal differencing (D) of X series0
Seasonal Period (s)12
Box-Cox transformation parameter (lambda) of Y series1
Degree of non-seasonal differencing (d) of Y series0
Degree of seasonal differencing (D) of Y series0
krho(Y[t],X[t+k])
-16-0.0949036323807035
-150.0244495962296422
-14-0.100073335785255
-130.0250457800472754
-120.436910351606634
-110.00988137256266165
-10-0.204153871452883
-90.0163820823857289
-8-0.0838651402376216
-70.0716124042006511
-60.293395647881458
-50.119749271209492
-40.0399189158914294
-30.208359812754977
-2-0.0217236949071002
-10.192419199243157
00.604664328209351
10.0788012723171934
20.0250403647959459
30.146462960407287
4-0.0430434545938679
50.168763695938089
60.290276400496628
70.0504585721979536
80.0458566978802136
90.181044296189260
10-0.118406472823555
110.131636135333294
120.401784790241174
13-0.0262368561627115
140.0245254841084851
150.00988659604286464
16-0.134748297622974


Parameters (Session):
par1 = 1 ; par2 = 0 ; par3 = 0 ; par4 = 12 ; par5 = 1 ; par6 = 0 ; par7 = 0 ;
Parameters (R input):
par1 = 1 ; par2 = 0 ; par3 = 0 ; par4 = 12 ; par5 = 1 ; par6 = 0 ; par7 = 0 ;
R code (references can be found in the software module):
par1 <- as.numeric(par1)
par2 <- as.numeric(par2)
par3 <- as.numeric(par3)
par4 <- as.numeric(par4)
par5 <- as.numeric(par5)
par6 <- as.numeric(par6)
par7 <- as.numeric(par7)
if (par1 == 0) {
x <- log(x)
} else {
x <- (x ^ par1 - 1) / par1
}
if (par5 == 0) {
y <- log(y)
} else {
y <- (y ^ par5 - 1) / par5
}
if (par2 > 0) x <- diff(x,lag=1,difference=par2)
if (par6 > 0) y <- diff(y,lag=1,difference=par6)
if (par3 > 0) x <- diff(x,lag=par4,difference=par3)
if (par7 > 0) x <- diff(y,lag=par4,difference=par7)
x
y
bitmap(file='test1.png')
(r <- ccf(x,y,main='Cross Correlation Function',xlab='Lag (k)'))
dev.off()
load(file='createtable')
a<-table.start()
a<-table.row.start(a)
a<-table.element(a,'Cross Correlation Function',2,TRUE)
a<-table.row.end(a)
a<-table.row.start(a)
a<-table.element(a,'Parameter',header=TRUE)
a<-table.element(a,'Value',header=TRUE)
a<-table.row.end(a)
a<-table.row.start(a)
a<-table.element(a,'Box-Cox transformation parameter (lambda) of X series',header=TRUE)
a<-table.element(a,par1)
a<-table.row.end(a)
a<-table.row.start(a)
a<-table.element(a,'Degree of non-seasonal differencing (d) of X series',header=TRUE)
a<-table.element(a,par2)
a<-table.row.end(a)
a<-table.row.start(a)
a<-table.element(a,'Degree of seasonal differencing (D) of X series',header=TRUE)
a<-table.element(a,par3)
a<-table.row.end(a)
a<-table.row.start(a)
a<-table.element(a,'Seasonal Period (s)',header=TRUE)
a<-table.element(a,par4)
a<-table.row.end(a)
a<-table.row.start(a)
a<-table.element(a,'Box-Cox transformation parameter (lambda) of Y series',header=TRUE)
a<-table.element(a,par5)
a<-table.row.end(a)
a<-table.row.start(a)
a<-table.element(a,'Degree of non-seasonal differencing (d) of Y series',header=TRUE)
a<-table.element(a,par6)
a<-table.row.end(a)
a<-table.row.start(a)
a<-table.element(a,'Degree of seasonal differencing (D) of Y series',header=TRUE)
a<-table.element(a,par7)
a<-table.row.end(a)
a<-table.row.start(a)
a<-table.element(a,'k',header=TRUE)
a<-table.element(a,'rho(Y[t],X[t+k])',header=TRUE)
a<-table.row.end(a)
mylength <- length(r$acf)
myhalf <- floor((mylength-1)/2)
for (i in 1:mylength) {
a<-table.row.start(a)
a<-table.element(a,i-myhalf-1,header=TRUE)
a<-table.element(a,r$acf[i])
a<-table.row.end(a)
}
a<-table.end(a)
table.save(a,file='mytable.tab')